. 2021 Apr 23;12(1):2424.
doi: 10.1038/s41467-021-22603-4.

Cdk5 and GSK3β inhibit fast endophilin-mediated endocytosis

Affiliations

Cdk5 and GSK3β inhibit fast endophilin-mediated endocytosis

Antonio P A Ferreira et al. Nat Commun. .

Abstract

Endocytosis mediates the cellular uptake of micronutrients and cell surface proteins. Fast Endophilin-mediated endocytosis, FEME, is not constitutively active but triggered upon receptor activation. High levels of growth factors induce spontaneous FEME, which can be suppressed upon serum starvation. This suggested a role for protein kinases in this growth factor receptor-mediated regulation. Using chemical and genetic inhibition, we find that Cdk5 and GSK3β are negative regulators of FEME. They antagonize the binding of Endophilin to Dynamin-1 and to CRMP4, a Plexin A1 adaptor. This control is required for proper axon elongation, branching and growth cone formation in hippocampal neurons. The kinases also block the recruitment of Dynein onto FEME carriers by Bin1. As GSK3β binds to Endophilin, it imposes a local regulation of FEME. Thus, Cdk5 and GSK3β are key regulators of FEME, licensing cells for rapid uptake by the pathway only when their activity is low.


Conflict of interest statement

The authors declare no competing interests.

Figures

Fig. 1
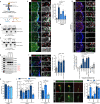
Fig. 1. Acute inhibition of Cdk5 and GSK3 activates FEME.
a Scoring criteria used in the kinase screen. Representative images of decreased, normal, and increased FEME in resting human RPE1 cells treated with 10 μM dobutamine, 10 μM DMSO, and 10 nM GDC-0941 (PI3Ki), respectively. Arrowheads point at FEME carriers. Decreased FEME was assigned for samples with >80% reduction in the number of cytoplasmic Endophilin-positive assemblies (EPAs), in at least 50% of the cells. Increased FEME was attributed to samples with >200% elevation in the number of EPAs, in at least 50% of the cells. The corresponding scoring marks were 0, 1, and 2, respectively. Scale bar, 5 μm. b Kinase screen using small compound inhibitors. RPE1 cells grown in complete medium were incubated for 10 min at 37 °C with the following inhibitors: DMSO, (vehicle); dobutamine, 10 μM (positive control); Dinaciclib (Cdk1/2/5/9i), 1 μM; CHIR-99041 (GSK3i1), 1 μM; BIO (GSK3i2), 1μM; Roscovitine (Cdk1/2/5i), 1 μM; PHA-793887 (Cdk2/5/7i), 100 nM; VX-745 (p38i), 10 μM; JNK-IN-8 (JNKi), 1 μM; staurosporine (broad kinases), 1 μM; GNE-7915 (LRRK2i), 1 μM; AZ191 (DYRK1Bi), 10 μM; GSK2334470 (PDKi), 10 μM; PF-4708671 (p70S6Ki), 10μM; AZ191 (DYRKi), 10 μM; AZD0530 (broad SRCi), 1 μM; TAK-632 (panRAFi), 10 μM; GW 5074 (CRAFi), 1 μM; PD0332991 (Cdk4/6i), 1 μM; MK2206 (AKTi), 1 μM; GDC-0879 (BRAFi), 1 μM; CX-4945 (CK2i), 1 μM; ZM 447439 (AurA/AurBi), 1 μM; RO-3306 (Cdk1i), 100 nM; BI 2536 (PLKi), 1 μM; PD0325901 (MEKi), 100 nM; Genistein (Y-kinases), 1 μM; Purvalanol A (Cdk1/2/4i), 100 nM; MLR 1023 (LYNi), 1 μM; P505-15 (SYKi), 100 nM; CDK1/2 inhibitor III (Cdk1/2i), 100 nM; KT 5720 (PKAi), 100 nM; BI-D1870 (p90RSKi), 100 nM; D4476 (CK1E), 1 μM; PF-4800567 (CK1Ei), 1 μM; SCH772984 (ERKi), 100 nM; STO609 (CaMKK1/2ii), 100 nM; P505-15 (SYKi), 1μM; PND-1186 (FAKi), 100 nM; Torin 1 (mTORC1/2i), 10 μM and GDC-0941 (PI3Ki), 100 nM (negative control). Histograms show the mean ± SEM from 12 well per condition, from three independent biological experiments. Statistical analysis was performed by one-way ANOVA. ns non significant; *P < 0.05, **P < 0.01. c Number of FEME carriers (EPAs) upon titration of CHIR-99021, BIO, Roscovitine and Dinaciclib. Dobutamine and GDC-0941 were used as positive and negative controls, respectively. Plots show the mean ± SEM from three cells per condition and per timepoint, from three independent biological experiments. d β1-adrenergic receptor (β1AR) uptake into FEME carriers in RPE1 cells pre-treated with 5 μM CHIR-99021 (GSK3i) for 5 min, followed by 10 μM dobutamine for 4 min or not (resting). Scale bars, 5 μm. Histograms show the mean ± SEM of the number of FEME carriers (LHS: left hand side) and the number of FEME carriers positive for β1AR per 100 μm2 (RHS: right hand side) (n = 30 cells per condition, from biological triplicates). Arrowheads point at FEME carriers. Statistical analysis was performed by two-way ANOVA. ns non significant; *P < 0.05, **P < 0.01, ***P < 0.001.
Fig. 2
Fig. 2. Endophilin recruits GSK3β for local regulation of FEME.
a Confocal images showing levels of phosphorylated Ser9 GSK3β (pS9-GSK3β) inactive kinase, and colocalization with Endophilin in cells starved of serum for 1 h (serum starved), grown in 10% serum medium (resting) or stimulated with additional serum for 10 min (+10% serum). Arrowheads point at cytoplasmic Endophilin-positive assemblies (EPAs), FEME carriers. Scale bar, 20 μm (main) and 10 μm (inset). b Correlation between the number of EPAs and pS9-GSK3β levels (single cell measurements) in cells that were starved of serum for 1 h (starved), grown in 10% serum medium (resting) or stimulated with additional serum for 10 min (+10% serum), followed by the addition of 10 μM dobutamine for 4 min (red data points) or not (blue data points). Plots show the mean ± SEM from five cells per condition from three independent biological experiments. Linear regression fit is indicated as r2 values. Statistical analysis was performed by one-way ANOVA. ns non significant, ***P < 0.001. c Pull-down experiments using beads with GST-SH3 domains of Endophilin A2 or Bin1, in resting cells or cells treated with 5 μM Dinaciclib (Cdk5i) and CHIR-99021 (GSK3i) for 10 min. GST beads were used as negative control. Bound GSK3β was detected using an antibody that detects both GSK3α and GSK3β. Histograms show the mean ± SEM of GSK3β binding, normalized to resting GST levels from three independent biological experiments. Statistical analysis was performed by one-way ANOVA. ns non significant, ***P < 0.001. d Colocalization of total and phosphorylated Ser9 GSK3β and Endophilin in cells treated with 5 μM Cdk5 and GSK3 inhibitors for 10 min, or not (resting). Arrowheads point at Endophilin spots and FEME carriers. Scale bars, 5 μm. Histograms show the mean ± SEM of Endophilin spots at the leading edge of cells (spots within 1 μm of cell edges, LHS: left hand side) and on EPAs (RHS: right hand side) positive for total or pS9-GSK3β. n = 50 spots or EPAs per condition, from three independent biological experiments. Statistical analysis was performed by one-way ANOVA. ns non significant, ***P < 0.001. e Confocal images showing levels of pS9-GSK3β and colocalization with Endophilin in resting HeLa, HEK, BSC1, RPE1, hDFA, or HUVEC grown in their respective full serum media. Arrowheads point at FEME carriers. Scale bar, 20 μm (main) and 10 μm (inset). f Correlation between the percentage of cells displaying active FEME and their pS9-GSK3β levels (single cell measurements) in the indicated resting cell types. Plots show the mean ± SEM from five cells per condition from three independent biological experiments. Linear regression fit is indicated as r2 value. g Correlation between the number of EPAs and pS9-GSK3β levels (single cell measurements) in the indicated resting cell types. Plots show the mean ± SEM from five cells per condition from three independent biological experiments. Linear regression fit is indicated as r2 value.
Fig. 3
Fig. 3. Cdk5 and GSK3β act in synergy to control FEME.
a Confocal microscopy images of control RPE1 cells (control), or cells in which Cdk5 or GSK3α and β had been knocked-down using RNAi (CDK5 KD or GSK3α/β DKD, respectively) cells. Wild-type (WT), constitutively active (CA) or dominant negative (DN) forms of Cdk5 or GSK3β (green) were overexpressed in a knock-down background and endogenous Endophilin (red) was immunostained, as indicated. All cells were stimulated with +10% FBS (20% final) for 10 min prior to fixation. Arrowheads point at FEME carriers. Scale bars, 20 μm. b Correlation between the number of EPAs and their Cdk5 or GSK3β levels (single cell measurements) in control, Cdk5 or GSK3α/β depleted cells, as indicated. Plots show the mean ± SEM from five cells per condition from three independent biological experiments. Linear regression fit is indicated as r2 value. c Number of EPAs in RPE1 cells treated as indicated in a and d. Histograms show the mean ± SEM from three independent biological experiments (n = 50 per condition). Statistical analysis was performed by one-way ANOVA. ns, non significant; *P < 0.05, **P < 0.01, ***P < 0.001. d Confocal microscopy images of resting control RPE1 cells (control), Cdk5 (CDK5 KD), GSK3α and β (GSK3α/β DKD) or Cdk5 and GSK3α/β (Cdk5 + GSK3α/β TKD) knocked-down cells. Arrowheads point at FEME carriers. Scale bar, 20 μm (main) and 10 μm (inset). e Kymographs from cells expressing low levels of Dynamin1-EGFP and EndophilinA2-RFP, treated with CHIR-99021 (GSK3i) or Dinaciclib (Cdk5i) as indicated and imaged at 2 Hz. Arrowheads point at FEME carriers. Kymographs are representative of at least three captures from biological triplicates. Histograms show the mean ± SEM from three independent biological experiments (n = 3 cells per condition). Statistical analysis was performed by one-way ANOVA. *P < 0.05, ***P < 0.001.
Fig. 4
Fig. 4. Cdk5 and GSK3β regulate Dynamin recruitment onto FEME carriers.
a, Human Dynamin-1 sequence (aa 770-794). Amino acids phosphorylated by GSK3 β (S774) and by Cdk5 (S778) are shown in blue and red, respectively. The proline-rich motif to which Endophilin is known to bind to is shown in orange (underlined). b, Co-immunoprecipitation of Endophilin A2-Myc and Dynamin1-EGFP wild-type (WT), or non-phosphorylatable mutants S774A or S778A. Inputs (I) correspond to 0.5% of the cell extracts), and bound fractions (B) to 90% of material immunoprecipitated. Right, Histograms show the mean ± SEM from three independent biological experiments. Statistical analysis was performed by one-way ANOVA. *P < 0.05. c Pull-down experiments using beads with GST-SH3 domains of Endophilin A2 or Bin1, in resting cells or cells treated with 5 μM Dinaciclib (Cdk5i) and CHIR-99021 (GSK3i) for 10 min. GST beads were used as negative control. X labels a lane that was not used in this study. Inputs correspond to 4% of cell extracts. Right, histograms show the mean ± SEM of Dynamin-1 binding, normalized to resting GST levels from three independent biological experiments. Statistical analysis was performed by two-way ANOVA. *P < 0.05. d Recruitment of endogenous Dynamin onto FEME carriers in RPE1 cells treated for 10 min with 5 μM Dinaciclib (Cdk5i) and/or CHIR-99021 (GSK3i) or not, followed by 10μM dobutamine for 4 min. Arrowheads point at FEME carriers. Scale bars, 5 μm. Histograms show the mean ± SEM from three independent biological experiments (n = 50 cells per condition). Statistical analysis was performed by one-way ANOVA. ***P < 0.001.
Fig. 5
Fig. 5. Cdk5-mediated phosphorylation of CRMP4 inhibits the binding of Endophilin to CRMP4 and the sorting of Plexin A1 into FEME carriers.
a Top, diagram showing the recruitment of CRMP2-5 adaptor complex (CRMP4 highlighted in blue) to Plexin A1 upon stimulation with Semaphorin 3A. Bottom, human CRMP4 protein sequence (aa 508–530). Amino acids phosphorylated by GSK3β (T509, T514, and S518) and by Cdk5 (S522) are shown in blue and red, respectively. The Endophilin binding motif established in this study is shown in orange (underlined). b Co-immunoprecipitation of CRMP4-EGFP and Endophilin A2-Myc from cells treated with 5 μM CHIR-99021 (GSK3i) or Dinaciclib (Cdk5i) as indicated. I, input (10% of the cell extracts), U, unbound (10% of total) and B, bound fractions (80% of total), respectively. c Co-immunoprecipitation of CRMP4-EGFP wild-type (WT), S22D or S522A and Endophilin A2-Myc. I, input (10% of the cell extracts), and B, bound fractions (90% of total), respectively. d Pull-down using GST-SH3 domains of Endophilin A1, A2, or A3 and cell extracts expressing the indicated EGFP-tagged CRMP proteins. GST was used as negative control. Binding proteins were detected by immunoblotting with an anti-EGFP antibody. input lanes correspond to 5% of the cell extracts. e Recruitment of EGFP-tagged CRMP4 WT, S522A, S522D, or R525E onto FEME carriers (cytoplasmic Endophilin-positive assemblies, EPAs) in HUVEC cells. Arrowheads point at FEME carriers. Scale bars, 5 μm. Histograms show the mean ± SEM from three independent biological experiments (n = 30 cells per condition). Statistical analysis was performed by one-way ANOVA; ns non significant; *P < 0.05, **P < 0.01, ***P < 0.001. f Recruitment of endogenous CRMP4 onto FEME carriers in HUVEC cells treated for 10 min with 5μM Dinaciclib (Cdk5i) and/or CHIR-99021 (GSK3i), or left untreated (resting). Arrowheads point at FEME carriers. Scale bars, 5 μm. Histograms show the mean ± SEM from three independent biological experiments (n = 45 cells per condition). Statistical analysis was performed by one-way ANOVA; ns non significant; ***, P < 0.001. g Endogenous Plexin A1 uptake into FEME carriers in HUVEC cells depleted of Endophilin A1, A2, and A3 (Endophilin TKD), Cdk5 and GSK3α and β (CDK5 + GSK3α/β TKD), CRMP4 (CRMP4 KD) or AP2 (AP2 KD) or pre-treated with Cdk5i and/or GSK3i for 5 min. Cells were stimulated by 20 nM Semaphorin 3A (Sema3A) for 5 min in presence of 10 μg/mL anti-PlexinA1 antibodies (recognizing the ectodomain of PlexinA1) or left untreated (resting). Arrowheads point at FEME carriers. Scale bars, 5 μm. Histograms show the mean ± SEM from three independent biological experiments (n = 30 cells per condition). Statistical analysis was performed by one-way ANOVA; ns non significant; ***P < 0.001. h Axon length of mouse hippocampal neurons expressing EGFP-CRMP4 wild type (WT), EGFP-CRMP4 S522A or EGFP-CRMP4 R525E mutants. Histograms show the mean ± SEM of 73, 93, and 38 axons from 4 independent biological experiments, respectively. Statistical analysis was performed by one-way ANOVA; *, P < 0.05, **, P < 0.01. i, Total (Left) or Interstitial (Right) axon branching of mouse hippocampal neurons expressing EGFP-CRMP4 wild type (WT), EGFP-CRMP4 S522A or EGFP-CRMP4 R525E mutants. Histograms show the mean ± SEM of 12, 12 and 24 captures from 3 independent biological experiments, respectively. Statistical analysis was performed by one-way (Right) two-way (Left) ANOVA; ns non significant; *P < 0.05, **P < 0.01. j Axon growth cone collapse in resting or neurons treated with 5 nM of semaphorin 3A and expressing EGFP-CRMP4 wild type (WT), EGFP-CRMP4 S522A or EGFP-CRMP4 R525E mutants. Scale bar, 20 μm. Histograms show the mean ± SEM of 13, 10, and 12 captures from three independent biological experiments, respectively. Statistical analysis was performed by two-way ANOVA; ns non significant; ***P < 0.001.
Fig. 6
Fig. 6. Cdk5 and GSK3β inhibit Dynein recruitment onto FEME carriers.
a, b Juxtaposition of FEME carriers and microtubules in HUVEC cells treated with 10 μM dobutamine for 4 min, 5μM Dinaciclib (Cdk5i) and CHIR-99021 (GSK3i) for 10 min, but not upon mild depolymerization (using 100 nM nocodazole for 10 min prior to dobutamine stimulation). Arrowheads point at FEME carriers. Scale bar, 20 μm (main) and 10 μm (inset). Histograms show the mean ± SEM from three independent biological experiments (n = 100 puncta per condition). Statistical analysis was performed by one-way ANOVA; ns non significant; ***P < 0.001. c, d Recruitment of endogenous Dynein onto FEME carriers in HUVEC cells treated for 10 min with 5 μM Dinaciclib (Cdk5i) and CHIR-99021 (GSK3i) or not, followed by 10 μM dobutamine for 4 min. Arrowheads point at FEME carriers. Scale bars, 5 μm. Histograms show the mean ± SEM from three independent biological experiments (n = 50 cells per condition). Statistical analysis was performed by one-way ANOVA; ***P < 0.001. e Co-immunoprecipitation experiments with EGFP or Endophilin A2-EGFP, in resting cells or cells treated for 30 min with 5μM Dinaciclib (Cdk5i) and CHIR-99021 (GSK3i). I, input (10% of the cell extracts), and B, bound fractions (90% of total), respectively. Histograms show the mean ± SEM from three independent biological experiments. Statistical analysis was performed by one-way ANOVA; ns non significant; *P < 0.05. f Sucrose gradient (0–40%) membrane isolation form RPE1 cells stimulated with 10% FBS (20% final) for 10 min. Fractions were immunoblotted for Endophilin, Bin1, Dynein, Clathrin, Caveolin-1, and Lamp-1. Fraction 7, containing high levels of Endophilin but low levels of Clathrin, Caveolin-1, and Lamp-1 was selected for subsequent immuno-precipitation. g Anti-Endophilin immuno-precipitation from fraction seven samples. Immunoblots measured the levels of Endophilin, Bin1, Dynein, Clathrin and lipids (detected using alcohol-free Coomassie, see “Methods” section) in input (5% of cell extracts), washes (10% of total), unbound (10% of total), and bound (50% of total) samples. Histograms show the mean ± SEM from three independent biological experiments.). Statistical analysis was performed by one-way ANOVA; *P < 0.05, **P < 0.01, ***P < 0.001.
Fig. 7
Fig. 7. Bin1 recruits Dynein onto FEME carriers.
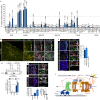
a Colocalization of named EGFP-tagged BAR proteins on FEME carriers marked by endogenous Endophilin in BSC1 cells stimulated with additional 10% serum for 10 min prior to fixation. Histograms show the mean ± SEM from three independent biological experiments (n > 100 puncta per condition). Statistical analysis was performed by one-way ANOVA; NS non significant; P values as indicated. b Colocalization of Bin1-EGFP on FEME carriers marked by endogenous Endophilin in BSC1 cells stimulated with additional 10% serum for 10 min prior to fixation. Arrowheads point at FEME carriers. Scale bar, 20 μm (main) and 10 μm (inset). c Colocalization of endogenous Bin1 and Endophilin upon stimulation with dobutamine, after treatment with 5 μM Dinaciclib (Cdk5i) and CHIR-99021 (GSK3i) for 10 min, or in cells depleted of Bin1 Amphiphysin (Amph + Bin1 DKD). Arrowheads point at FEME carriers. Scale bars, 5 μm. Histograms show the mean ± SEM from three independent biological experiments (n > 150 puncta per condition). Statistical analysis was performed by one-way ANOVA; *P < 0.05, ***P < 0.001. d Pull-down experiments using beads with GST-SH3 domains of Endophilin A2 or Bin1, in resting cells or cells treated with extra 10% FBS for 10 min. GST beads were used as negative control. Inputs correspond to 4% of cell extracts. Bottom, histograms show the mean ± SEM of Dynein binding, normalized to resting GST levels from three independent biological experiments. Statistical analysis was performed by two-way ANOVA; ns non significant; ***P < 0.001. e Colocalisation between Bin1 and Dynein in cells stimulated with extra 10% serum (top), and between endophilin and dynein upon Amphiphysin/Bin1 double knock-down (DKD)(bottom). Arrowheads point at FEME carriers. Scale bars, 5 μm. Histograms show the mean ± SEM from three independent biological experiments (n > 50 puncta per condition). Statistical analysis was performed by one-way ANOVA; ***, P < 0.001. f Model: multi-layered regulation of FEME by Cdk5 and GSK3β: 1) obstruction of CRMP4 binding to Endophilin and thus PlexinA1 sorting into FEME carriers upon Semaphorin 3A stimulation, 2) inhibiton of Dynamin recruitment onto FEME carriers, thus inhibiting vesicle budding and 3) hinderance of Dynein recruitment by Bin1, thereby reducing FEME carriers movement. GSK3β binds to Endophilin and acts locally to hold off FEME. In cells exposed to growth factors, PI3K-mediated signaling activates AKT and other kinases that controls GSK3β activity, and thus license cells for FEME.

References

    1. McMahon HT, Boucrot E. Molecular mechanism and physiological functions of clathrin-mediated endocytosis. Nat. Rev. Mol. Cell Biol. 2011;12:517–533. doi: 10.1038/nrm3151. - DOI - PubMed
    1. Kaksonen M, Roux A. Mechanisms of clathrin-mediated endocytosis. Nat. Rev. Mol. Cell Biol. 2018;19:313–326. doi: 10.1038/nrm.2017.132. - DOI - PubMed
    1. Ferreira APA, Boucrot E. Mechanisms of carrier formation during clathrin-independent endocytosis. Trends Cell Biol. 2018;28:188–200. doi: 10.1016/j.tcb.2017.11.004. - DOI - PubMed
    1. Sandvig K, Kavaliauskiene S, Skotland T. Clathrin-independent endocytosis: an increasing degree of complexity. Histochem. Cell Biol. 2018;150:107–118. doi: 10.1007/s00418-018-1678-5. - DOI - PMC - PubMed
    1. Boucrot E, et al. Endophilin marks and controls a clathrin-independent endocytic pathway. Nature. 2015;517:460–465. doi: 10.1038/nature14067. - DOI - PubMed

Publication types

MeSH terms