. 2021 Apr 23;12(1):2417.
doi: 10.1038/s41467-021-22713-z.

COVID-19 pathophysiology may be driven by an imbalance in the renin-angiotensin-aldosterone system

Affiliations

COVID-19 pathophysiology may be driven by an imbalance in the renin-angiotensin-aldosterone system

Susanne Rysz et al. Nat Commun. .

Abstract

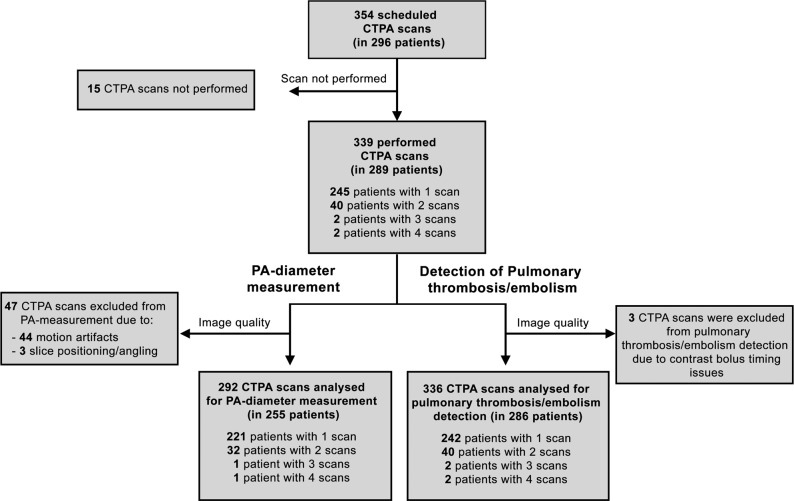
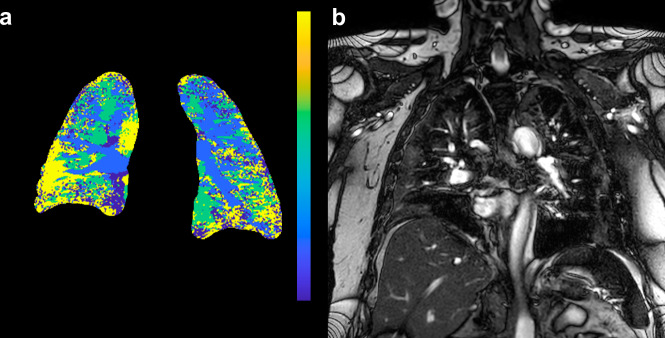
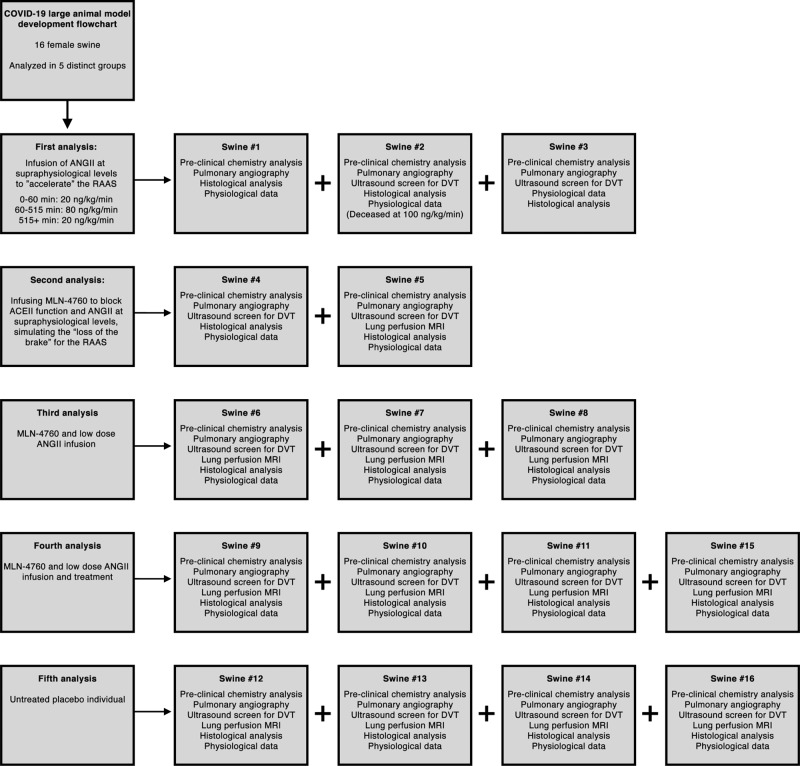
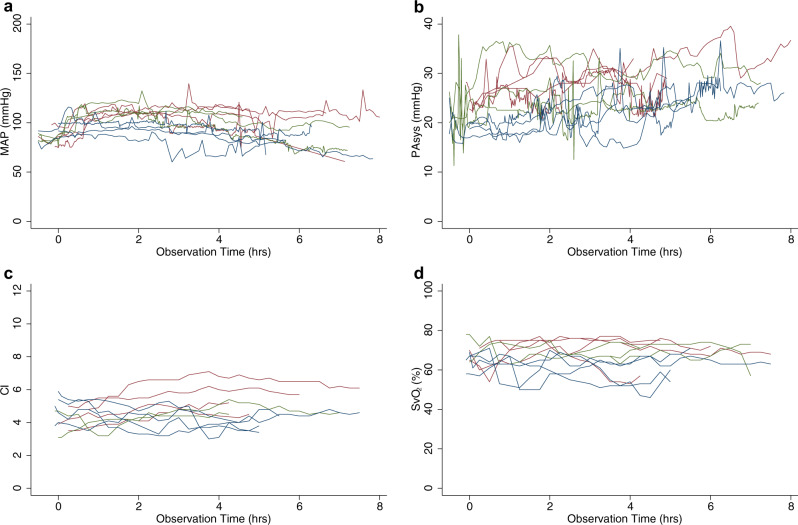
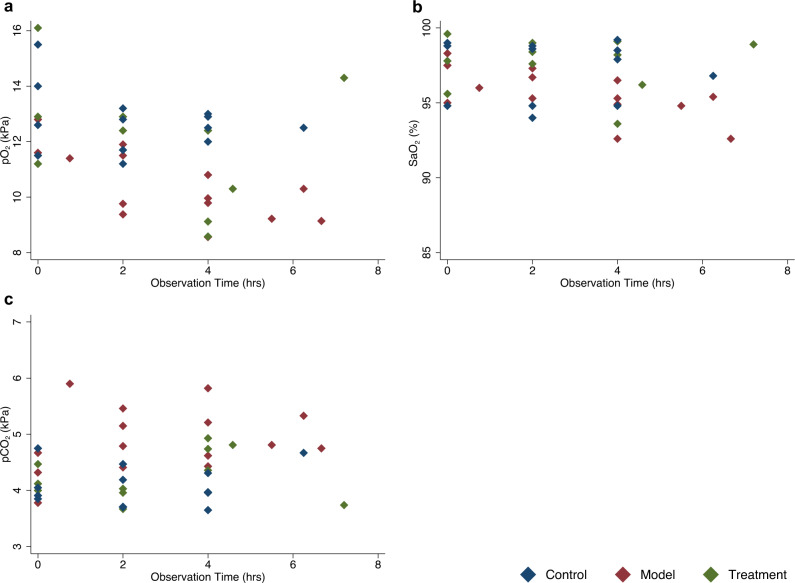
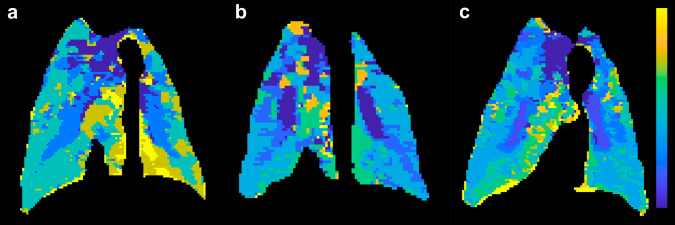
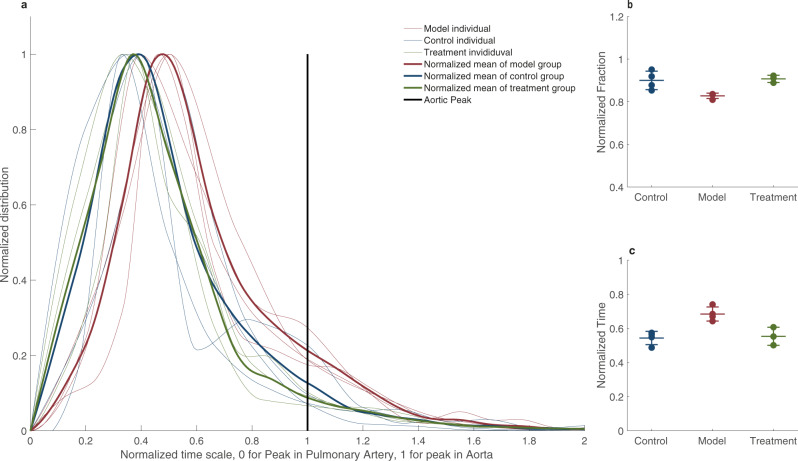
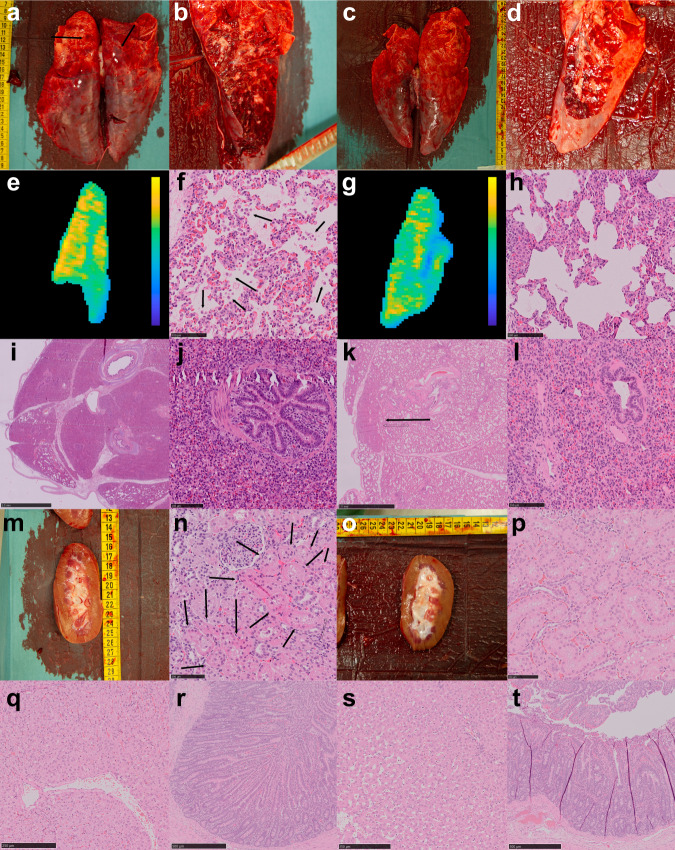
SARS-CoV-2 uses ACE2, an inhibitor of the Renin-Angiotensin-Aldosterone System (RAAS), for cellular entry. Studies indicate that RAAS imbalance worsens the prognosis in COVID-19. We present a consecutive retrospective COVID-19 cohort with findings of frequent pulmonary thromboembolism (17%), high pulmonary artery pressure (60%) and lung MRI perfusion disturbances. We demonstrate, in swine, that infusing angiotensin II or blocking ACE2 induces increased pulmonary artery pressure, reduces blood oxygenation, increases coagulation, disturbs lung perfusion, induces diffuse alveolar damage, and acute tubular necrosis compared to control animals. We further demonstrate that this imbalanced state can be ameliorated by infusion of an angiotensin receptor blocker and low-molecular-weight heparin. In this work, we show that a pathophysiological state in swine induced by RAAS imbalance shares several features with the clinical COVID-19 presentation. Therefore, we propose that severe COVID-19 could partially be driven by a RAAS imbalance.


Conflict of interest statement

The authors declare no competing interests.

Figures

Fig. 1
Fig. 1. Flowchart of the CTPA cohort and subsequent analyses.
CT: computed tomography; CTPA: computed tomography pulmonary angiography; PA: pulmonary artery.
Fig. 2
Fig. 2. MRI of a patient with COVID-19.
a Time-to-peak map of the patient’s lung. The color lookup table has been set to maximum blue for pulmonary artery peak and yellow for aortic peak or later. Note large yellow areas dominating the periphery of the lungs, signifying late or no arrival of contrast. b Reference coronal T2-weighted scan to identify infiltrates. Reviewed together, perfusion disturbances are apparent both within lung infiltrates and in the normal-appearing pulmonary parenchyma.
Fig. 3
Fig. 3. Flowchart of preclinical experiments.
ACE2: Angiotensin-converting enzyme 2; ANGII: Angiotensin II; RAAS: Renin-Angiotensin-Aldosterone System; DVT: Deep Venous Thrombosis; MRI: Magnetic Resonance Imaging.
Fig. 4
Fig. 4. Physiological measurements by groups across time.
a Mean arterial pressure. b Systolic pulmonary artery pressure. c Cardiac index. d Mixed venous saturation. In all graphs, red represents individuals in the model group, blue represents individuals in the control group and, green represents individuals in the treatment group. Source data are provided as source data file.
Fig. 5
Fig. 5. Individual blood gas analysis in arterial blood across time.
a Partial pressure of oxygen. b Blood oxygen saturation. c Partial pressure of carbon dioxide. Red diamonds represent model individuals, blue control individuals, and green treatment individuals. Source data are provided as source data file.
Fig. 6
Fig. 6. Swine MRI perfusion.
a Time-to-peak map of a model swine lung that has received ACE2 inhibition by MLN-4760 and low dose ANGII with the color lookup table set to maximum blue for pulmonary artery peak and yellow for aortic peak or later. b Control swine that has been sedated and performed MRI lung perfusion at approximately the same sedation time as the swine in a. c Treatment swine that has been given oral angiotensin receptor blocker and low molecular weight heparin.
Fig. 7
Fig. 7. Time-to-peak distribution in lungs of swine.
a The distribution of peaks in every individual is plotted with the thinner lines and a solid line represents the mean peak distribution throughout the lungs. In all graphs, red represents the model group, blue represents the control group and, green represents the treatment group. The vertical black bar represents the aorta peak and the cutoff for functional ratio, calculated as the proportion of lung with delayed perfusion (peaking after the aorta). b Individual functional ratios represented by dots and a mean bar with standard deviation whiskers for each group of control (n = 4), model (n = 4), and treatment (n = 3). c The mean time-to-peak of the lungs with each individual as a scatter plot and mean and standard deviation as whiskers. Source data are provided as source data file.
Fig. 8
Fig. 8. Macroscopic and histological postmortem examination.
a Model lungs. Image of posterior aspect with discoloring. b Coronal cut through the posterior aspect of the model lung. c Control lungs. Image of posterior aspect. d Similar coronal cut of a control lung. e The dominating microscopic image in the model lungs was blood stasis in vessels of all sizes. This corresponded to areas with stasis perfusion as illustrated by a parametric max enhancement map from the same model animal (yellow is higher contrast enhancement). f High power magnification (x40) with fluids in the alveolar sacs and sloughing of pneumocytes into the alveolar space (marked by arrows), consistent with early diffuse alveolar damage (scale bar 100 µm). g Parametric relative contrast enhancement, with same color lookup table setting as in e, of control animal. h High power magnification showing a fluid collection in control lung (marked by arrow) in the alveolar sacs (scale bar 100 µm). i The macroscopic texture of the model lung was rubbery. Large areas of the model lungs were fully consolidated (scale bar 2.5 mm). j Fluids and cells in bronchi in a fully consolidated model lung (scale bar 100 µm). k In small areas in the most posterior aspects of the model lungs we could also identify fully consolidated lung (arrow, scale bar 2.5 mm). l Ventilated bronchi in fully consolidated control lungs (scale bar 100 µm). m Model kidney. n Histological sample from model kidney with narrowing of proximal tubule wall thickness and sloughing of epithelial cells (arrows), consistent with acute tubular necrosis (scale bar 100 µm). o Control kidney. p Control kidney without signs of acute tubular necrosis (scale bar 100 µm). q Model liver without histological damage (scale bar 250 µm). r Model small bowel (scale bar 500 µm). s Control liver (scale bar 250 µm). t Control small bowel (scale bar 500 µm).

Similar articles

Cited by

References

    1. Shang J, et al. Structural basis of receptor recognition by SARS-CoV-2. Nature. 2020;581:221–224. doi: 10.1038/s41586-020-2179-y. - DOI - PMC - PubMed
    1. Kuba K, et al. A crucial role of angiotensin converting enzyme 2 (ACE2) in SARS coronavirus–induced lung injury. Nat. Med. 2005;11:875–879. doi: 10.1038/nm1267. - DOI - PMC - PubMed
    1. Gheblawi M, et al. Angiotensin-converting enzyme 2: SARS-CoV-2 receptor and regulator of the renin-angiotensin system: celebrating the 20th anniversary of the discovery of ACE2. Circ. Res. 2020;126:1456–1474. doi: 10.1161/CIRCRESAHA.120.317015. - DOI - PMC - PubMed
    1. Fyhrquist F, Saijonmaa O. Renin‐angiotensin system revisited. J. Intern. Med. 2008;264:224–236. doi: 10.1111/j.1365-2796.2008.01981.x. - DOI - PMC - PubMed
    1. Mehta P, et al. COVID-19: consider cytokine storm syndromes and immunosuppression. Lancet. 2020;395:1033–1034. doi: 10.1016/S0140-6736(20)30628-0. - DOI - PMC - PubMed

Publication types

MeSH terms

Substances