. 2021 Apr 23;12(1):2412.
doi: 10.1038/s41467-021-22694-z.

Cryopreservation method for Drosophila melanogaster embryos

Affiliations

Cryopreservation method for Drosophila melanogaster embryos

Li Zhan et al. Nat Commun. .

Abstract

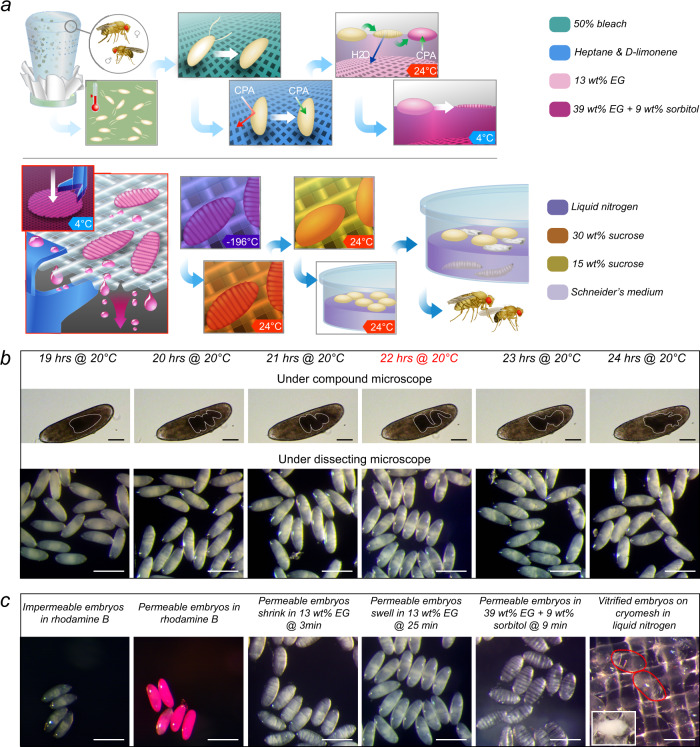
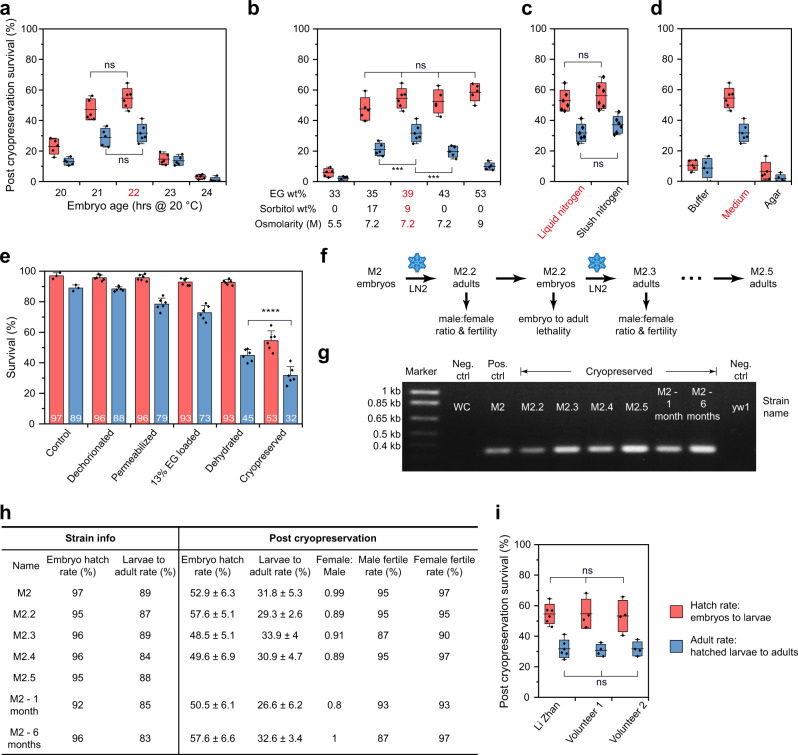
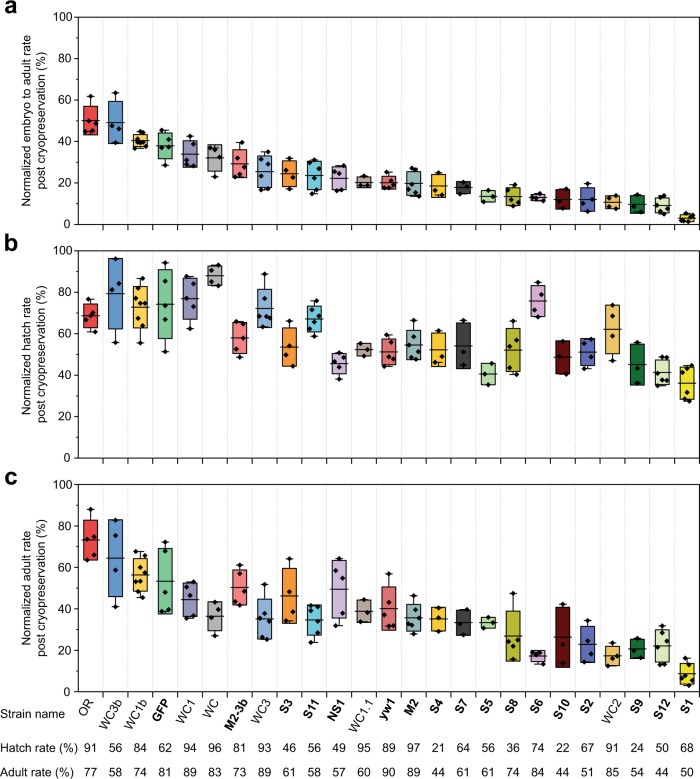
The development of a widely adopted cryopreservation method remains a major challenge in Drosophila research. Here we report a robust and easily implemented cryopreservation protocol of Drosophila melanogaster embryos. We present innovations for embryo permeabilization, cryoprotectant agent loading, and rewarming. We show that the protocol is broadly applicable, successfully implemented in 25 distinct strains from different sources. We demonstrate that for most strains, >50% embryos hatch and >25% of the resulting larvae develop into adults after cryopreservation. We determine that survival can be significantly improved by outcrossing to mitigate the effect of genetic background for strains with low survival after cryopreservation. We show that flies retain normal sex ratio, fertility, and original mutation after successive cryopreservation of 5 generations and 6-month storage in liquid nitrogen. Lastly, we find that non-specialists are able to use this protocol to obtain consistent results, demonstrating potential for wide adoption.


Conflict of interest statement

L.Z., M.L., T.H. and J.B. have provisional patent applications (Serial No. 63/136,366) relevant to this study. The authors declare competing interests.

Figures

Fig. 1
Fig. 1. Schematic overview of cryopreservation procedures for Drosophila melanogaster embryos and detailed pictorial illustration for critical steps.
a On day 1, embryos were collected on a grape juice plate for 1 h period at room temperature (24 °C), then placed in a 20 °C incubator until reaching the desired stage for cryopreservation. On day 2, embryos were first dechorionated and permeabilized, followed by CPA loading and dehydration. The cryomesh was used to pick up the dehydrated embryos for vitrification, storage, rewarming, and CPA unloading. Afterward, embryos were cultured in Schneider’s medium overnight. On day 3, hatched larvae were transferred to food vials until adult emergence. b Images of embryo gut morphology under dissecting and compound microscopes after different incubation time at 20 °C. c Images of embryos at different steps during cryopreservation. From left to right, impermeable and permeable embryos after 5 min in 0.1% rhodamine B; permeable embryos first shrunk then swelled in 13 wt% EG; flattened embryos after dehydration; vitrified embryos appeared transparent in LN2 (two of them were outlined in red), inset is a crystallized embryo (i.e., failure). Five experiments were repeated independently with similar results for (bc). Scale bars in compound microscope images are 100 μm, in dissecting microscope images are 500 μm.
Fig. 2
Fig. 2. Cryopreservation protocol optimization and post cryopreservation evaluation using a strain named M2.
Optimization of (a) embryos age, (b) dehydration CPA compositions, (c) different phase of nitrogen (liquid vs. slush), and (d) post cryopreservation embryo culture methods. Post cryopreservation survival is evaluated by the hatch rate (embryos to larvae) and adult rate (larvae, pupate, then eclose to adults). For (ad), the optimal conditions are labeled in red and a shared y axis is used. e Survival after each step of the cryopreservation process. f Flow chart for evaluation of male to female ratio, fertility, and lethality post cryopreservation across multiple generations. g PCR confirmed the original mutation in M2 was maintained after cryopreservation of multiple generations and different storage time in LN2. Three experiments were repeated independently with similar results. h Post cryopreservation evaluation after multiple generations and different storage time in LN2. i Two volunteers were trained to perform the cryopreservation. The red/blue hatch rate/adult rate labeling applies to the entire Fig. 2. Box and horizontal line represent standard deviation and mean respectively, whiskers represent max and min. Error bars represent standard deviation in (e). n = 5 or 6 for (ad); n = 3 or 6 for (e); n = 4 or 6 for (i); n stands for independent replicates. In (a), for the embryo age of 20 h, 1444 embryos were pooled over n = 5 independent replicates; for the embryo age of 21 h, 1431 embryos were pooled over n = 5 independent replicates; for the embryo age of 22 h, 1695 embryos were pooled over n = 6 independent replicates; for the embryo age of 23 h, 1567 embryos were pooled over n = 5 independent replicates; for the embryo age of 24 h, 1340 embryos were pooled over n = 5 independent replicates. In (b), for 33 wt% EG, 1587 embryos were pooled over n = 5 independent replicates; for 35 wt% EG + 17 wt% sorbitol, 1374 embryos were pooled over n = 5 independent replicates; for 39 wt% EG + 9 wt% sorbitol, 1695 embryos were pooled over n = 6 independent replicates; for 43 wt% EG, 1531 embryos were pooled over n = 5 independent replicates; for 53 wt% EG, 1466 embryos were pooled over n = 5 independent replicates. In (c), for liquid nitrogen, 1695 embryos were pooled over n = 6 independent replicates; for slush nitrogen, 1825 embryos were pooled over n = 6 independent replicates. In (d), for buffer, 1368 embryos were pooled over n = 5 independent replicates; for medium, 1695 embryos were pooled over n = 6 independent replicates; for agar, 1446 embryos were pooled over n = 5 independent replicates. In (e), for control, 1245 embryos were pooled over n = 3 independent replicates; for dechorionated, 1963 embryos were pooled over n = 6 independent replicates; for permeabilized, 1551 embryos were pooled over n = 6 independent replicates; for 13% EG loaded, 1865 embryos were pooled over n = 6 independent replicates; for dehydrated, 1984 embryos were pooled over n = 6 independent replicates; for cryopreserved, 1695 embryos were pooled over n = 6 independent replicates; In (i), for Li Zhan, 1695 embryos were pooled over n = 6 independent replicates; for volunteer 1, 1315 embryos were pooled over n = 4 independent replicates; for volunteer 2, 1256 embryos were pooled over n = 4 independent replicates. Two-sided multivariate analysis of variance (MANOVA) and Tukey’s post hoc were used for statistical analysis. ns, p > 0.05; ***p ≤ 0.001; ****p ≤ 0.0001.
Fig. 3
Fig. 3. Cooling and warming rate using the cryomesh.
a Image of embryos on the cryomesh with CPA removed. Inset is the embryo with minimal (embryo 2) or maximal (embryo 3) contact with the cryomesh (outlined in white). Five experiments were repeated independently with similar results. b After the embryos were collected, the weight on the cryomesh was measured with CPA removed or remaining. c Measured cooling and warming rate of the embryos on the cryomesh. d Post cryopreservation survival with CPA removed or remaining on the cryomesh. e Warming rate modeling for the comparison of CPA remaining (embryo 1) or removed (embryo 2) on the cryomesh. f Simulated warming rates at different cross-sections through the center point of embryo 1 and embryo 2. g With CPA removed, warming rate modeling for embryo with minimal (embryo 2) or maximal (embryo 3) contact with the cryomesh. h Warming rates at different cross-sections through the center point of embryo 2 and embryo 3. In (f) & (h), color scales represent the simulated warming rates. Scale bar is 500 μm. Box and horizontal line represent standard deviation and mean respectively; whiskers represent max and min. n = 8 for (b); n = 12 for (c); n = 4 or 6 for (d); n stands for independent replicates. In (d), 1695 embryos were pooled over n = 6 independent replicates; 1433 embryos were pooled over n = 4 independent replicates. Two-sided multivariate analysis of variance (MANOVA) and Tukey’s post hoc were used for statistical analysis. ***p ≤ 0.001; ****p ≤ 0.0001.
Fig. 4
Fig. 4. Normalized post cryopreservation survival of 25 strains using the universal cryopreservation protocol.
a Normalized embryo to adult rate of the 25 strains with different genotypes after cryopreservation. b Normalized hatch rate (embryos to larvae) and (c) adult rate (larvae, pupate, then enclose to adults) of the 25 strains after cryopreservation. The strain name is listed in (c). The hatch rate and adult rate of the control embryos (without treatment) are listed and used to normalize the post cryopreservation survival. In total, 17 mutant strains were included (strain name bolded). Strain GFP was obtained from the Bloomington Stock Center (stock # 30877). Strain S11 was obtained from the other Drosophila lab. n = 3 to 8 independent replicates for various strains. For strain OR, 1881 embryos were pooled over n = 5 independent replicates; for strain WC3b, 1267 embryos were pooled over n = 4 independent replicates; for strain WC1b, 2519 embryos were pooled over n = 8 independent replicates; for strain GFP, 1859 embryos were pooled over n = 5 independent replicates; for strain WC1, 1439 embryos were pooled over n = 5 independent replicates; for strain WC, 1874 embryos were pooled over n = 4 independent replicates; for strain M2-3b, 1612 embryos were pooled over n = 5 independent replicates; for strain WC3, 1741 embryos were pooled over n = 6 independent replicates; for strain S3, 1006 embryos were pooled over n = 4 independent replicates; for strain S11, 1500 embryos were pooled over n = 6 independent replicates; for strain NS1, 1478 embryos were pooled over n = 5 independent replicates; for strain WC1.1, 1183 embryos were pooled over n = 3 independent replicates; for strain yw1, 1971 embryos were pooled over n = 5 independent replicates; for strain M2, 1695 embryos were pooled over n = 6 independent replicates; for strain S4, 991 embryos were pooled over n = 3 independent replicates; for strain S7, 1077 embryos were pooled over n = 3 independent replicates; for strain S5, 1063 embryos were pooled over n = 3 independent replicates; for strain S8, 1564 embryos were pooled over n = 5 independent replicates; for strain S6, 1112 embryos were pooled over n = 4 independent replicates; for strain S10, 920 embryos were pooled over n = 3 independent replicates; for strain S2, 1119 embryos were pooled over n = 4 independent replicates; for strain WC2, 1664 embryos were pooled over n = 4 independent replicates; for strain S9, 960 embryos were pooled over n = 3 independent replicates; for strain S12, 1644 embryos were pooled over n = 6 independent replicates; for strain S1, 1817 embryos were pooled over n = 6 independent replicates. Box and horizontal line represent standard deviation and mean respectively; whiskers represent max and min.

Similar articles

Cited by

References

    1. Rubin GM, Spradling AC. Genetic transformation of Drosophila with transposable element vectors. Science. 1982;218:348–353. doi: 10.1126/science.6289436. - DOI - PubMed
    1. Medzhitov R, Preston-Hurlburt P, Janeway CA. A human homologue of the Drosophila Toll protein signals activation of adaptive immunity. Nature. 1997;388:394–397. doi: 10.1038/41131. - DOI - PubMed
    1. Adams MD, et al. The genome sequence of Drosophila melanogaster. Science. 2000;287:2185–2195. doi: 10.1126/science.287.5461.2185. - DOI - PubMed
    1. Hammond SM, Bernstein E, Beach D, Hannon GJ. An RNA-directed nuclease mediates post-transcriptional gene silencing in Drosophila cells. Nature. 2000;404:293–296. doi: 10.1038/35005107. - DOI - PubMed
    1. Giot L, et al. A protein interaction map of Drosophila melanogaster. Science. 2003;302:1727–1736. doi: 10.1126/science.1090289. - DOI - PubMed

Publication types

Substances

LinkOut - more resources