. 2021 Apr 23;12(1):2407.
doi: 10.1038/s41467-021-22675-2.

Convergent synthesis of diversified reversible network leads to liquid metal-containing conductive hydrogel adhesives

Affiliations

Convergent synthesis of diversified reversible network leads to liquid metal-containing conductive hydrogel adhesives

Yong Xu et al. Nat Commun. .

Abstract

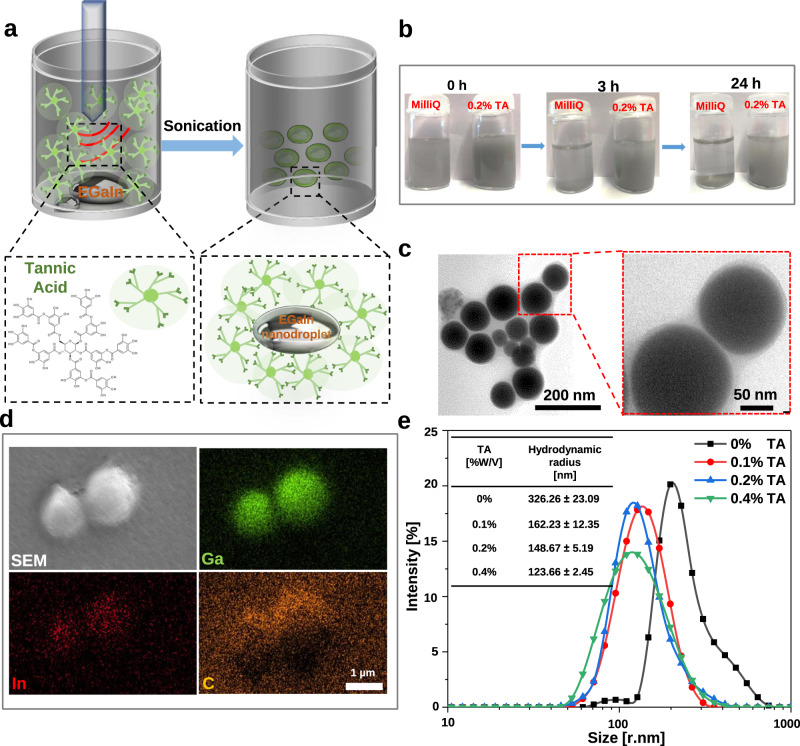
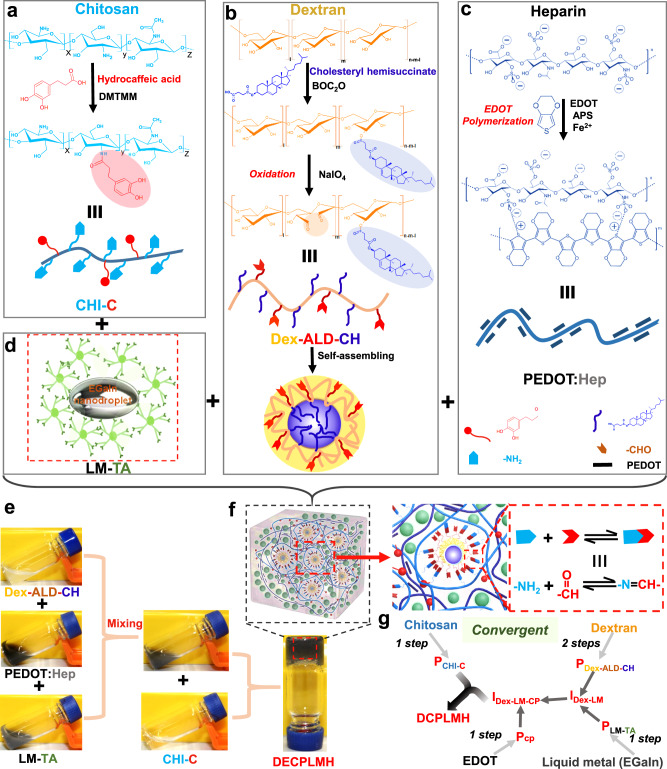
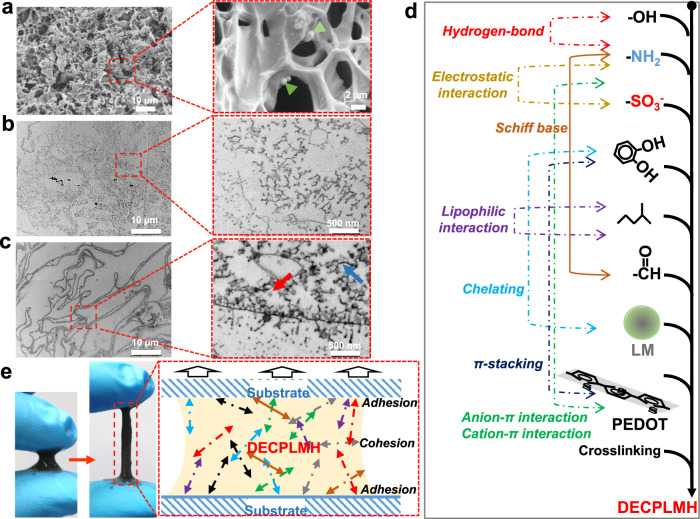
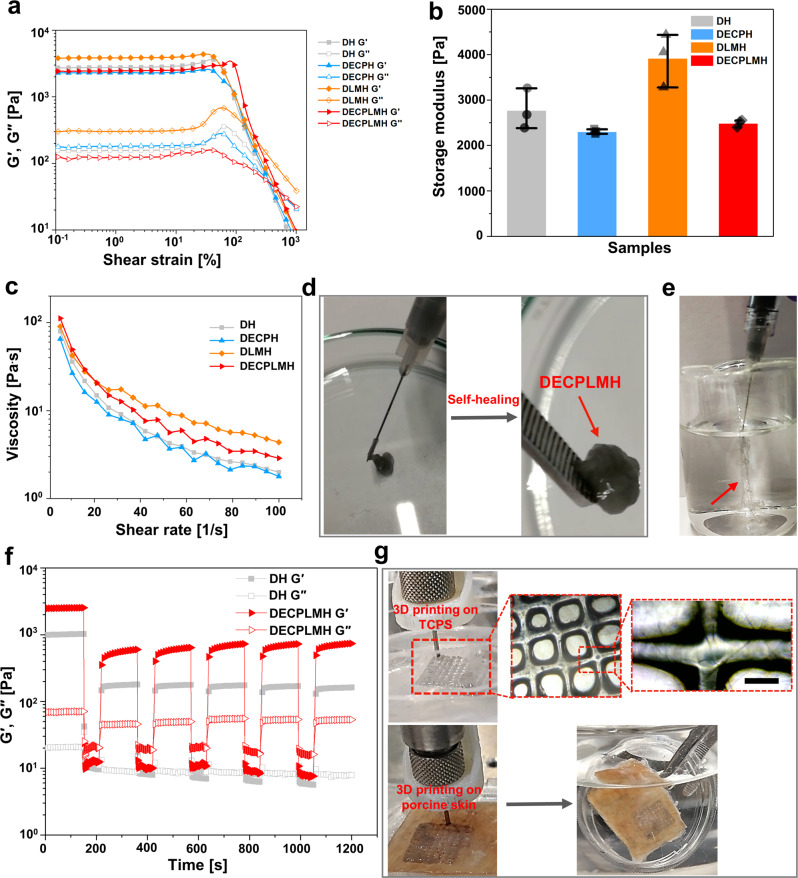
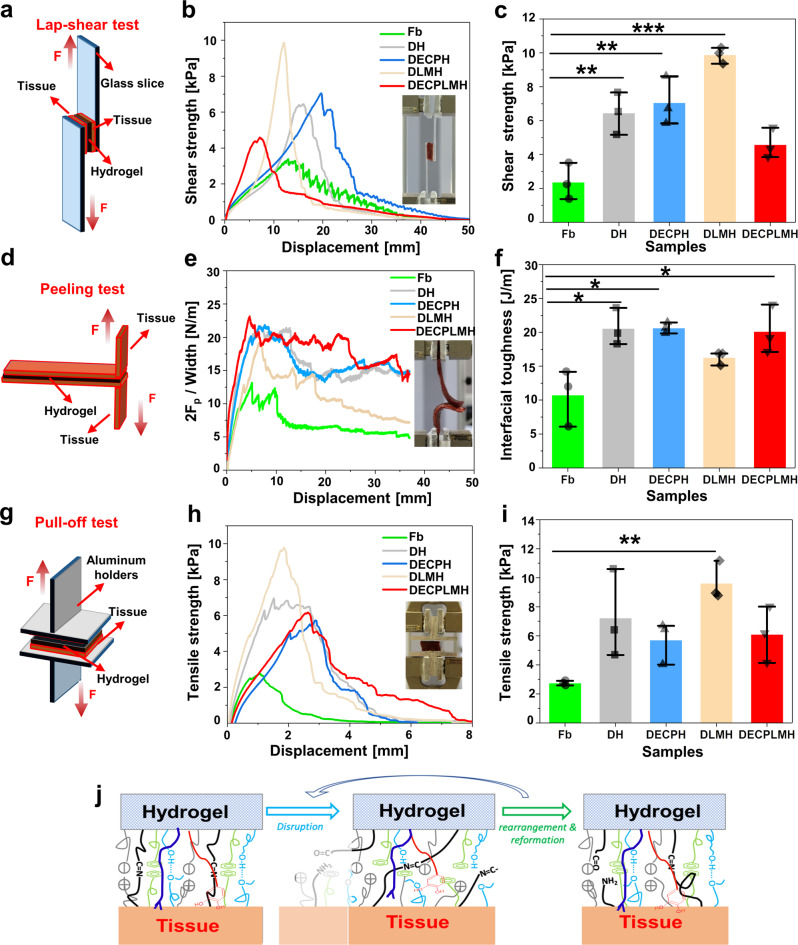
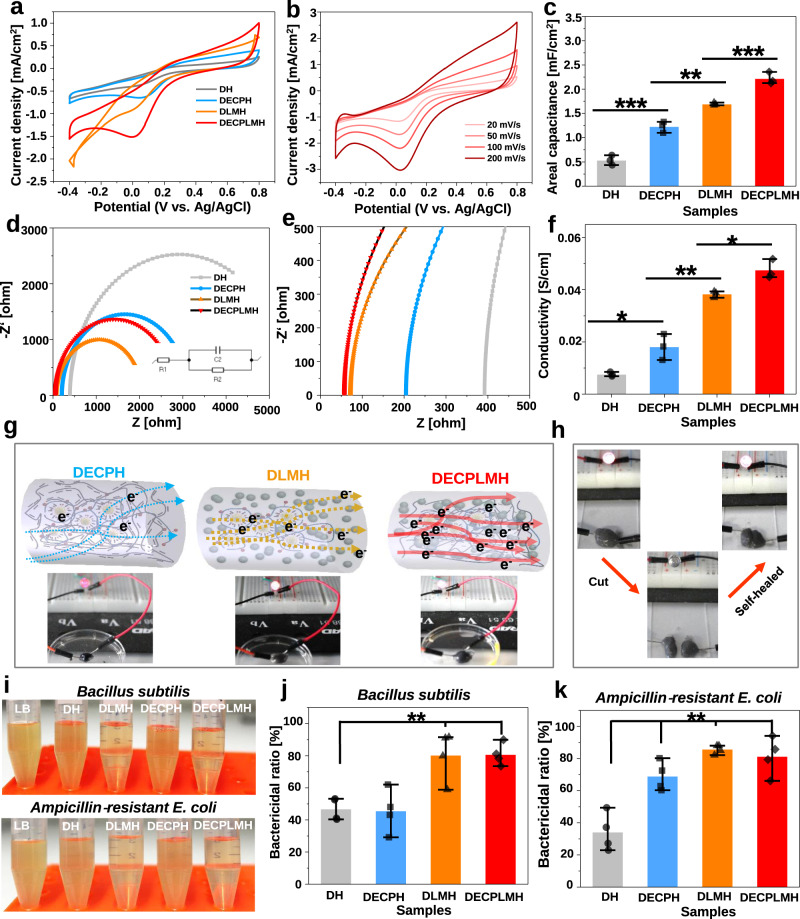
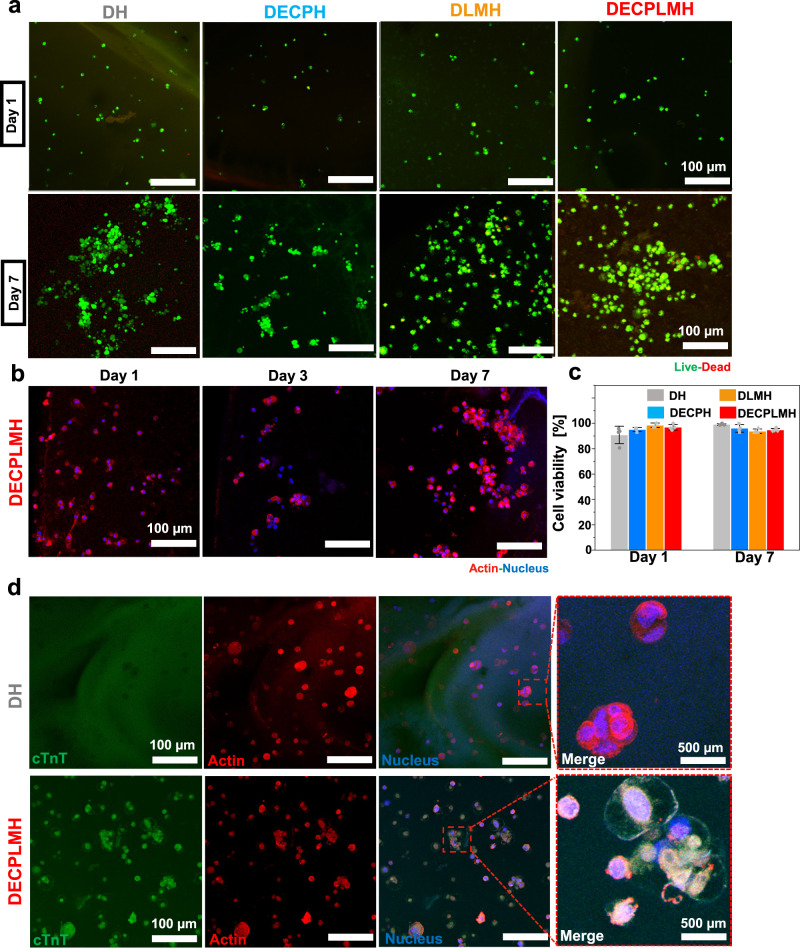
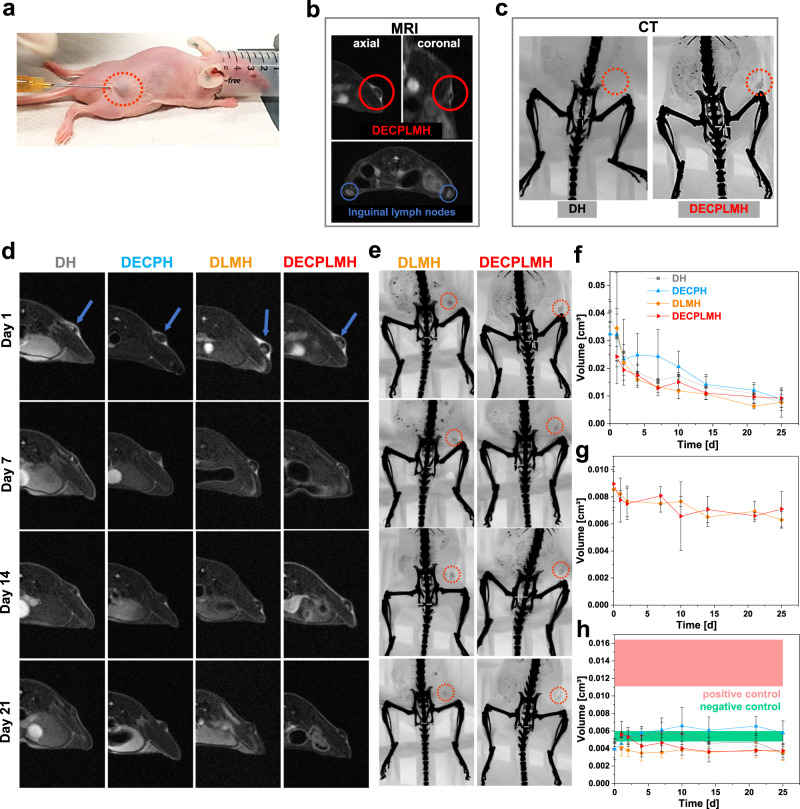
Many features of extracellular matrices, e.g., self-healing, adhesiveness, viscoelasticity, and conductivity, are associated with the intricate networks composed of many different covalent and non-covalent chemical bonds. Whereas a reductionism approach would have the limitation to fully recapitulate various biological properties with simple chemical structures, mimicking such sophisticated networks by incorporating many different functional groups in a macromolecular system is synthetically challenging. Herein, we propose a strategy of convergent synthesis of complex polymer networks to produce biomimetic electroconductive liquid metal hydrogels. Four precursors could be individually synthesized in one to two reaction steps and characterized, then assembled to form hydrogel adhesives. The convergent synthesis allows us to combine materials of different natures to generate matrices with high adhesive strength, enhanced electroconductivity, good cytocompatibility in vitro and high biocompatibility in vivo. The reversible networks exhibit self-healing and shear-thinning properties, thus allowing for 3D printing and minimally invasive injection for in vivo experiments.


Conflict of interest statement

The authors declare no competing interests.

Figures

Fig. 1
Fig. 1. Production of EGaIn nanodroplets.
a Schematic illustration of sonicating eutectic gallium–indium (EGaIn) in tannic acid (TA) solution and EGaIn droplets shelled by tannic acid. b Photos for time-dependent dispersion of liquid metal (LM) in water and tannic acid solution after ultrasonication. c TEM images of tannic acid-coated liquid metal nanodroplets (TA-LM) with core–shell nanostructure. A representative image of three individual experiments is shown. d Cryo-scanning electron microscopy (Cryo-SEM) image of LM droplets. EDS mapping of Ga (gallium), In (indium), and C (carbon). A representative image of three independent samples is shown. e DLS analysis of LM droplets. Inset table: feeding compositions of LM/TA mixture solution and LM droplets size.
Fig. 2
Fig. 2. Characteristics of the dual cross-linked electroconductive hydrogels.
a Schematic illustration of synthesis of catechol-conjugated chitosan (CHI-C). b Schematic illustration of synthesis of cholesteryl hemisuccinate (CH) conjugated oxidized dextran (Dex-ALD-CH). c Schematic illustration of synthesis of poly(3,4-ethylenedioxythiophene)-heparin (PEDOT:Hep). d Liquid metal-tannic acid (LM-TA) nanodroplets. e Representative hydrogel formation by homogenous mixing of Dex-ALD-CH+ PEDOT:Hep+LM-TA with CHI-C solutions in glass vial. f Schematic illustration of the cross-linked polymer networks formed by dynamic Schiff-base bond in dynamic electroconductive biopolymer/liquid metal hydrogels (DECPLMH). g Schematic illustration of convergent synthesis methodology to form the DECPLMH.
Fig. 3
Fig. 3. Illustration of multiple types of reversible chemical bonds that could be important for the development of potent bioadhesives.
a Cryo-SEM images of DECPLMH networks. The arrows in samples indicate LM nanodroplets in the DECPLMH networks. A representative image of three samples is shown. b Transmission electron microscope (TEM) image of DECPH networks. A representative image of three individual experiments is shown. c TEM image of DECPLMH networks. The arrows in samples indicate LM nanodroplets in the DECPLMH networks. A representative image of three individual experiments is shown. d Schematic illustration of multiple types of interactions, which contribute to form the dynamic electroconductive biopolymer/liquid metal hydrogels (DECPLMH). e Photos of DECPLMH are sketched with two fingers and schematic illustration of multiple types of interactions, which contribute to the cohesion and adhesion property of the DECPLMH.
Fig. 4
Fig. 4. Rheological properties of the electroconductive hydrogels.
a Amplitude sweep performed with the shear strain increasing from 0.1% to 1000%. b The storage modulus of hydrogels at 10% shear strain (n = 3 hydrogel samples, mean ± SD). c Continuous flow experiments showing the viscosity of the hydrogels plotted against the shear rate. d Injection of a hydrogel via a syringe with 27G needle onto a plastic plate. The injected dynamic electroconductive biopolymer/liquid metal hydrogels (DECPLMH) maintain their structural integrity when gripped and sticks to the tweezer (indicated by the arrows). e The DECPLMH was syringe-injectable and thin filaments (indicated by the arrows) were extruded into PBS solution. f Self-healing property of the hydrogels when the alternate step strain was switched from 1 to 1000%, indicated by the recoverage of the elastic modulus. g 3D printing of a DECPLMH, which can adhere to the TCPS (tissue culture plastic surface) (upper panel), and the magnification of the printed fiber overlapping area. Scale bar = 200 µm. A representative image of three individual samples is shown. 3D printing in situ on porcine skin (the bottom panel), and remaining stable when holding the dish vertically in the 0.01 M PBS solution.
Fig. 5
Fig. 5. The adhesive property of electroconductive hydrogels.
a Setup for measurement of shear strength. b Adhesion lap-shear testing of hydrogels, where the shear strength is plotted against the displacement. Inset: photo of the experimental setup. c The shear strength of the hydrogels (n = 3 independent hydrogel samples, mean ± SD, one-way ANOVA, Tukey multiple pairwise comparison test for multiple comparisons to Fb gel, DH vs Fb **p = 0.00628, DECPH vs Fb **p = 0.00236, DLMH vs Fb ***p=0.0000495). d Setup for measurement of peeling test. e Curve of double peeling force per adhesive width between the hydrogels and porcine myocardium tissues (inset: photos of the peeling process). f The calculated interfacial toughness between the hydrogels and porcine myocardium tissues (n = 3 independent hydrogel samples, mean ± SD, one-way ANOVA, Tukey multiple pairwise comparison test for multiple comparisons to Fb gel, DH vs Fb *p = 0.0109, DECPH vs Fb **p = 0.0105, DECPLMH vs Fb *p = 0.0711). g Setup for measurement of tensile strength. h Adhesion pull-off testing of hydrogels, where the adhesive strength is plotted against the extension (~distance). Inset: Detail of the experimental setup. i The pull-off strength of the hydrogels (n = 3 independent hydrogel samples, mean ± SD, one-way ANOVA, Tukey multiple pairwise comparison test for multiple comparisons to Fb gel, **p = 0.01). j Illustration of multiple types of reversible chemical bonds formed between the DECPLMH and tissue interface. Data are displayed as mean ± SD (*p < 0.05, **p < 0.01, ***p < 0.001).
Fig. 6
Fig. 6. Electroconductive and antibacterial properties of the electroconductive hydrogels.
a Cyclic voltammograms (current density vs the potential) of hydrogels in PBS at a scan rate of 50 mV·s−1. b Cyclic voltammograms (current density vs the potential) of hydrogels in PBS at different scanning speed. c Areal capacitance of different hydrogels (n = 3 independent hydrogel samples, mean ± SD. One-way ANOVA, Tukey multiple pairwise comparison test for multiple comparisons, DH vs DECPH ***p = 0.000125, DECPH vs DLMH **p = 0.00199, DLMH vs DECPLMH ***p = 0.000891). d Electrochemical impedance spectroscopy of hydrogels (inset: equivalent circuit). e Nyquist plot of the hydrogels. f The conductivity of hydrogels (n = 3 independent hydrogel samples, mean ± SD. One-way ANOVA, Tukey multiple pairwise comparison test for multiple comparisons, DH vs DECPH *p = 0.0158, DECPH vs DLMH **p = 0.00254, DLMH vs DECPLMH *p = 0.0323). g Schematic of hydrogel structures, including dynamic electroconductive polymer hydrogel (DECPH), dynamic liquid metal hydrogel (DLMH), dynamic electroconductive biopolymer/liquid metal hydrogels (DECPLMH). The arrows describe the proposed electron (e) transfer passing through each hydrogel, including a solid line for continuous flow and dashed line for discontinuous flow. LED emitting tests in electrical circuit serially connected with the various hydrogels. h Self-healing properties of the hydrogel: photo demonstrating the good conductivity of the hydrogel after self-healing which based on the LED intensity. i Photos of Bacillus subtilis and Ampicillin‐resistant E. coli solutions co-cultured with the hydrogels after 1 day. j The bactericidal ratio of the hydrogels to Bacillus subtilis (n = 4 biologically independent samples. One-way ANOVA, Tukey multiple pairwise comparison test for multiple comparisons to DH gel, DLMH **p = 0.00726, DECPLMH **p = 0.00459). k The bactericidal ratio of the hydrogels to Ampicillin‐resistant E. coli (n = 4 biologically independent samples. mean ± SD. One-way ANOVA, Tukey multiple pairwise comparison test for multiple comparisons to DH gel, DECPH **p = 0.00346, DLMH **p = 0.00143, DECPLMH **p = 0.00131). Data are displayed as mean ± SD (*p < 0.05, **p < 0.01, ***p < 0.001).
Fig. 7
Fig. 7. Biocompatibility of the electroconductive hydrogels in vitro.
a Live-dead staining of mouse myoblasts cultured in hydrogels at day 1 and day 7, with calcein-AM (green; viable) and ethidium homodimer-1 (red; dead). Scale bar: 100 μm. A representative image of three biological replicates is shown. b Immunofluorescence staining of the cells cultured in DECPLMH at day 1, day 3, and day 7 of the cell nucleus (blue; Hoechst) and actin (red; phalloidin). Scale bar: 100 μm. A representative image of three biological replicates is shown. c The cell viability of the C2C12 cells after 3D culture at day 1 and day 7 (n = 3 biologically independent samples, mean ± SD). d cTnT (green) and actin (red) immunofluorescence staining of C2C12 cells cultured in DH and DECPLMH hydrogels with differentiation medium for 10 days. A representative image of three biological replicates is shown.
Fig. 8
Fig. 8. In vivo hydrogel degradation and biocompatibility.
a Exemplary picture to show the subcutaneous injection of the DECPLMH. b Magnetic resonance imaging (MRI) images of hydrogels and inguinal lymph nodes. c Computed tomography (CT) images of hydrogels containing liquid metal nanoparticles. d Representative MRI and e CT images used for volume determination of hydrogels (red circles indicate hydrogel localization). A representative image of three individual animals is shown. f Volume determination of hydrogels by MRI (n = 3 independent animals, mean ± SD) and g volume of hydrogels containing liquid metal particles measured by CT (n = 3 independent animals, mean ± SD); h Inguinal lymph node size at hydrogel injection site determined by MRI, compared to negative (untreated) and positive (TPA injection) controls (n = 3 independent animals, mean ± SD).
Fig. 9
Fig. 9. In vivo hydrogel biocompatibility.
a Representative immunohistochemical images of markers for inflammation (COX-2, thrombomodulin TM), pan-macrophages (CD68), matrix remodeling (TG-2), and angiogenesis (VEGF, CD31), cell nuclei in blue and positive immunohistological staining in red. The black line indicates hydrogel–tissue interface and arrows point on liquid metal nanoparticles. Immunohistological stainings of three animals per group were conducted and one representative image of each group is shown. b Representative histological images of H&E staining. Three animals per group were conducted with H&E staining and one representative image of each group is shown. c Quantification of immunohistochemical stainings (positive stained area related to cell nuclei area) (n = 3 independent animals, mean ± SD). d Thickness of subcutaneous connective tissue layers based on Van Giesons’s staining compared to negative (untreated) control (n = 3 independent animals, mean ± SD).

Similar articles

Cited by

References

    1. Guilak F, et al. Control of stem cell fate by physical interactions with the extracellular matrix. Cell Stem Cell. 2009;5:17–26. doi: 10.1016/j.stem.2009.06.016. - DOI - PMC - PubMed
    1. Theocharis AD, Skandalis SS, Gialeli C, Karamanos NK. Extracellular matrix structure. Adv. Drug Deliv. Rev. 2016;97:4–27. doi: 10.1016/j.addr.2015.11.001. - DOI - PubMed
    1. Frantz C, Stewart KM, Weaver VM. The extracellular matrix at a glance. J. Cell Sci. 2010;123:4195–4200. doi: 10.1242/jcs.023820. - DOI - PMC - PubMed
    1. Rozario T, DeSimone DW. The extracellular matrix in development and morphogenesis: a dynamic view. Developmental Biol. 2010;341:126–140. doi: 10.1016/j.ydbio.2009.10.026. - DOI - PMC - PubMed
    1. Yuk H, Lu B, Zhao X. Hydrogel bioelectronics. Chem. Soc. Rev. 2019;48:1642–1667. doi: 10.1039/C8CS00595H. - DOI - PubMed

Publication types

MeSH terms