. 2021 Apr 23;12(1):2435.
doi: 10.1038/s41467-021-22757-1.

Forecasting the dissemination of antibiotic resistance genes across bacterial genomes

Affiliations

Forecasting the dissemination of antibiotic resistance genes across bacterial genomes

Mostafa M H Ellabaan et al. Nat Commun. .

Abstract

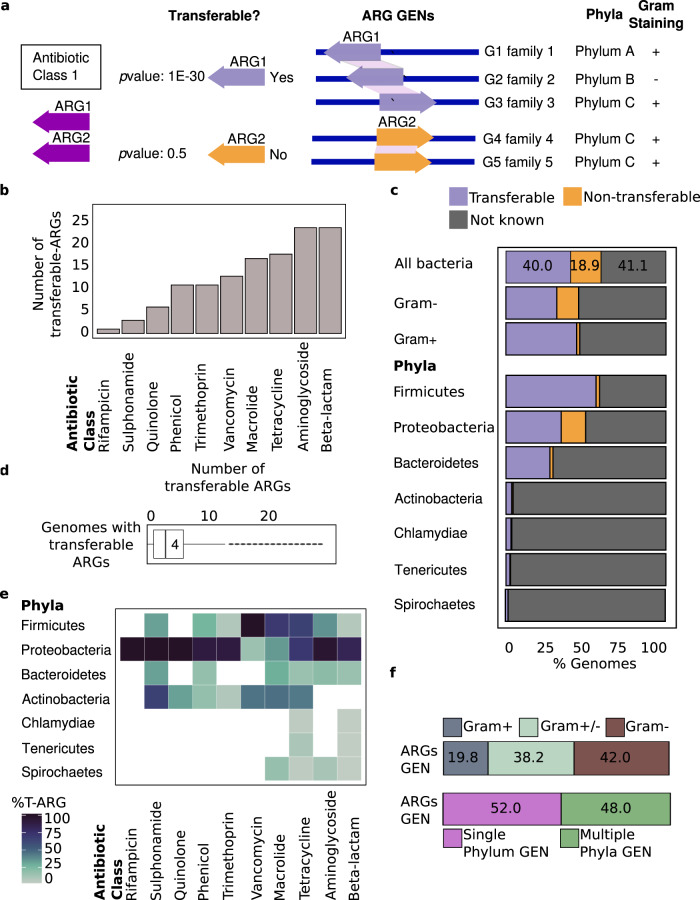
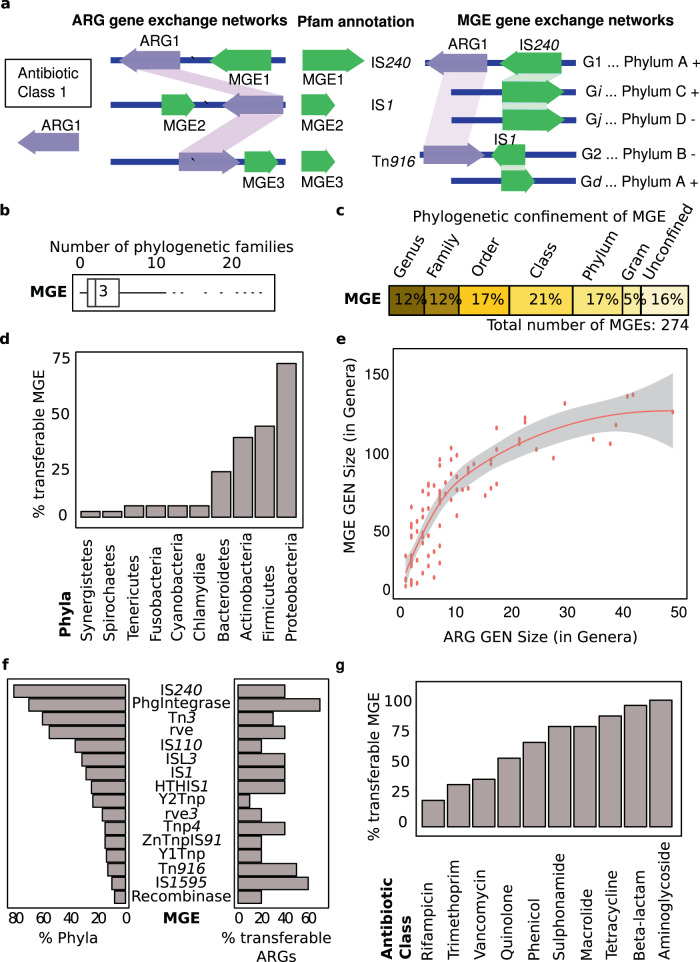
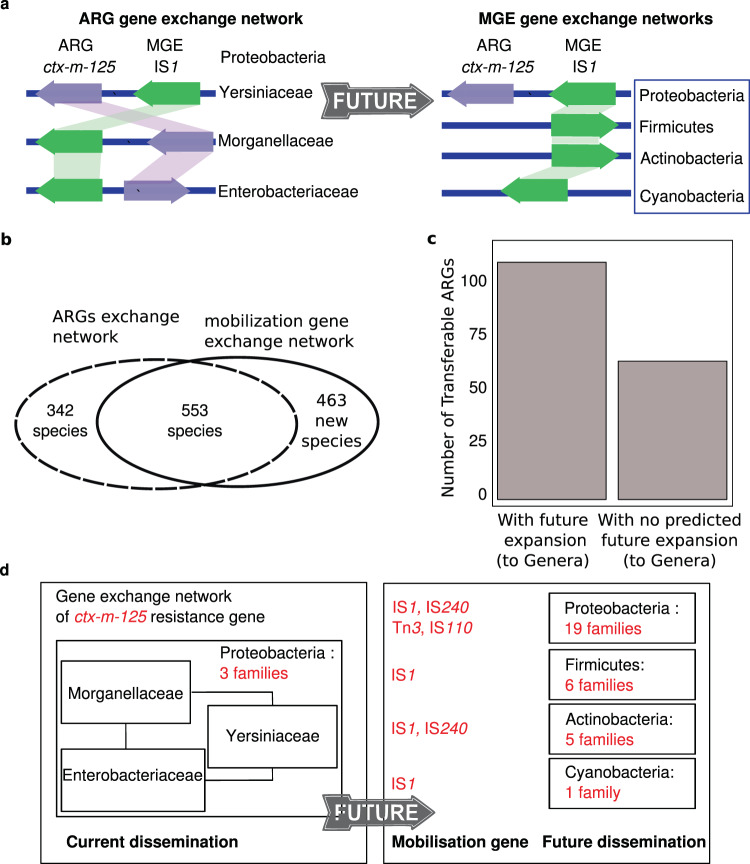
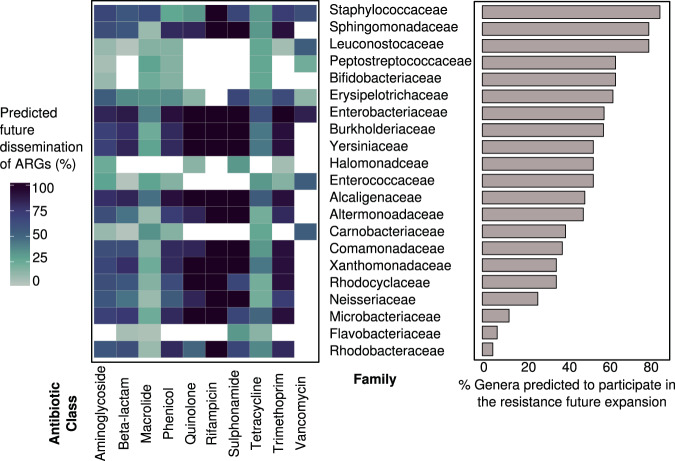
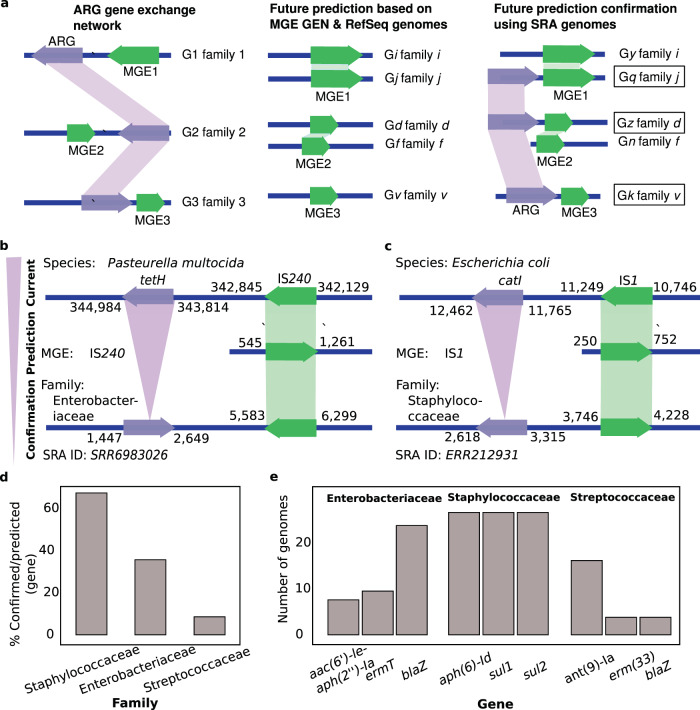
Antibiotic resistance spreads among bacteria through horizontal transfer of antibiotic resistance genes (ARGs). Here, we set out to determine predictive features of ARG transfer among bacterial clades. We use a statistical framework to identify putative horizontally transferred ARGs and the groups of bacteria that disseminate them. We identify 152 gene exchange networks containing 22,963 bacterial genomes. Analysis of ARG-surrounding sequences identify genes encoding putative mobilisation elements such as transposases and integrases that may be involved in gene transfer between genomes. Certain ARGs appear to be frequently mobilised by different mobile genetic elements. We characterise the phylogenetic reach of these mobilisation elements to predict the potential future dissemination of known ARGs. Using a separate database with 472,798 genomes from Streptococcaceae, Staphylococcaceae and Enterobacteriaceae, we confirm 34 of 94 predicted mobilisations. We explore transfer barriers beyond mobilisation and show experimentally that physiological constraints of the host can explain why specific genes are largely confined to Gram-negative bacteria although their mobile elements support dissemination to Gram-positive bacteria. Our approach may potentially enable better risk assessment of future resistance gene dissemination.


Conflict of interest statement

The authors declare no competing interests.

Figures

Fig. 1
Fig. 1. Dissemination of resistance genes summarized by antibiotic class and phylum.
a Conceptual guide linking antibiotic classes to phyla and gram staining through transferable ARGs and genomes in ARGs gene exchange networks (GENs). b Number of transferable ARGs per antibiotic class. c Percent of genomes in indicated phyla with transferable ARGs, nontransferable ARGS, or no known resistance genes. d Distribution of transferable ARGs across genomes. Box indicates range, line within box indicates median for all genomes, dark dots indicate outliers. e Heatmap of % transferable ARGs (T-ARGs) per antibiotic class observed for indicated phyla. f Distribution of genomes with transferable ARGs in GENs. Top, percent of GENs with Gram-negative and -positive genomes (+/− means both). Bottom, percent of GENs with one phylum or with multiple phyla. Source data are provided in Supplementary Data 1, 2, 3, and 14.
Fig. 2
Fig. 2. Mobile genetic elements (MGEs) in gene exchange networks (GENs).
a Conceptual guide to show how we extracted the mobile genetic elements from the ARG neighboring regions, annotated them using Pfam, and identified the MGE gene exchange network. b Distribution of MGEs based on phylogenetic families that participated in dissemination. Box, range of number of families; line and number, median; dots, outliers. c Distribution of phylogenetic confinement of MGEs. Percents of MGEs confined to a certain phylogenetic classification. d Percents of total MGEs that were observed in indicated phyla. e Distribution of ARG GEN size (as number of genera) versus associated MGE GEN size. Red line, mean values; shaded area, erorr bands as mean values +/− SEM. f Dissemination of MGEs across microbial phyla and their association with transferable ARGs observed in their neighbourhood. To left, n = number of phyla with a given MGE over seven phyla participating in ARGs gene exchange networks. To right, n = number of transferable ARGs neighbouring a given MGE over the total number of transferable ARGs (152 ARGs). g Percentage of MGEs associated with ARGs by antibiotic class to which resistance is conferred. Source data are provided in Supplementary Data 1, 3, 5, and 14.
Fig. 3
Fig. 3. Predicted transfer of antibiotic resistance genes (ARGs) to new bacterial families.
a Conceptual guide: Left, the ARG gene exchange network, including neighbouring mobilisation contexts and phylogenetic information of the genomes. Right, ARG-associated mobile genetic element (MGE) and gene exchange network; blue-bordered boxes highlight probable phyla where ARGs may reach a new bacterial family in the future. b Difference and overlap of species in MGE and ARG GENs. c Number of transferable ARGs with potential future expansion to other genera through their MGE GEN. d Example: the ctx-m-125 gene, observed in three families and expected to reach 31 new families using different MGEs. The gray arrow highlights the prediction of the ctx-m-125 dissemination potential from its current dissemination. Boxes show future expansion of ctx-m-125 by number of families within a phylum. Source data are provided in Supplementary Data 1, 3, 5, and 14.
Fig. 4
Fig. 4. Predicted transfer of antibiotic resistance genes (ARGs) to new bacterial families.
Heatmap shows percents of transferable ARGs by affected antibiotic class with potential for future dissemination to indicated bacterial families. Barchart shows percents of genera within each family that may receive new ARGs based on their current association with a relevant mobile genetic element. Source data are provided in Supplementary Data 1, 3, 5, 10, and 14.
Fig. 5
Fig. 5. Computational confirmation analyses.
a Conceptual guide linking ARGs from gene exchange networks (GENs) to future hosts via their neighbouring MGEs and MGE GENs and confirming horizontal gene transfer predictions via SRA genomes. Boxes show confirmed transfers of ARGs to predicted hosts. b Example: computational confirmation for the tetH gene predicted in Enterobacteriaceae. The gene was observed near IS240 in Pasteurella with IS240 observed in Enterobacteriaceae genome GCF 000693615.1 and confirmed in the Enterobacteriaceae National Centre for Biotechnology Information Sequence Read Archive (SRA) genome SRR6983026. c Example: computational confirmation using catI and IS1, observed in Escherichia in the current GEN with IS1 seen in Staphylococcaceae genome GCF 000159555.1 and catI and IS1 found together in Staphylococcaceae SRA genome ERR212931. d Percents of predicted genes confirmed for indicated families. e Top three genes for indicated families that were observed to be in a significant number of genomes. Source data are provided in Supplementary Data 11.

Similar articles

Cited by

References

    1. Sommer, M. O., Munck, C., Toft-Kehler, R. V. & Andersson, D. I. Prediction of antibiotic resistance: time for a new preclinical paradigm? Nat. Rev. Microbiol.15, 689–696 (2017). - PubMed
    1. Hamilton, W. L. & Wenlock, R. Antimicrobial resistance: a major threat to public health. Camb. Med. J.10.7244/cmj (2016).
    1. Allen, H. K. et al. Call of the wild: antibiotic resistance genes in natural environments. Nat. Rev. Microbiol.8, 251–259 (2010). - PubMed
    1. Forsberg, K. J. et al. The shared antibiotic resistome of soil bacteria and human pathogens. Science337, 1107–1111 (2012). - PMC - PubMed
    1. Martínez, J. L. Antibiotics and antibiotic resistance genes in natural environments. Science321, 365–367 (2008). - PubMed

Publication types

MeSH terms

Substances