. 2021 Apr 23;4(1):501.
doi: 10.1038/s42003-021-02012-5.

High and specific diversity of protists in the deep-sea basins dominated by diplonemids, kinetoplastids, ciliates and foraminiferans

Affiliations

High and specific diversity of protists in the deep-sea basins dominated by diplonemids, kinetoplastids, ciliates and foraminiferans

Alexandra Schoenle et al. Commun Biol. .

Abstract

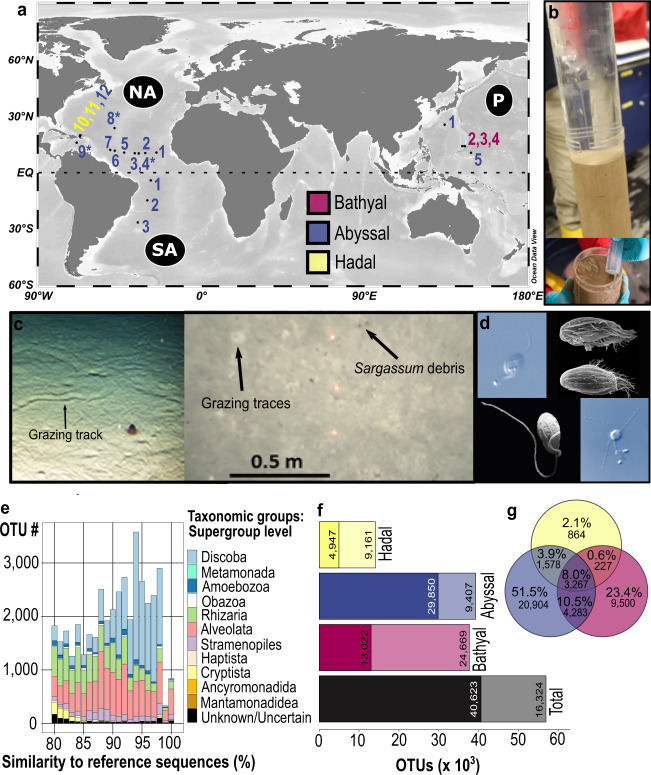
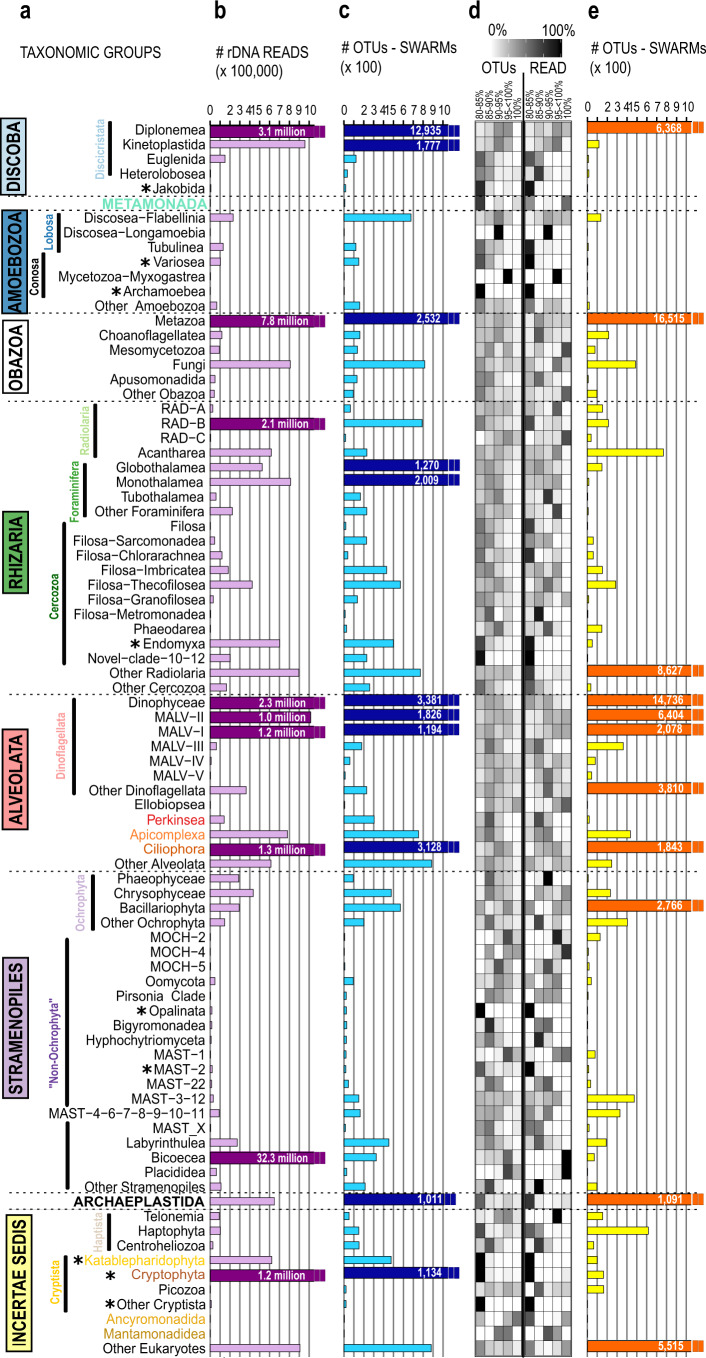
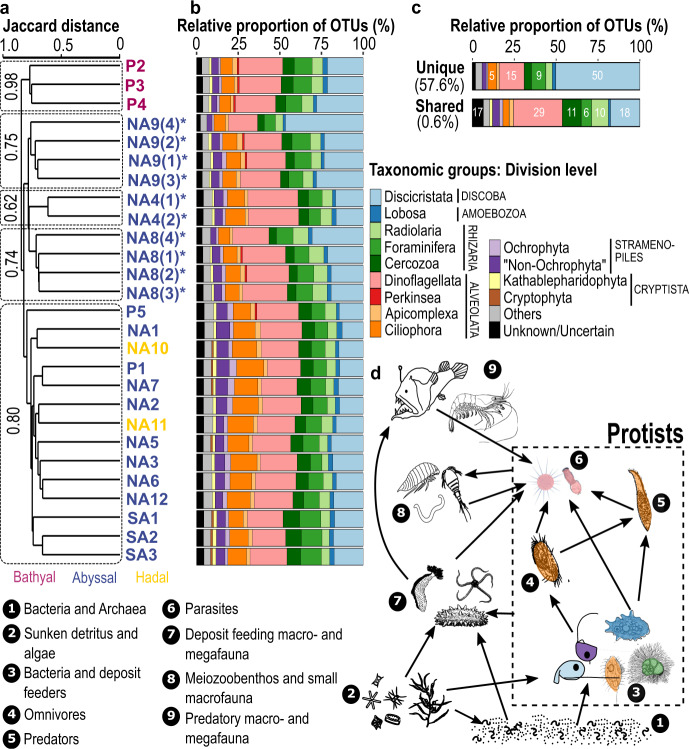
Heterotrophic protists (unicellular eukaryotes) form a major link from bacteria and algae to higher trophic levels in the sunlit ocean. Their role on the deep seafloor, however, is only fragmentarily understood, despite their potential key function for global carbon cycling. Using the approach of combined DNA metabarcoding and cultivation-based surveys of 11 deep-sea regions, we show that protist communities, mostly overlooked in current deep-sea foodweb models, are highly specific, locally diverse and have little overlap to pelagic communities. Besides traditionally considered foraminiferans, tiny protists including diplonemids, kinetoplastids and ciliates were genetically highly diverse considerably exceeding the diversity of metazoans. Deep-sea protists, including many parasitic species, represent thus one of the most diverse biodiversity compartments of the Earth system, forming an essential link to metazoans.


Conflict of interest statement

The authors declare no competing interests.

Figures

Fig. 1
Fig. 1. Heterotrophic deep-sea protist diversity and distribution.
a Map of the 20 examined deep-sea stations. Multiple sediment samples were analyzed separately at stations marked with an asterisk for the investigation of small-scale distribution patterns. In the North Atlantic Ocean (NA) samples were collected during two expeditions (one in summer marked with asterisk, one in winter marked with dots, map created with Ocean Data View). b Only the upper 2 mm of undisturbed sediment from cores of the Multi-Corer were taken with a sterile syringe. c Images from the abyssal sea floor showing small-scale heterogeneity including grazing tracks and traces (e.g., polychaetes, holothurians), and Sargassum debris (© Nils Brenke, Nico Augustin, GEOMAR Kiel). d Observed deep-sea flagellates Rhynchomonas nasuta (upper left), Euplotes dominicanus (upper right), Keelungia nitschei (lower left), and Massisteria marina (lower right). e Similarity of heterotrophic protist rDNA richness (~22% of the total unfiltered OTUs) to total referenced eukaryotic rDNA diversity in the V9_DeepSea database. Proportion of OTUs per taxonomic group (corresponding to supergroups in the PR2 database classification) is color-coded. “Unknown/Uncertain” OTUs have been either assigned to several taxonomic division levels or to sequences taxonomically assigned only to Eukaryota. f Observed (dark colored) and estimated (light colored) OTUs based on the Incidence Coverage Estimator (ICE). g Venn diagram showing the number of unique and shared OTUs between the three different depth zones.
Fig. 2
Fig. 2. Taxonomic partitioning of the total assignable eukaryotic ribosomal diversity (V9 SSU rDNA) from the deep-sea and Tara Oceans datasets.
a Deep-branching eukaryotic taxonomic groups observed in the deep sea. Taxonomic groups include supergroups (see also Fig. 1), division (see also Fig. 3), and class/order (this figure) level as given in the PR2 database classification. Taxonomic groups, which are used in Fig. 1 (supergroups) and Fig. 3 (divisions), are colored. Asterisks indicate that >90% of reads within this lineage had a 80–85% sequence similarity to reference sequences. b Deep-sea eukaryotes abundance expressed as numbers of rDNA reads. Scaling of axis ranges from 0 to 1 million reads. Taxonomic groups with more than 1 million reads exceed the axis and are indicated with dark-purple bars and the number of reads is written within the bars (nine most abundant lineages with >1 million reads). c Deep-sea eukaryotes’ richness expressed as numbers of OTUs. Scaling of axis ranges from 0 to 1000 OTUs. Taxonomic groups containing >1000 OTUs exceed the axis and are indicated with dark-blue bars and the number of OTUs is written within the bars (11 hyperdiverse lineages containing >1000 OTUs). d Percentage of rDNA reads and OTUs (calculated within each taxonomic group itself) with various ranges of sequence similarity (80–85%, 85–90%, 90–95%, 95–<100%, and 100%) to reference sequences. e Sunlit ocean eukaryotic richness expressed as number of OTUs from the Tara Oceans global metabarcoding dataset. Taxonomic groups containing >1000 OTUs exceed the axis and are indicated with red bars and the number of OTUs is written within the bars.
Fig. 3
Fig. 3. Distributional patterns and community composition of deep-sea heterotrophic protists.
a Dendrogram cluster showing the similarity (Jaccard index) of heterotrophic protist communities of the 27 sediment samples in regard to species richness based on incidence-based data (presence/absence) using UPGMA clustering. The five clusters are supported by moderate to high bootstrap values. Multiple sediment samples were analyzed separately at stations marked with an asterisk for the investigation of small-scale distribution patterns. b Relative proportion of OTUs within the 27 deep-sea sediment samples related to the major taxonomic protist groups. Taxonomic groups (corresponding to division level in the PR2 database classification) are only separately shown, when the number of OTUs reached more than 1% within each sample. Otherwise, OTUs were clustered together into “Others”. “Unknown/Uncertain” OTUs have been either assigned to several taxonomic division levels or to sequences taxonomically assigned only to Eukaryota. c Relative proportion of shared (0.6%) and unique (57.6%) OTUs (heterotrophic protist richness) within all 27 sediment samples (obtained from 20 deep-sea stations). d Hypothetical deep-sea food web illustrating the generally ignored complex trophic interactions between microbial and macrobial components derived from their molecular diversity. Highly diverse and abundant protists are embedded in deep-sea food webs on different trophic levels as feeders on prokaryotes and particulate and dissolved organic matter, as predators, as well as parasites of metazoans and protists.

References

    1. Danovaro R, Snelgrove PVR, Tyler P. Challenging the paradigms of deep-sea ecology. Trends Ecol. Evol. 2014;29:465–475. doi: 10.1016/j.tree.2014.06.002. - DOI - PubMed
    1. Ebbe, B. et al. In Life in the World’s Oceans: Diversity, Distribution, and Abundance (ed. McIntyre, A. D.) 139–160 (Blackwell Publishing Ltd, 2010).
    1. Edgcomb V. Marine protist associations and environmental impacts across trophic levels in the twilight zone and below. Curr. Opin. Microbiol. 2016;31:169–175. doi: 10.1016/j.mib.2016.04.001. - DOI - PubMed
    1. Bienhold C, Zinger L, Boetius A, Ramette A. Diversity and biogeography of bathyal and abyssal seafloor bacteria. PLoS ONE. 2016;11:e0148016. doi: 10.1371/journal.pone.0148016. - DOI - PMC - PubMed
    1. del Campo J, Massana R. Emerging diversity within chrysophytes, choanoflagellates and bicosoecids based on molecular surveys. Protist. 2011;162:435–448. doi: 10.1016/j.protis.2010.10.003. - DOI - PubMed

Publication types

MeSH terms