. 2021 Jul 15;224(2):207-217.
doi: 10.1093/infdis/jiab199.

Introduction, Transmission Dynamics, and Fate of Early Severe Acute Respiratory Syndrome Coronavirus 2 Lineages in Santa Clara County, California

Affiliations

Introduction, Transmission Dynamics, and Fate of Early Severe Acute Respiratory Syndrome Coronavirus 2 Lineages in Santa Clara County, California

Elsa Villarino et al. J Infect Dis. .

Abstract

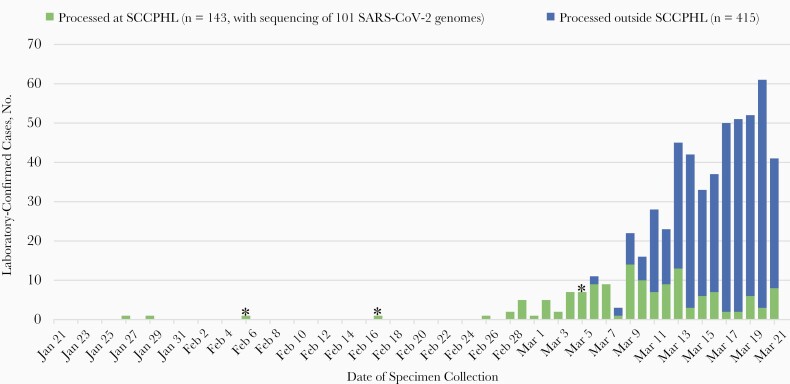
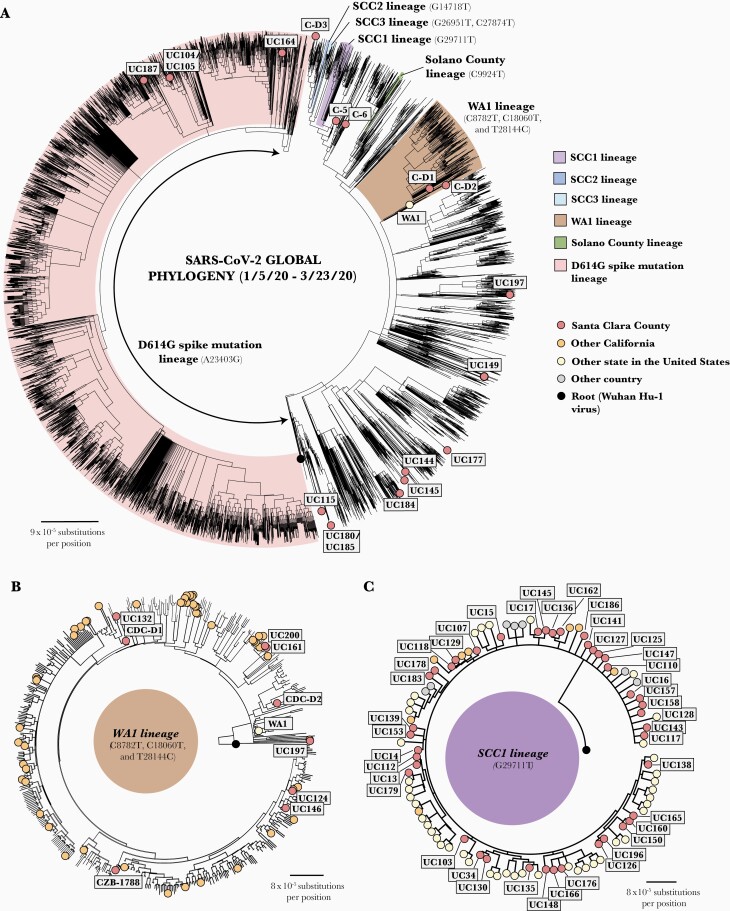
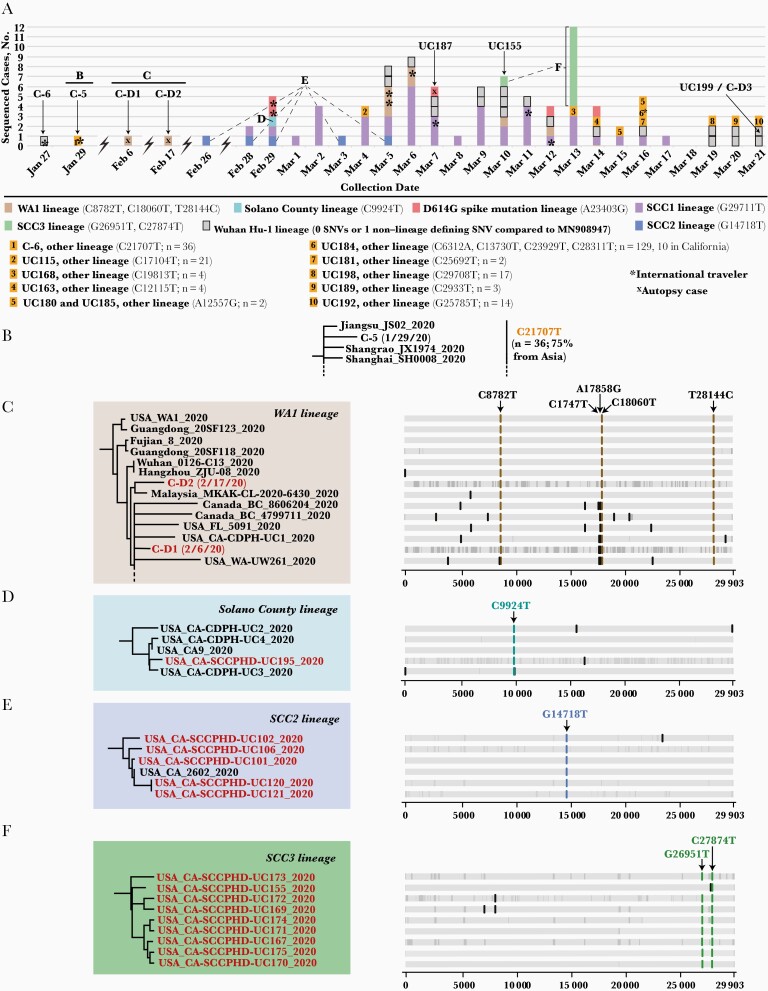
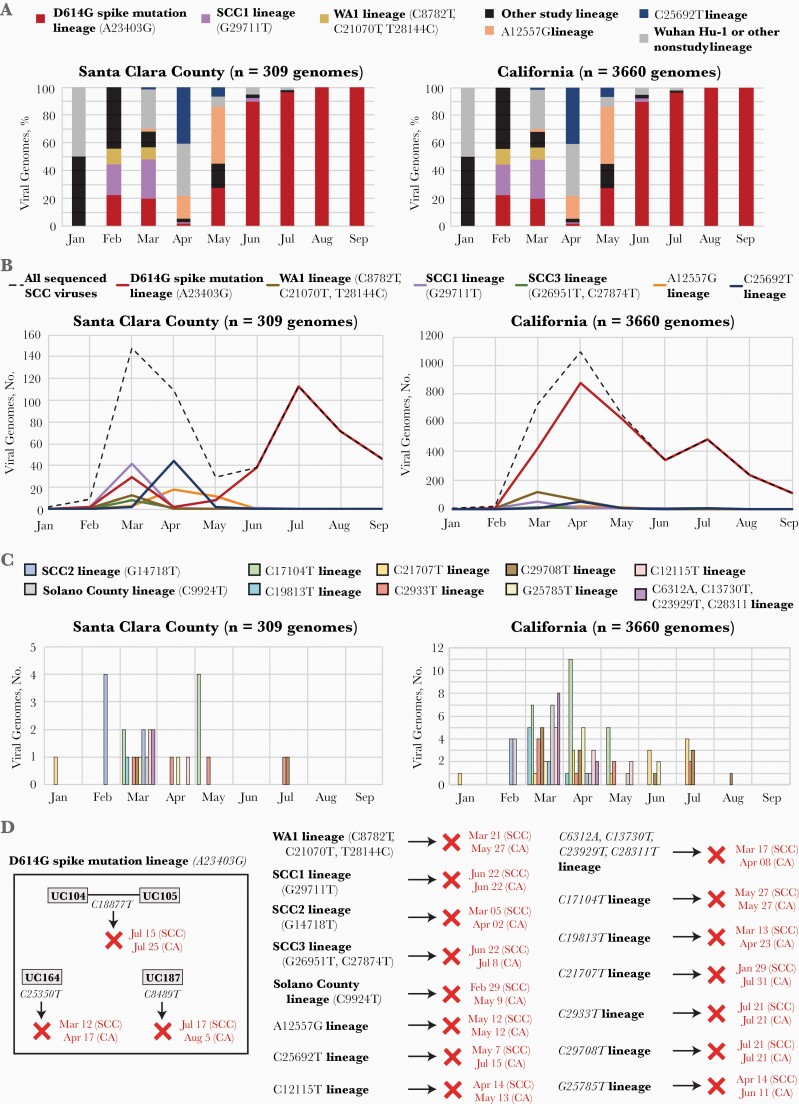
We combined viral genome sequencing with contact tracing to investigate introduction and evolution of severe acute respiratory syndrome coronavirus 2 lineages in Santa Clara County, California, from 27 January to 21 March 2020. From 558 persons with coronavirus disease 2019, 101 genomes from 143 available clinical samples comprised 17 lineages, including SCC1 (n = 41), WA1 (n = 9; including the first 2 reported deaths in the United States, with postmortem diagnosis), D614G (n = 4), ancestral Wuhan Hu-1 (n = 21), and 13 others (n = 26). Public health intervention may have curtailed the persistence of lineages that appeared transiently during February and March. By August, only D614G lineages introduced after 21 March were circulating in Santa Clara County.

Keywords: COVID-19; D614G lineage; SARS-CoV-2; epidemiology; public health surveillance; viral evolution; viral whole-genome sequencing.


Figures

Figure 1.
Figure 1.
Epidemic curve of the severe acute respiratory syndrome coronavirus 2 (SARS-CoV-2) outbreak in Santa Clara County, California, from 21 January to 21 March 2020. Laboratory-confirmed SARS-CoV-2 cases (n = 558) are shown by 2020 date. Asterisks denote collection dates for the 3 decedent medical examiner cases. Abbreviation: SCCPHL, Santa Clara County Public Health Laboratory.
Figure 2.
Figure 2.
Phylogenetic tree analysis of severe acute respiratory syndrome coronavirus (SARS-CoV-2) strains in Santa Clara county collected from 27 January to 21 March 2020. A, Radial view of Santa Clara SARS-CoV-2 viruses (n = 101) in the context of 19 922 global SARS-CoV-2 strains. Viral lineages are labeled on the tree and color coded. B, Radial view of WA1 lineage. The death case C-D2 (possessing 3 single-nucleotide variants [SNVs]) is situated on a side branch of the WA1 subtree, while the earlier death case C-D1 is positioned within the main WA1 cluster (with 5 common SNVs). Note that all genomes in the WA1 lineage are closely related to each other, and alignments can be artifactually driven by gaps (stretches of N’s) in the assembled genome. Thus, CZB-1788 is positioned away from C124 and UC146 despite all 3 individuals being passengers on the same cruise and having identical genomes. C, Overall view of SCC1 lineage sharing G29711T.
Figure 3.
Figure 3.
Single-nucleotide variant (SNV) analysis of Santa Clara severe acute respiratory syndrome coronavirus 2 strains collected between 27 January and 21 March 2020. A, Daily composition of viral lineages in Santa Clara County. The 7 main lineages are represented in different colors, while the remaining 10 lineages are given numerical designations. B, C-5 and related strains from China. C, Phylogenetic tree of WA1 strains, including 2 early death cases and their defining SNVs. Note that given the size of the WA1 subtree, not all of the 9 WA1 genomes recovered in this study are shown (dashed line). D, Solano County lineage and defining SNV. E, SCC2 lineage and the defining G14718T. F, SCC3 lineage and defining G26951T and C27874 SNVs. In B–F, highlighted red font denotes the genome as belonging to the 101 cases in the study. In C–F, the vertical gray lines represent regions of the genome with missing coverage, represented as nucleotide stretches of N’s in the assembled sequence.
Figure 4.
Figure 4.
Dynamic change of severe acute respiratory syndrome coronavirus 2 (SARS-CoV-2) genotypes in Santa Clara County (SCC) over time. A, Proportion of main viral lineages every month between January and September. B, Dynamic change curve of major viral lineages over time in the SCC community from January to September. The y-axis represents the number of SARS-CoV-2 cases. C, Bar graph of other viral lineages between January and September. D, Fate of the SARS-CoV-2 lineages identified in this study. The dates that the lineage was last identified in SCC and in California by genomic sequencing are provided in red text, with red X’s denoting disappearance of the lineage from the county by that date.

References

    1. Dong E, Du H, Gardner L. An interactive Web-based dashboard to track COVID-19 in real time. Lancet Infect Dis 2020; 20:533–4. - PMC - PubMed
    1. Holshue ML, DeBolt C, Lindquist S, et al. . First case of 2019 novel coronavirus in the United States. N Engl J Med 2020; 382:929–36. - PMC - PubMed
    1. Bedford T, Greninger AL, Roychoudhury P, et al. ; Seattle Flu Study Investigators . Cryptic transmission of SARS-CoV-2 in Washington State. Science 2020; 370:571–5. - PMC - PubMed
    1. Deng X, Gu W, Federman S, et al. . Genomic surveillance reveals multiple introductions of SARS-CoV-2 into Northern California. Science 2020; 369:582–7. - PMC - PubMed
    1. Fauver JR, Petrone ME, Hodcroft EB, et al. . Coast-to-coast spread of SARS-CoV-2 during the early epidemic in the United States. Cell 2020; 181:990–6 e5. - PMC - PubMed

Publication types