. 2021 Jun 9;29(6):959-974.e7.
doi: 10.1016/j.chom.2021.03.016. Epub 2021 Apr 23.

Microbiota regulate innate immune signaling and protective immunity against cancer

Affiliations

Microbiota regulate innate immune signaling and protective immunity against cancer

Changsheng Xing et al. Cell Host Microbe. .

Abstract

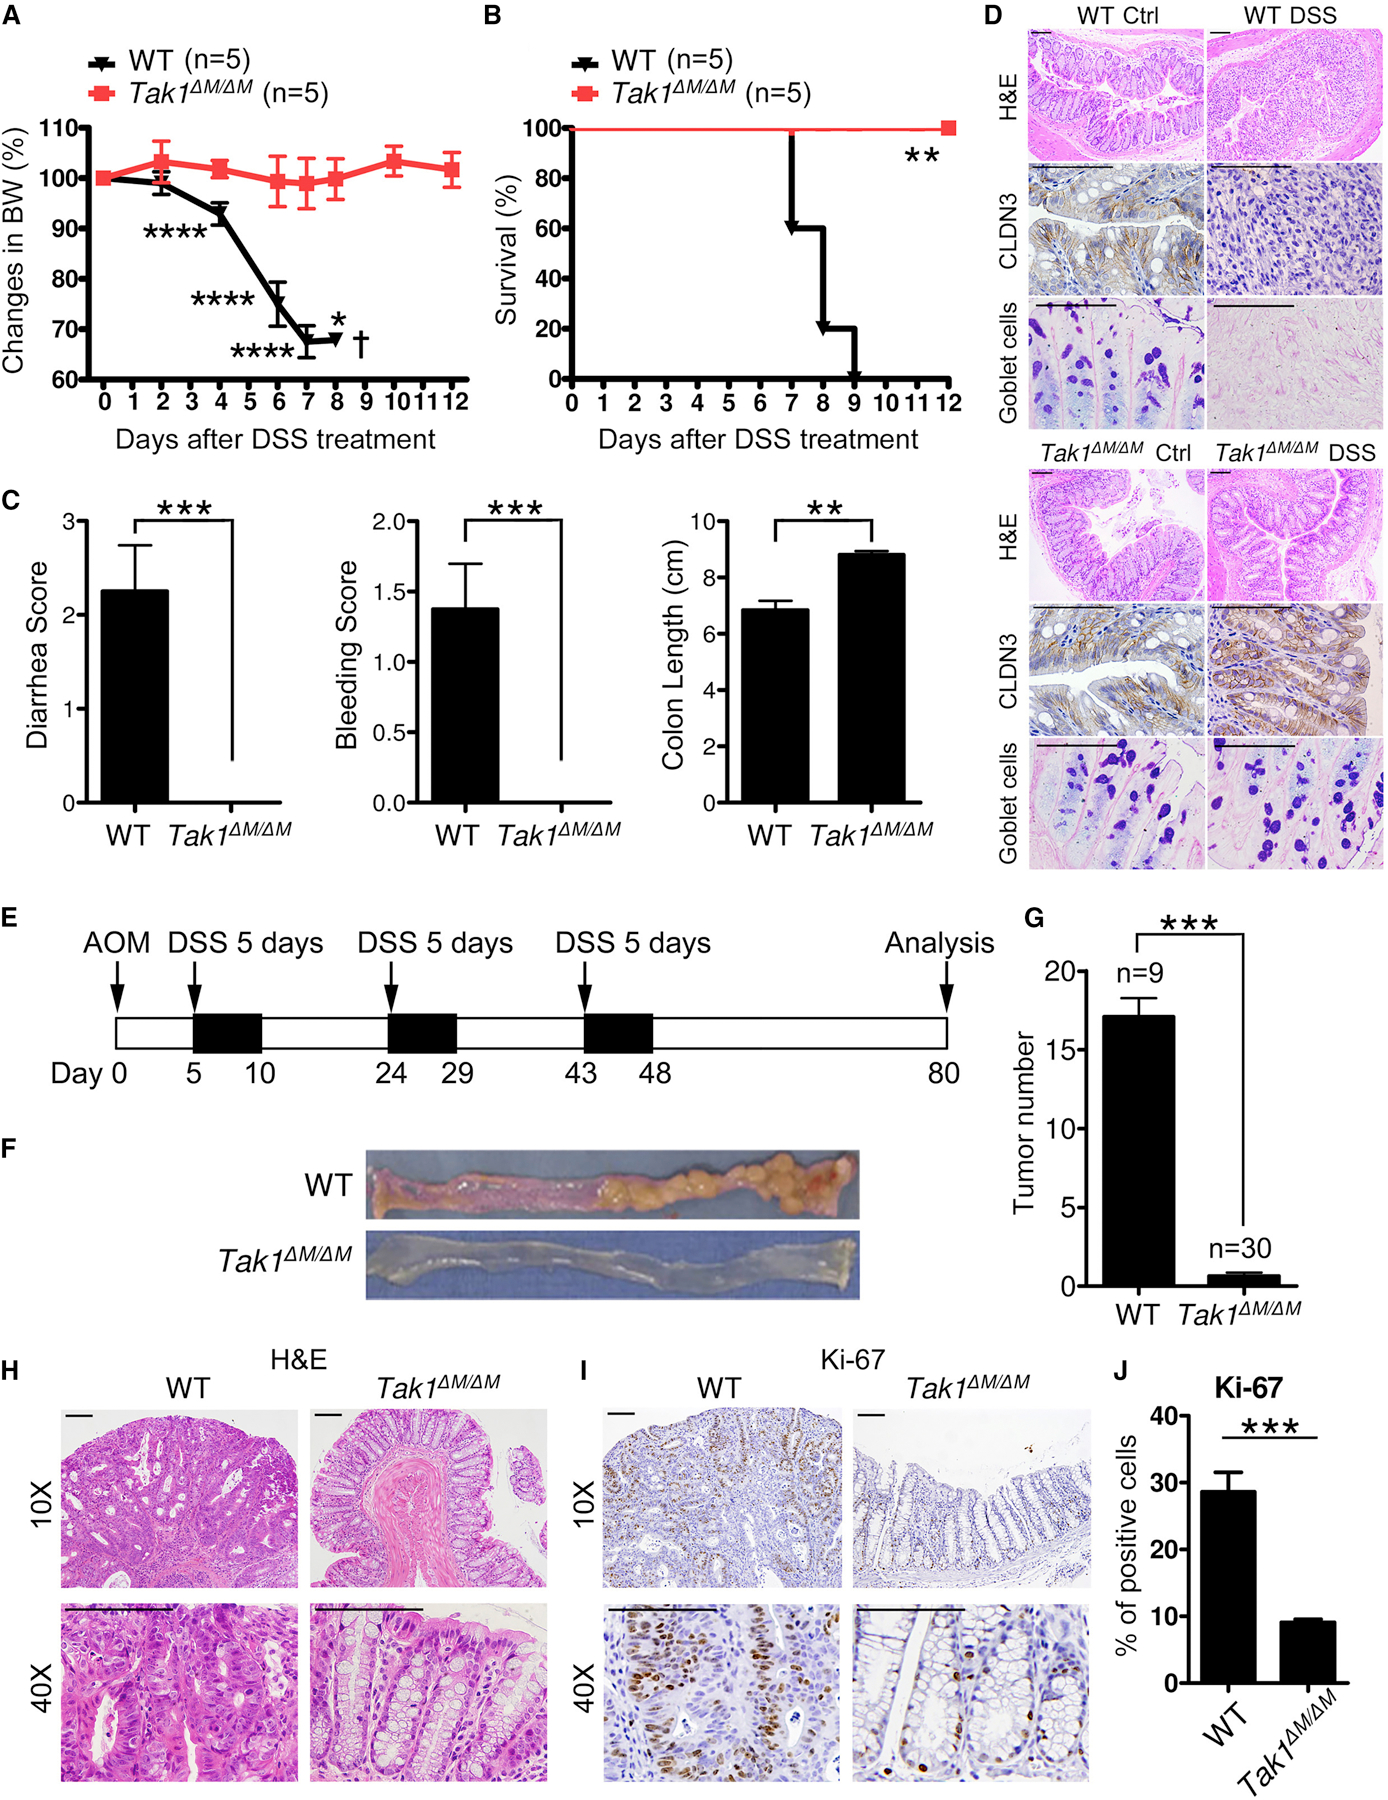
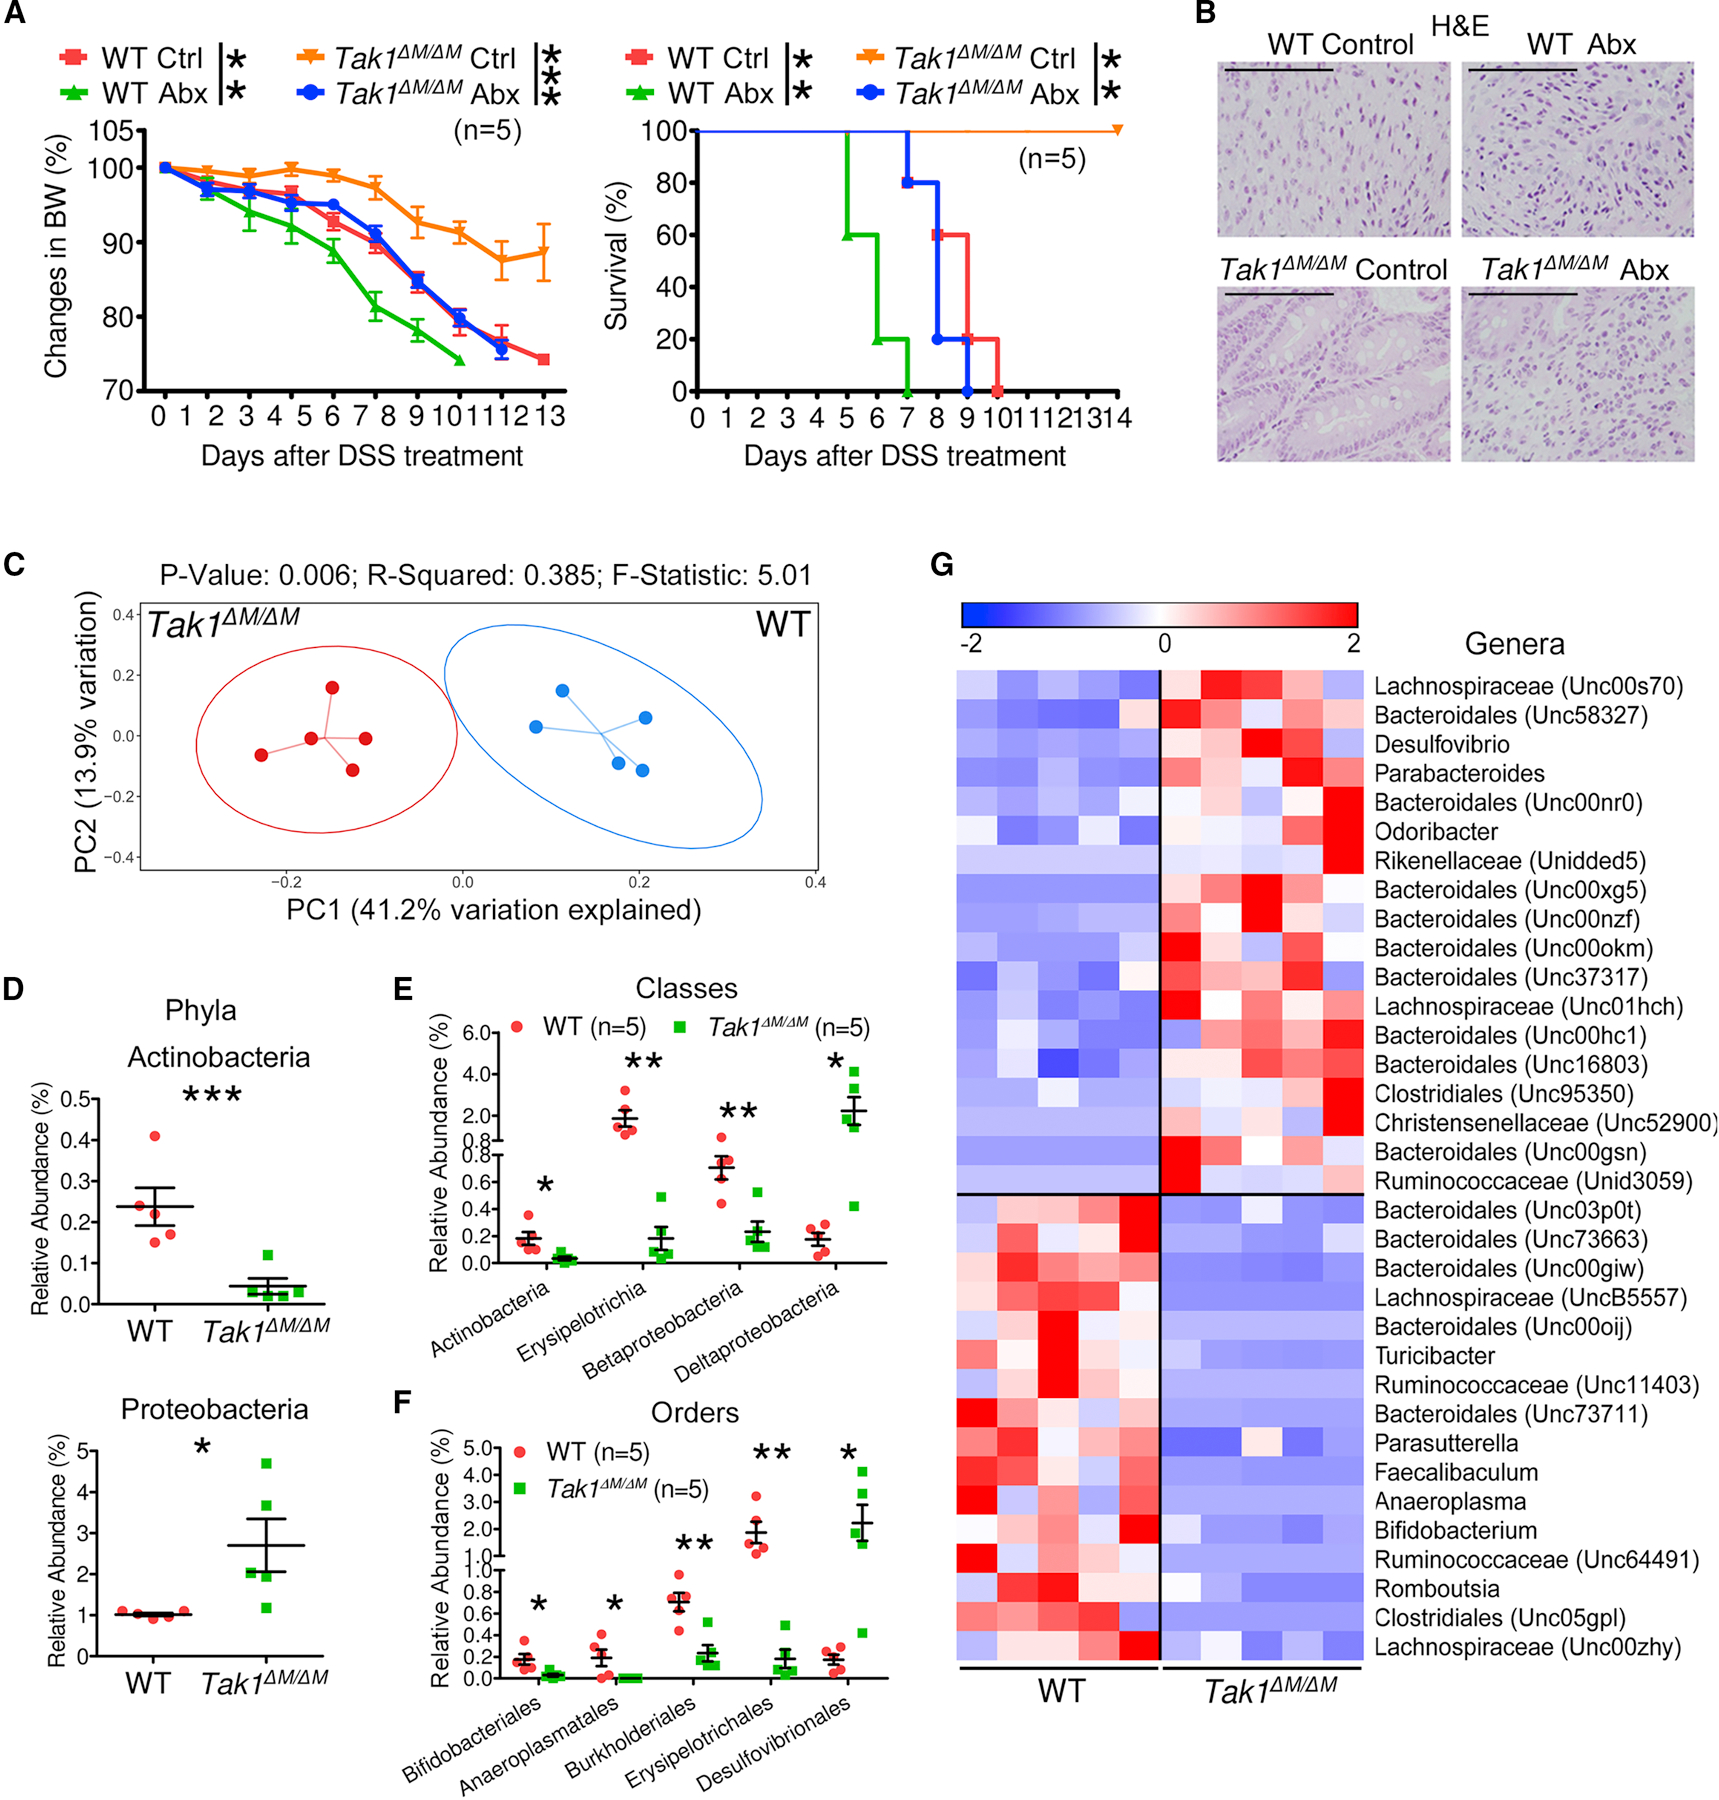
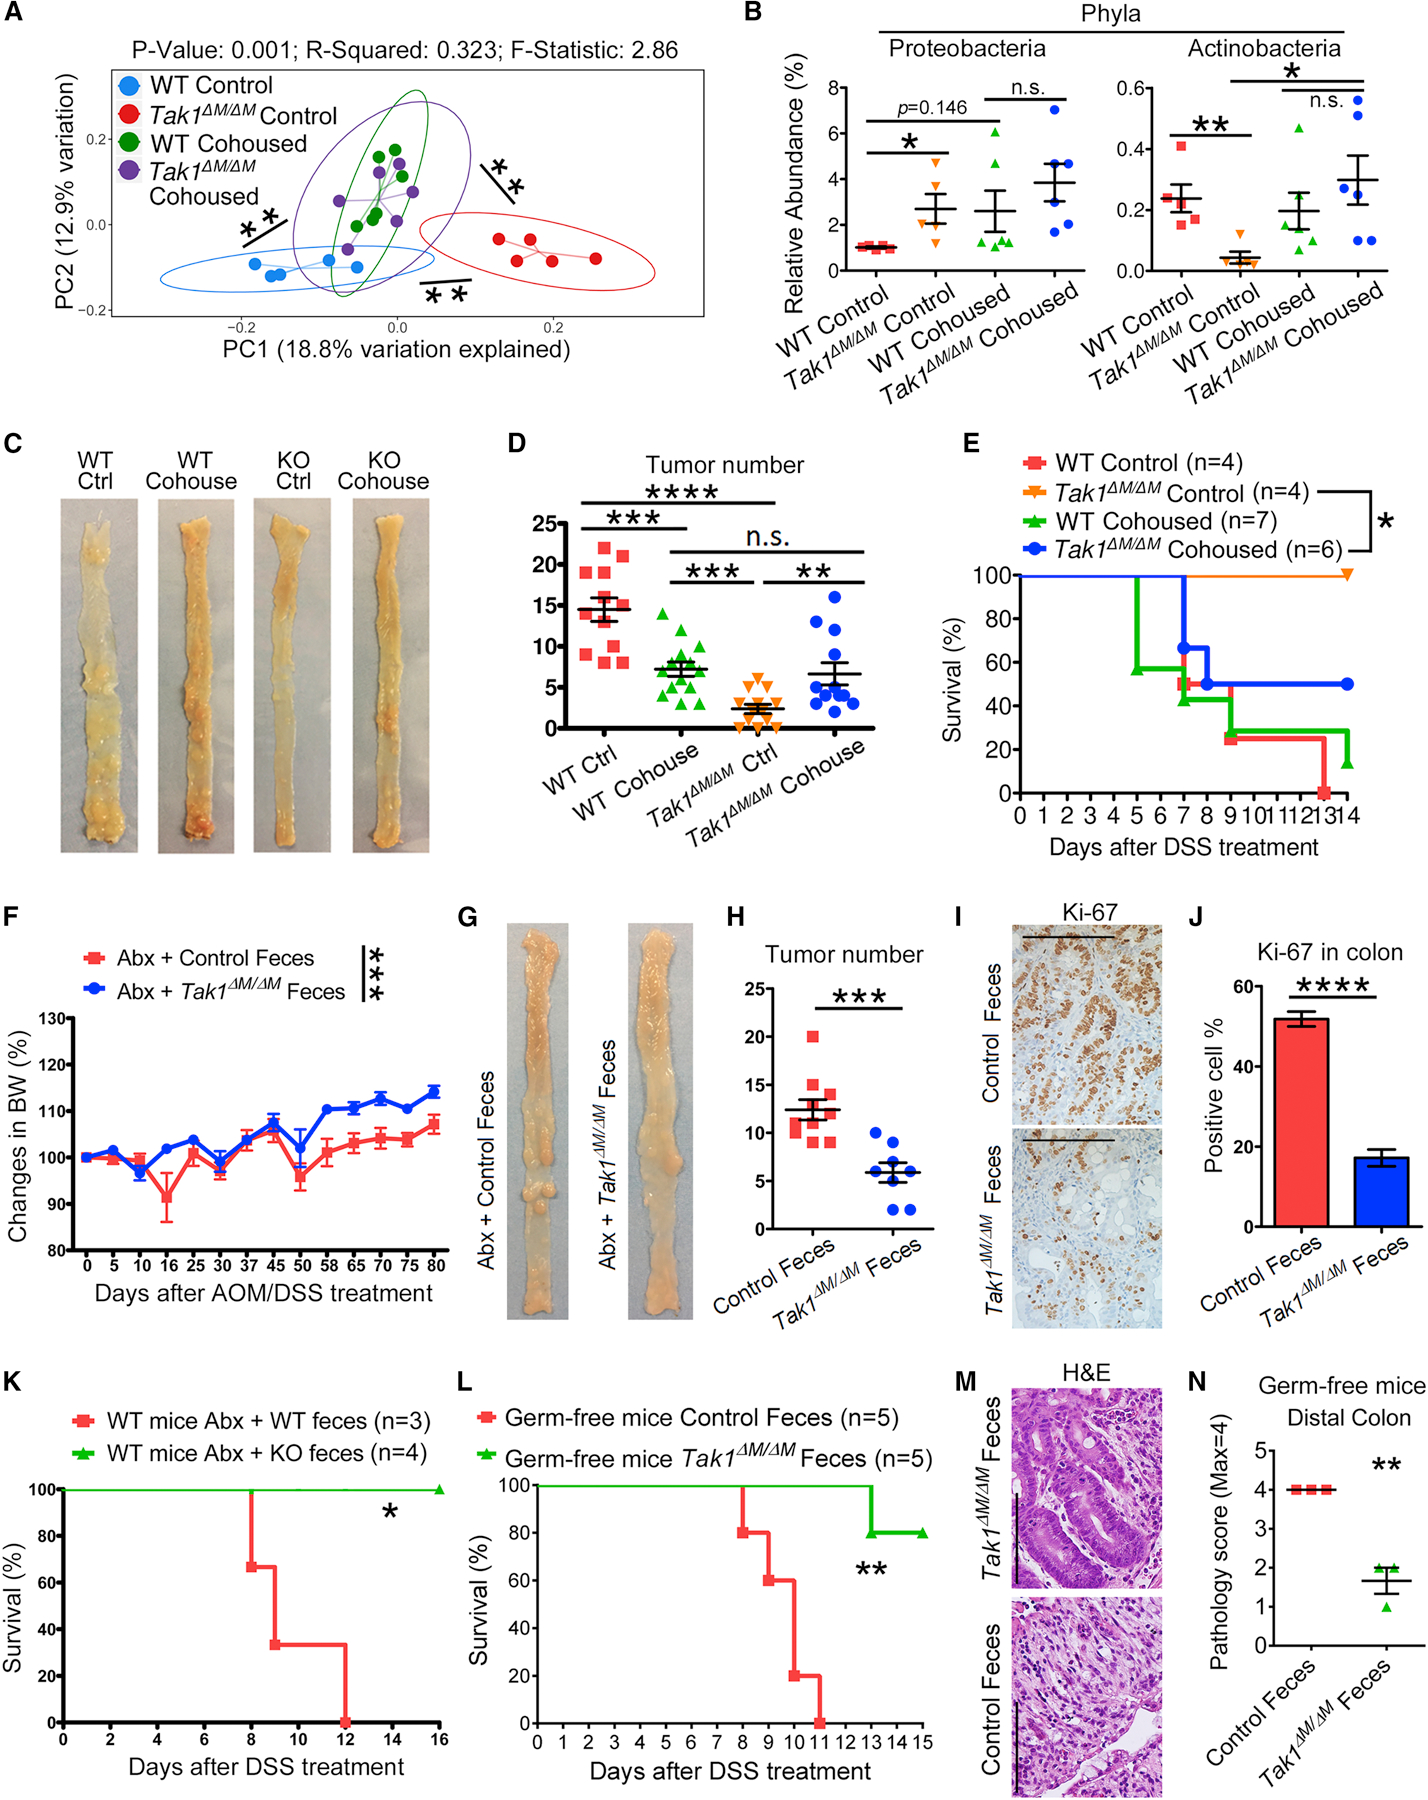
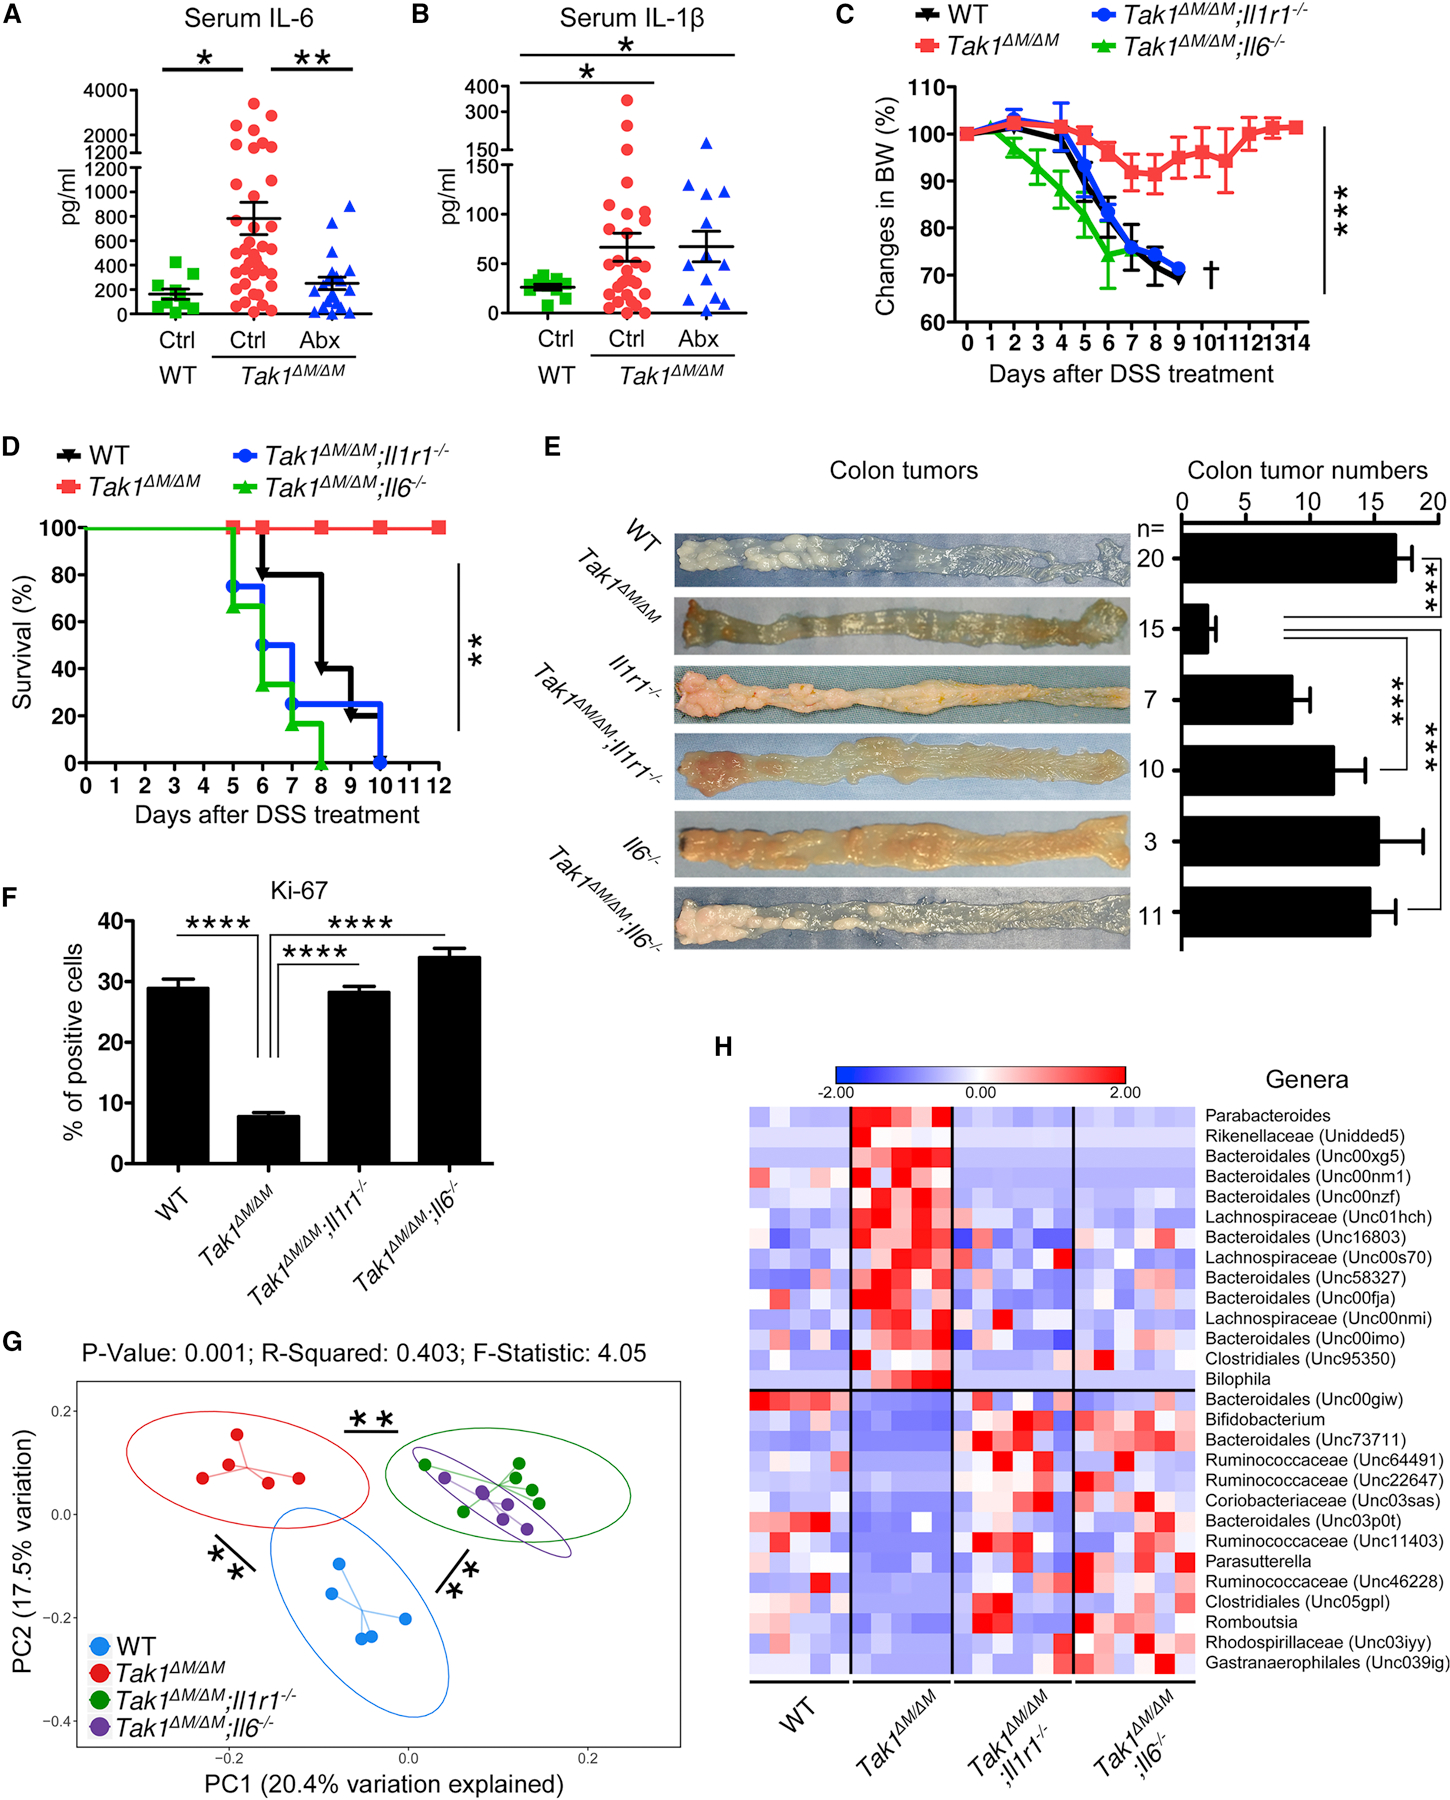
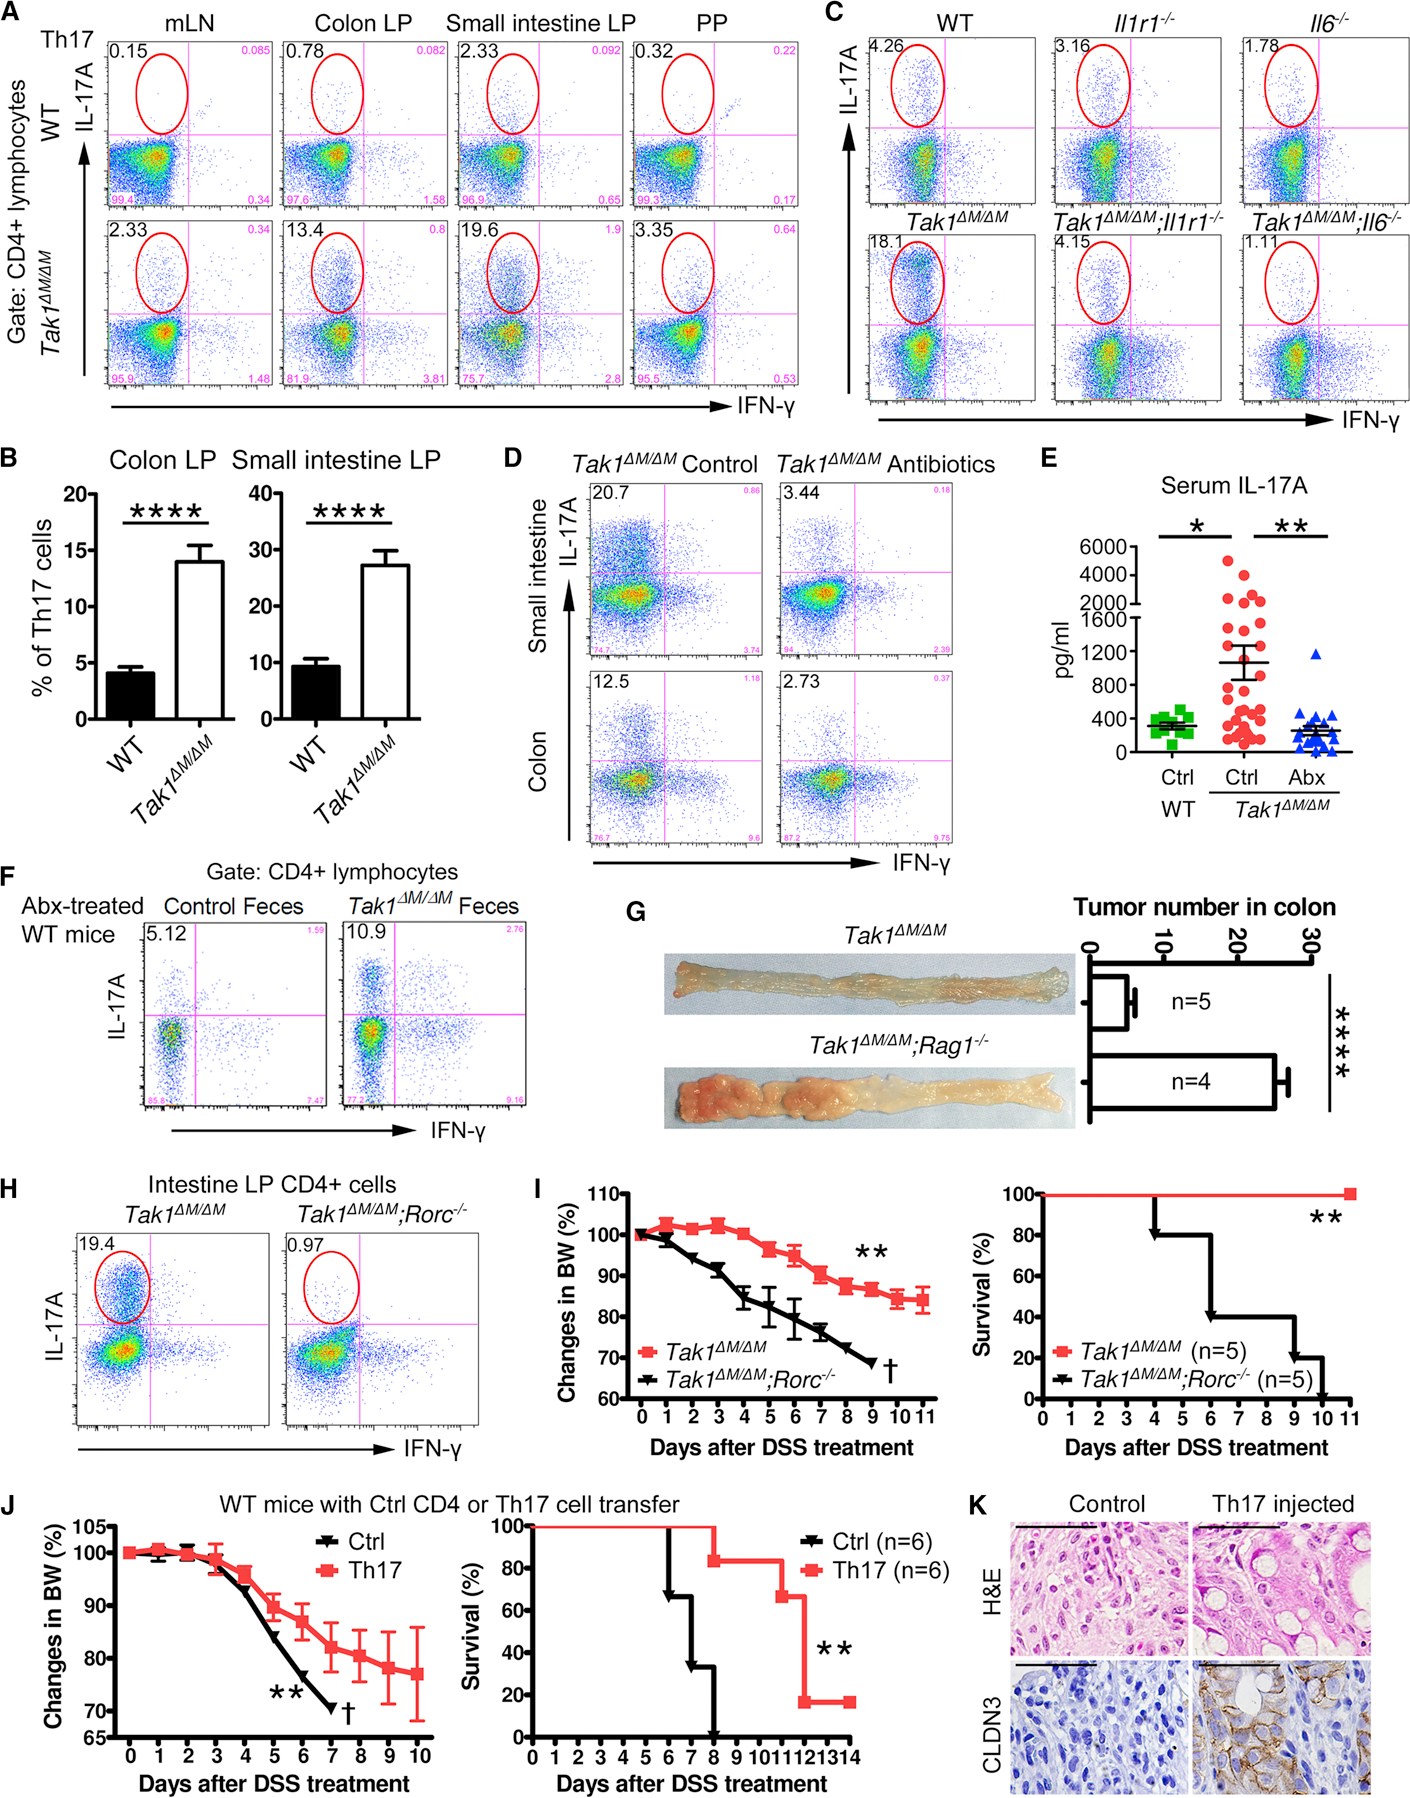
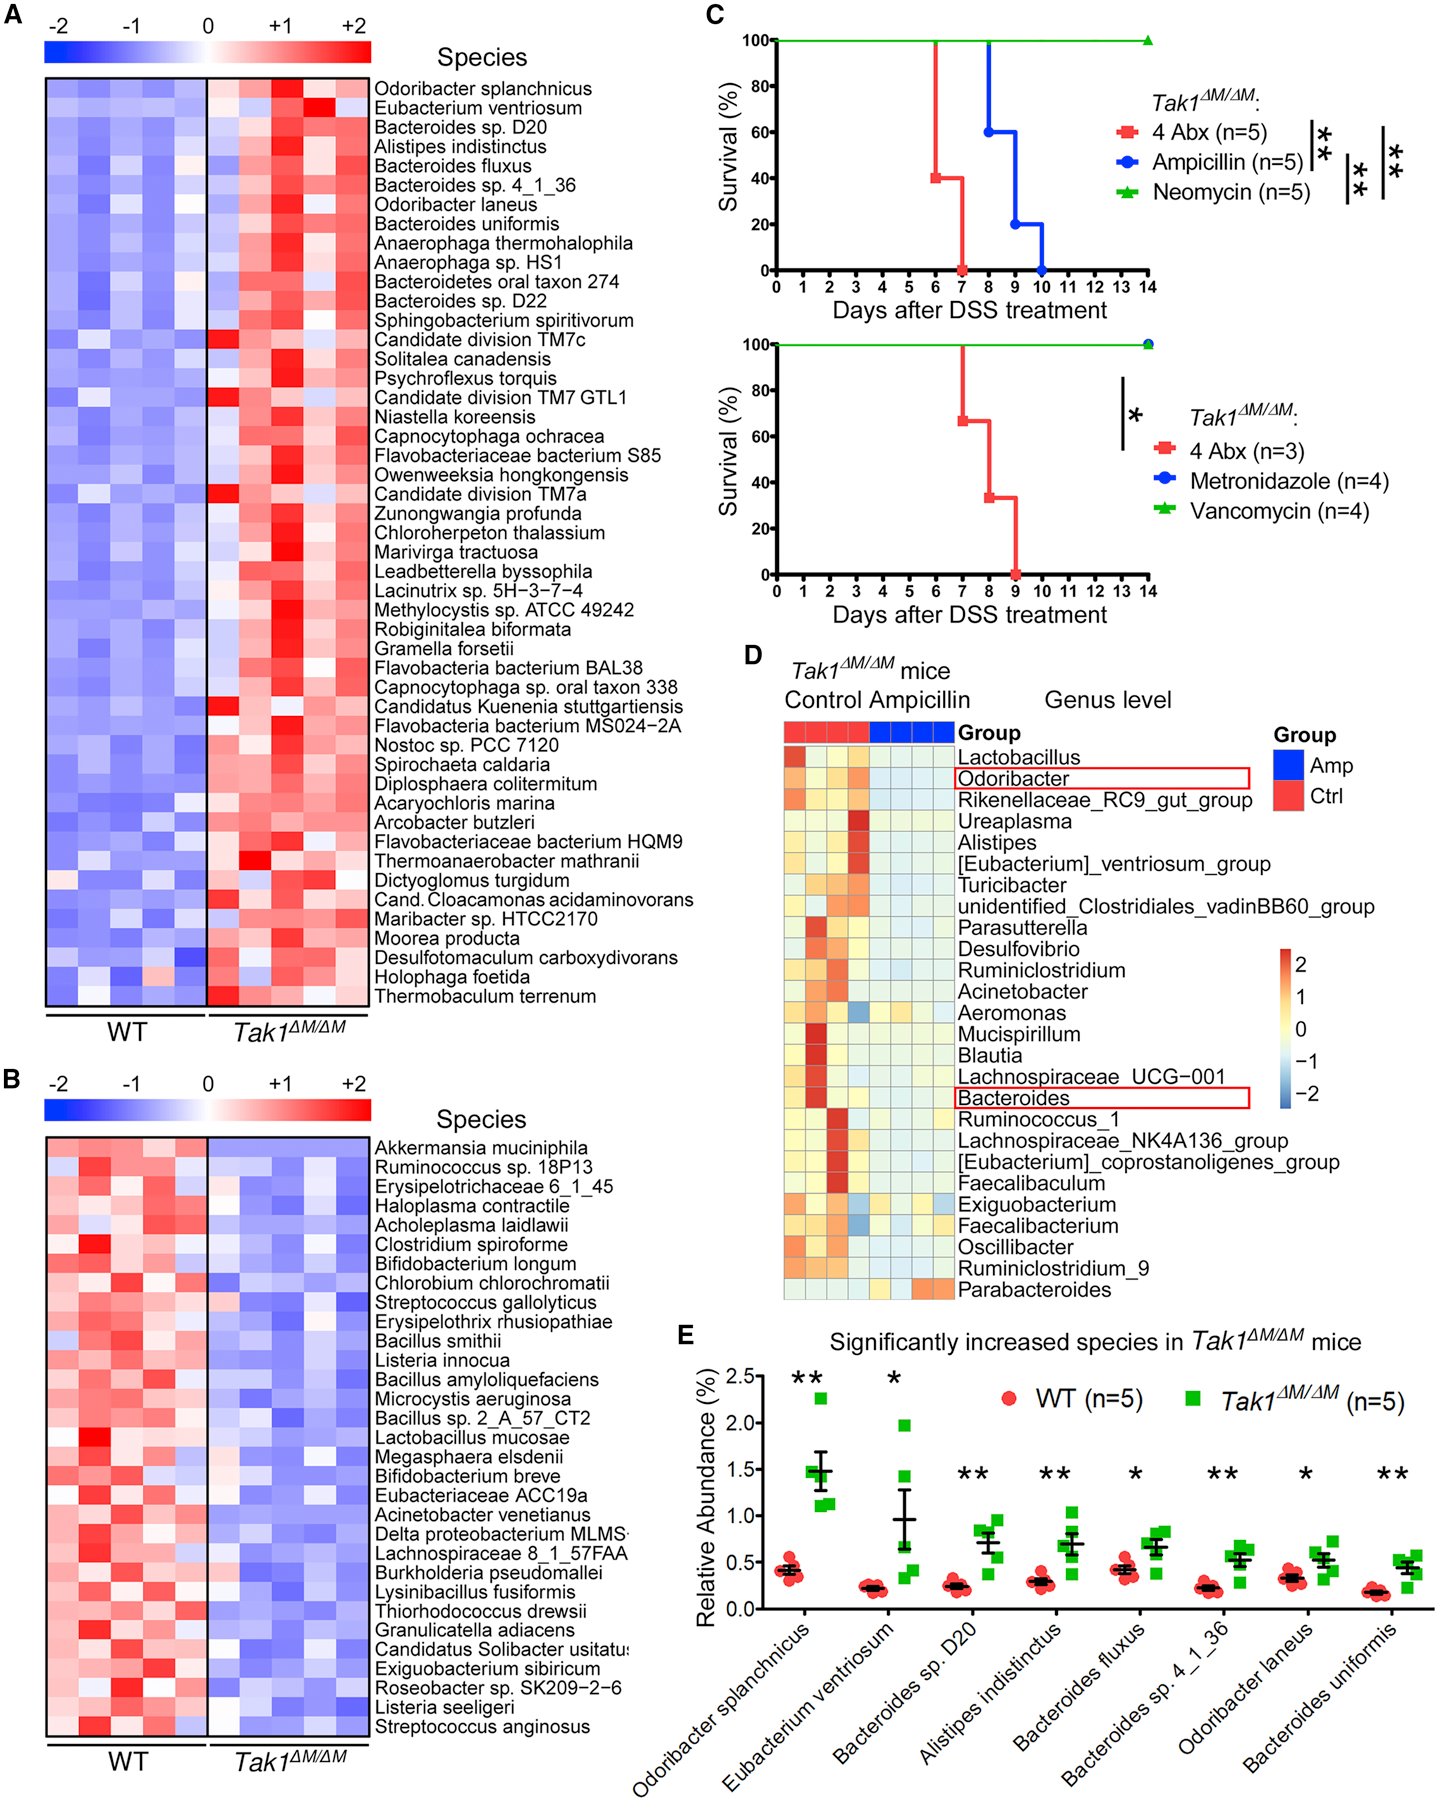
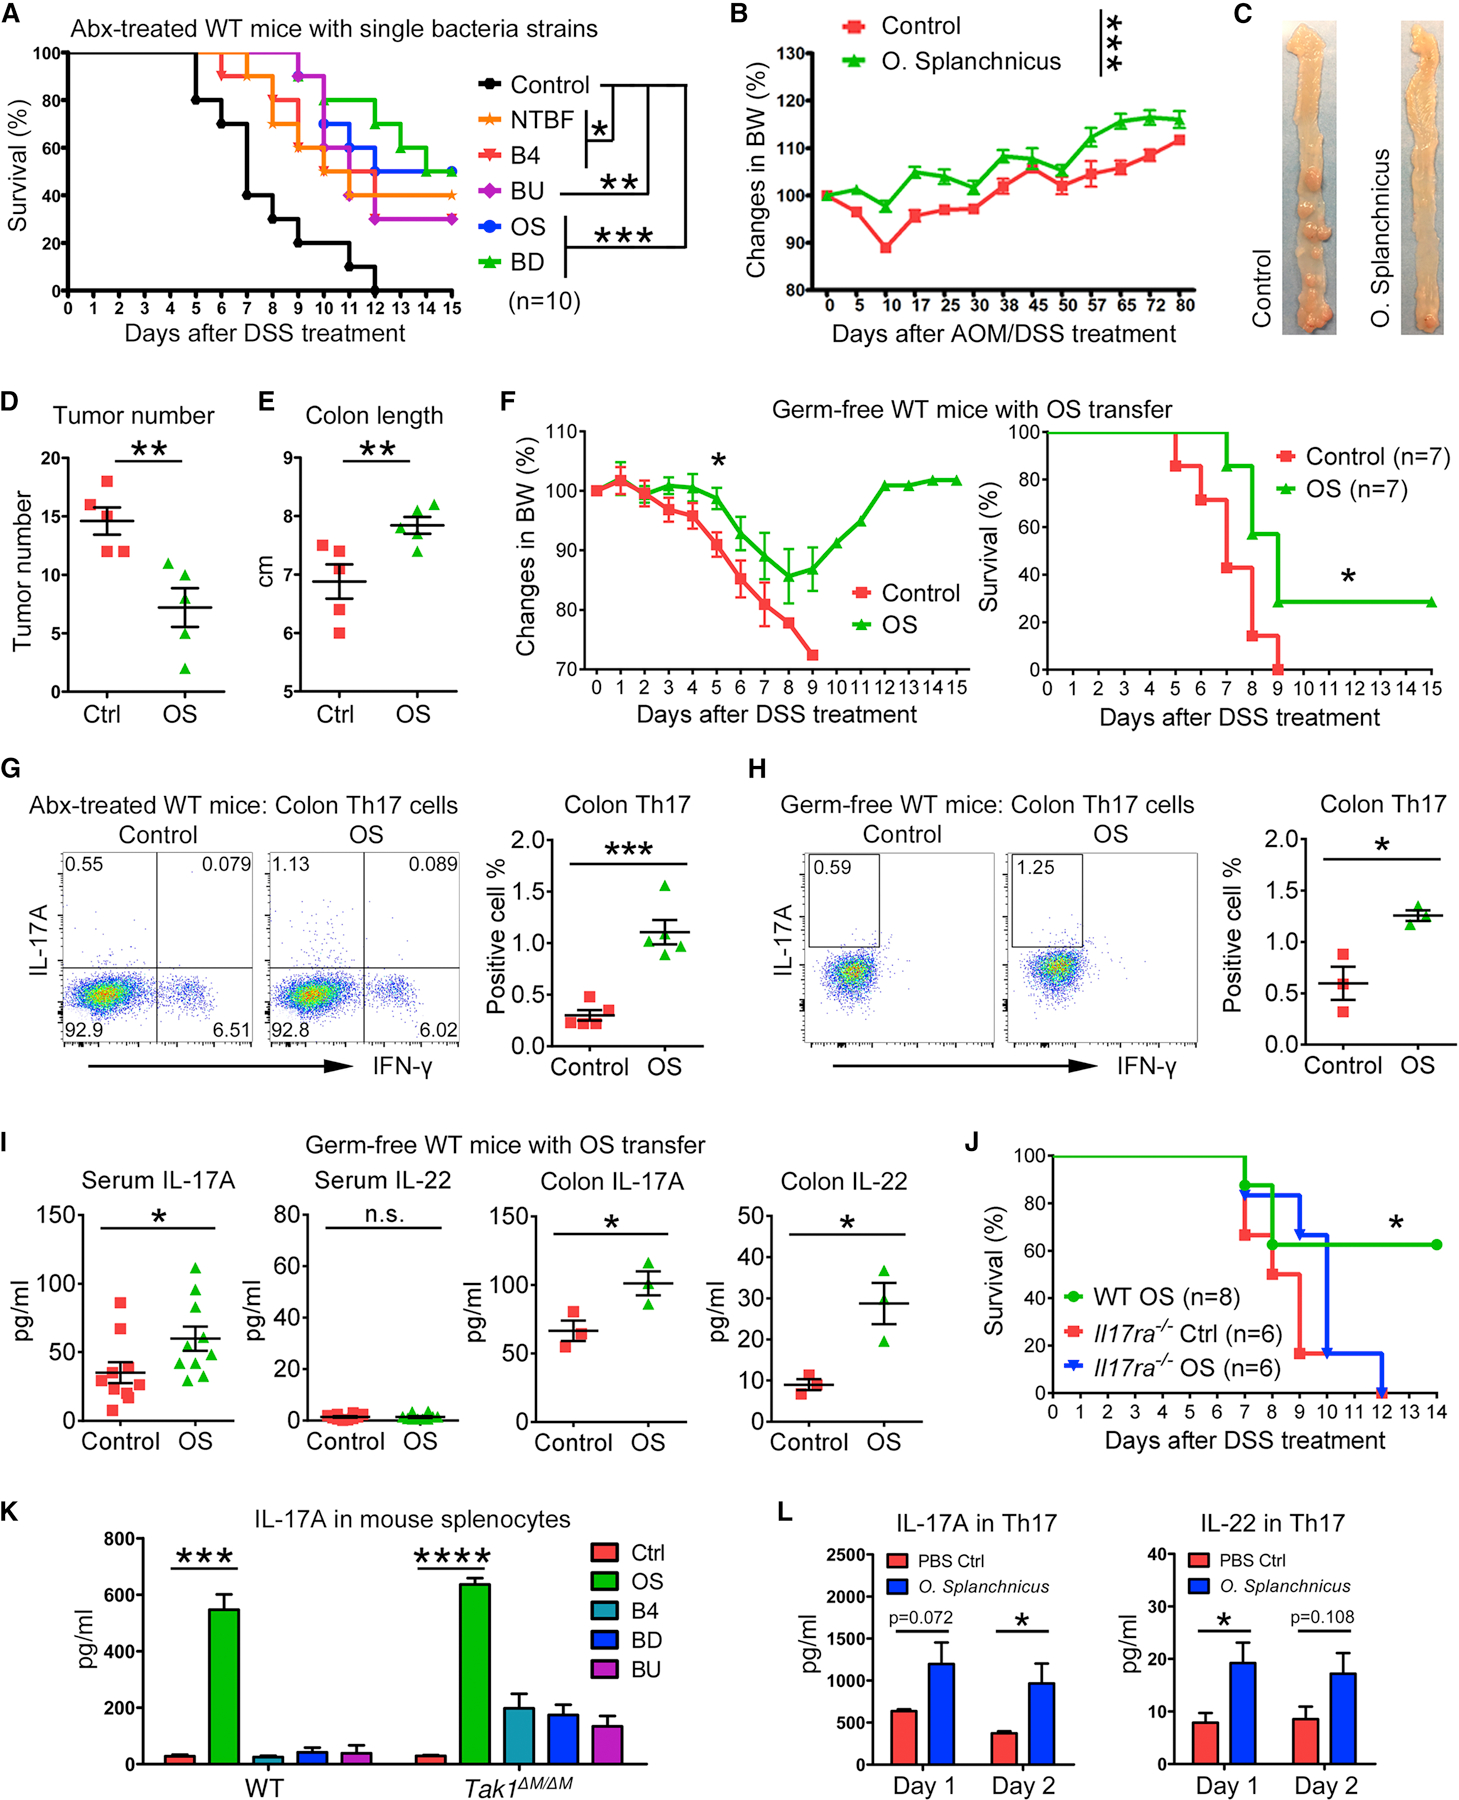
Microbiota play critical roles in regulating colitis and colorectal cancer (CRC). However, it is unclear how the microbiota generate protective immunity against these disease states. Here, we find that loss of the innate and adaptive immune signaling molecule, TAK1, in myeloid cells (Tak1ΔM/ΔM) yields complete resistance to chemical-induced colitis and CRC through microbiome alterations that drive protective immunity. Tak1ΔM/ΔM mice exhibit altered microbiota that are critical for resistance, with antibiotic-mediated disruption ablating protection and Tak1ΔM/ΔM microbiota transfer conferring protection against colitis or CRC. The altered microbiota of Tak1ΔM/ΔM mice promote IL-1β and IL-6 signaling pathways, which are required for induction of protective intestinal Th17 cells and resistance. Specifically, Odoribacter splanchnicus is abundant in Tak1ΔM/ΔM mice and sufficient to induce intestinal Th17 cell development and confer resistance against colitis and CRC in wild-type mice. These findings identify specific microbiota strains and immune mechanisms that protect against colitis and CRC.

Keywords: Bacteroides sp. D20; Odoribacter splanchnicus; TAK1 signaling; Th17 cells; acute colitis; colon cancer; innate immunity; microbiota.


Conflict of interest statement

Declaration of interests The authors declare no competing interests.

Figures

Figure 1.
Figure 1.. Tak1 Deficiency in Myeloid Lineage Renders Mice Resistance to DSS-induced Colitis and Colon Cancer
(A-C) Body weight changes, survival, and clinical scores (diarrhea, bleeding, colon length) in WT and Tak1∆M/∆M mice after 5% DSS treatment. (D) H&E staining (10X), IHC staining of CLDN3 (40X), and AB/PAS staining (40X) on colon sections (day 5 after DSS treatment, scale bar: 100 µm). (E) Strategy for AOM/DSS-induced colon cancer model. (F-G) Colon tumors and tumor number analysis in WT and Tak1∆M/∆M mice on day 80 after AOM/DSS treatment. (H-J) H&E and IHC staining of Ki-67 on colon sections (day 80 after AOM/DSS treatment, scale bar: 100 µm), and the analysis of Ki-67 positive cells. Statistical analyses: Student’s unpaired t test (A, C, G, and J) and Mantel-Cox log-rank test (B). *p<0.05; **p<0.01; ***p<0.001; ****p<0.0001. See also Figure S1.
Figure 2.
Figure 2.. Microbiota in Tak1∆M/∆M Mice Are Altered and Critically Required for Resistance to Colonic Inflammation
(A-B) Body weight changes, survival, and tissue damage in WT and Tak1∆M/∆M mice with combined Abx pretreatment for 4 weeks and 5% DSS for 5 days. (C-G) The 16S rRNA gene profiling data for fecal microbiome from 8 weeks old WT and Tak1∆M/∆M mice. (C) PCoA plot of bacterial beta-diversity. (D-G) Relative abundance of significantly altered taxa at the rank of phylum, class, order, and genus (including unspecified taxa). Statistical analyses: Student’s unpaired t test (A-left, D-F), Monte Carlo permutation test (C), and Mantel-Cox log-rank test (A-right). *p<0.05; **p<0.01; ***p<0.001. See also Figure S2 and Table S1.
Figure 3.
Figure 3.. Specific Gut Microbiota in Tak1∆M/∆M Mice Can Generate Protective Immunity in WT Mice against Colitis and Colon Cancer
(A-B) The 16S rRNA gene profiling data for fecal microbiome from control and cohoused WT and Tak1∆M/∆M mice. (A) PCoA plot of bacterial beta-diversity. (B) Relative abundance of significantly altered taxa at phylum level. (C-D) Colon tumors and tumor number analysis in control and cohoused WT and Tak1∆M/∆M mice on day 80 after AOM/DSS treatment. (E) Survival of control and cohoused WT and Tak1∆M/∆M mice after 5% DSS treatment. (F-J) Recipient WT mice with Abx-pretreatment and fecal material transfer were treated with AOM/DSS. (F-H) Body weight changes, colon tumors on day 80, and tumor number analysis. (I-J) IHC staining of Ki-67 on colon sections (scale bar: 100 µm) and analysis of positive cells. (K) Survival of Abx-treated WT mice with fecal material transfer and 5% DSS treatment. (L) Survival of germ-free WT mice with fecal material transfer and 4% DSS treatment. (M-N) H&E staining (40X, scale bar: 100 µm) and histopathology scores on colon sections from fecal microbiota transferred germ-free WT mice after DSS treatment. Statistical analyses: Student’s unpaired t test (B, D, F, H, J, and N), Monte Carlo permutation test (A), and Mantel-Cox log-rank test (E, K, and L). *p<0.05; **p<0.01; ***p<0.001; ****p<0.0001. See also Figure S3 and Table S1.
Figure 4.
Figure 4.. Innate Immune Signaling Pathways Are Required for Resistance against Colitis and Colon Cancer in Tak1∆M/∆M Mice
(A-B) Serum IL-6 and IL-1β in WT, Tak1∆M/∆M, and Abx-treated Tak1∆M/∆M mice (for 4 weeks). (C-D) Body weight changes and survival of different strains after 5% DSS treatment. (E-F) Colon tumors in different strains on day 80 after AOM/DSS treatment, tumor number analysis, and Ki-67 positive cells on colon sections. (G-H) The 16S rRNA gene profiling data for fecal microbiome from WT, Tak1∆M/∆M, and double knockout mice. (G) PCoA plot of bacterial beta-diversity. (H) Relative abundance of significantly altered taxa at genus level, including unspecified taxa. Statistical analyses: Student’s unpaired t test (A-C, E, and F), Monte Carlo permutation test (G), and Mantel-Cox log-rank test (D). *p<0.05; **p<0.01; ***p<0.001; ****p<0.0001. See also Figure S4 and Table S2.
Figure 5.
Figure 5.. Th17 Cells in Tak1∆M/∆M Mice Are Controlled by Innate Immune Signaling Pathways and Microbiota and Are Required for Resistance to Colitis and CRC
(A) Flow cytometry of Th17 cells (IL-17A+/IFN-γ) in gated CD4+ lymphocytes from mLN, colon and small intestine LP, and PP. (B) Th17 cell percentage in colon and small intestine from WT and Tak1∆M/∆M mice. (C) Flow cytometry of colon LP Th17 cells (IL-17A+/IFN-γ) in gated CD4+ lymphocytes from different mouse strains. (D) Flow cytometry of intestinal LP Th17 cells (IL-17A+/IFN-γ) in gated CD4+ lymphocytes from control and Abx-treated Tak1∆M/∆M mice (for 4 weeks). (E) Serum IL-17A in WT, Tak1∆M/∆M, and Abx-treated Tak1∆M/∆M mice (for 4 weeks). (F) Flow cytometry of intestinal LP Th17 cells (IL-17A+/IFN-γ) in gated CD4+ lymphocytes from WT mice with Abx-pretreatment, fecal material transfer, and AOM/DSS treatment (on day 80). (G) Colon tumors and tumor number analysis in Tak1∆M/∆M and Tak1∆M/∆M;Rag1−/− mice with AOM/DSS treatment (day 80). (H-I) Intestinal Th17 cells (IL-17A+/IFN-γ) in Tak1∆M/∆M and Tak1∆M/∆M;Rorc−/− mice, and their body weight changes and survival after 5% DSS treatment. (J-K) Intestinal LP lymphocytes were purified from Tak1∆M/∆M;Il17-GFP+ mice. Control CD4+ (CD4+/GFP) and Th17 cells (CD4+/GFP+) were sorted and injected intraperitoneally (i.p.) to WT recipients. (J) Body weights and survival after 5% DSS treatment. (K) H&E and IHC staining of CLDN3 on colon sections. Statistical analyses: Student’s unpaired t test (B, E, G, I-left, and J-left) and Mantel-Cox log-rank test (I-right and J-right). *p<0.05; **p<0.01; ****p<0.0001. See also Figures S5 and S6.
Figure 6.
Figure 6.. Identification of the Dominant Microbiota Species/Strains in Tak1∆M/∆M Mice
(A-B) Whole shotgun metagenomic sequencing for fecal microbiome from WT and Tak1∆M/∆M mice. Heatmap for relative abundance of significantly increased (A) and decreased (B) species. (C) Survival of Tak1∆M/∆M mice with combined or single Abx pretreatment and 5% DSS. (D) The 16S rRNA profiling for fecal microbiome in control and ampicillin-treated Tak1∆M/∆M mice (for 4 weeks). Relative abundance of taxa at genus level with most dramatic decrease. (E) Significantly increased species in Tak1∆M/∆M mice with the highest abundance from metagenomic sequencing. Statistical analyses: Student’s unpaired t test (E) and Mantel-Cox log-rank test (C). *p<0.05; **p<0.01. See also Figure S6 and Table S3.
Figure 7.
Figure 7.. Identification of Protective Microbiota Strains for Colitis and Colon Cancer
(A) Survival of Abx-treated WT mice with single bacteria strain transfer and 5% DSS treatment. (B-E) Body weight changes, colon tumors (on day 80), tumor number analysis, and colon length in Abx-treated WT mice with O. splanchnicus (OS) transfer and AOM/DSS treatment. (F) Body weight changes and survival of germ-free WT mice with OS transfer and 3% DSS treatment. (G-H) Flow cytometry of colon LP Th17 cells (IL-17A+/IFN-γ) in gated CD4+ lymphocytes from Abx-treated and germ-free WT mice with OS transfer. (I) Cytokines in serum and colon tissues from control and OS-transferred germ-free WT mice. (J) Survival of Abx-treated WT and Il17ra−/− mice with OS transfer and 5% DSS treatment. (K) IL-17A production in splenocytes from WT and Tak1∆M/∆M mice, after 1 day treatment of PBS control or autoclaved single bacteria strains. (L) Intestinal LP Th17 cells were sorted from Tak1∆M/∆M;Il17-GFP+ mice for cytokine productions after autoclaved OS treatment. Statistical analyses: Student’s unpaired t test (B, D-E, F-left, G-I, K-L) and Mantel-Cox log-rank test (A, F-right, and J). *p<0.05; **p<0.01; ***p<0.001; ****p<0.0001. See also Figures S6 and S7.

Comment in

  • TAKing on cancer.
    Foegeding NJ, Byndloss MX. Foegeding NJ, et al. Cell Host Microbe. 2021 Jun 9;29(6):851-853. doi: 10.1016/j.chom.2021.05.005. Cell Host Microbe. 2021. PMID: 34111391

References

    1. Ajibade AA, Wang HY, and Wang RF (2013). Cell type-specific function of TAK1 in innate immune signaling. Trends in immunology 34, 307–316. - PubMed
    1. Ajibade AA, Wang Q, Cui J, Zou J, Xia X, Wang M, Tong Y, Hui W, Liu D, Su B, et al. (2012). TAK1 negatively regulates NF-kappaB and p38 MAP kinase activation in Gr-1+CD11b+ neutrophils. Immunity 36, 43–54. - PMC - PubMed
    1. Alexander KL, Targan SR, and Elson CO 3rd (2014). Microbiota activation and regulation of innate and adaptive immunity. Immunol Rev 260, 206–220. - PMC - PubMed
    1. Artis D, and Spits H (2015). The biology of innate lymphoid cells. Nature 517, 293–301. - PubMed
    1. Atarashi K, Tanoue T, Ando M, Kamada N, Nagano Y, Narushima S, Suda W, Imaoka A, Setoyama H, Nagamori T, et al. (2015). Th17 Cell Induction by Adhesion of Microbes to Intestinal Epithelial Cells. Cell 163, 367–380. - PMC - PubMed

Publication types

MeSH terms

Supplementary concepts