Clinical Trial
. 2021 Jun;147(6):2098-2107.
doi: 10.1016/j.jaci.2021.03.047. Epub 2021 Apr 22.

Distinct cytokine profiles associated with COVID-19 severity and mortality

Affiliations
Clinical Trial

Distinct cytokine profiles associated with COVID-19 severity and mortality

Karim Dorgham et al. J Allergy Clin Immunol. 2021 Jun.

Abstract

Background: Markedly elevated levels of proinflammatory cytokines and defective type-I interferon responses were reported in patients with coronavirus disease 2019 (COVID-19).

Objective: We sought to determine whether particular cytokine profiles are associated with COVID-19 severity and mortality.

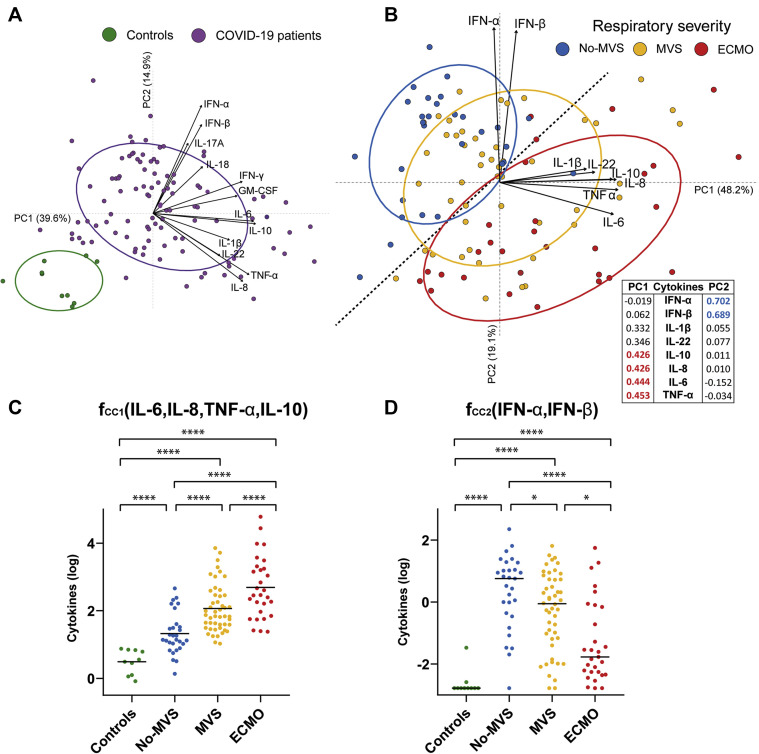
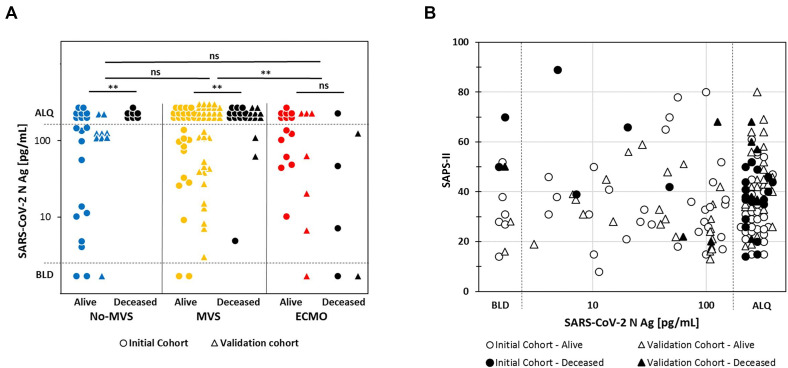
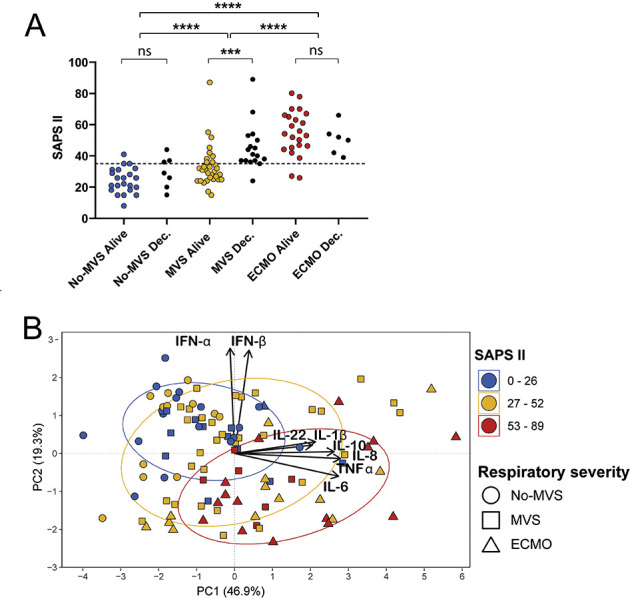
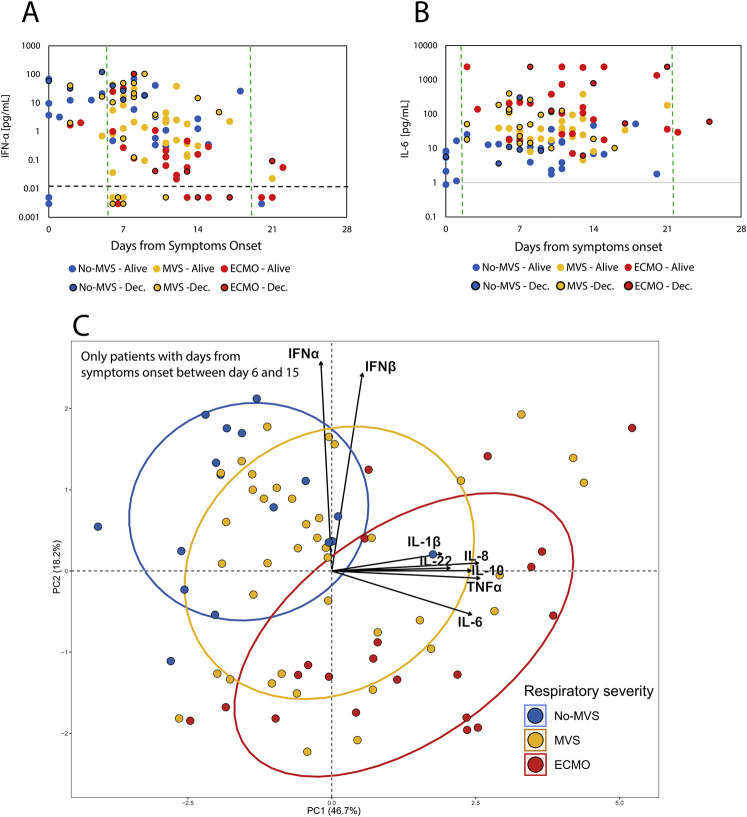
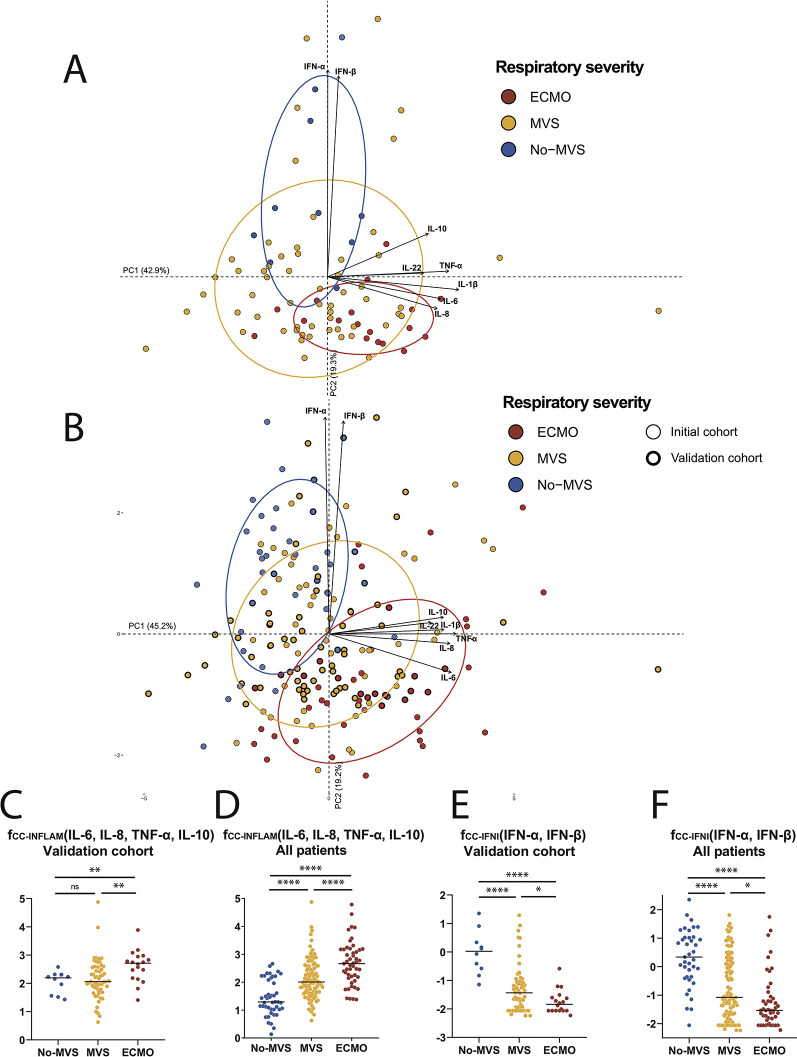
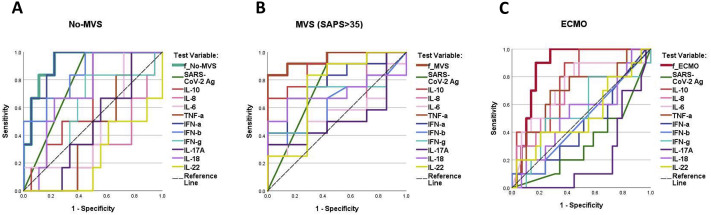
Methods: Cytokine concentrations and severe acute respiratory syndrome coronavirus 2 antigen were measured at hospital admission in serum of symptomatic patients with COVID-19 (N = 115), classified at hospitalization into 3 respiratory severity groups: no need for mechanical ventilatory support (No-MVS), intermediate severity requiring mechanical ventilatory support (MVS), and critical severity requiring extracorporeal membrane oxygenation (ECMO). Principal-component analysis was used to characterize cytokine profiles associated with severity and mortality. The results were thereafter confirmed in an independent validation cohort (N = 86).

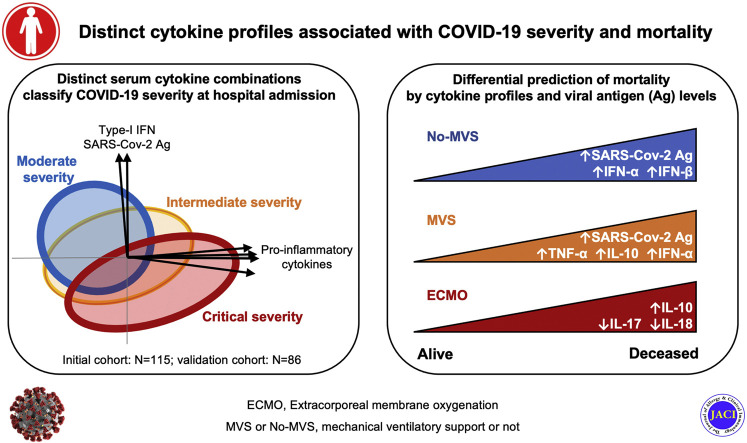
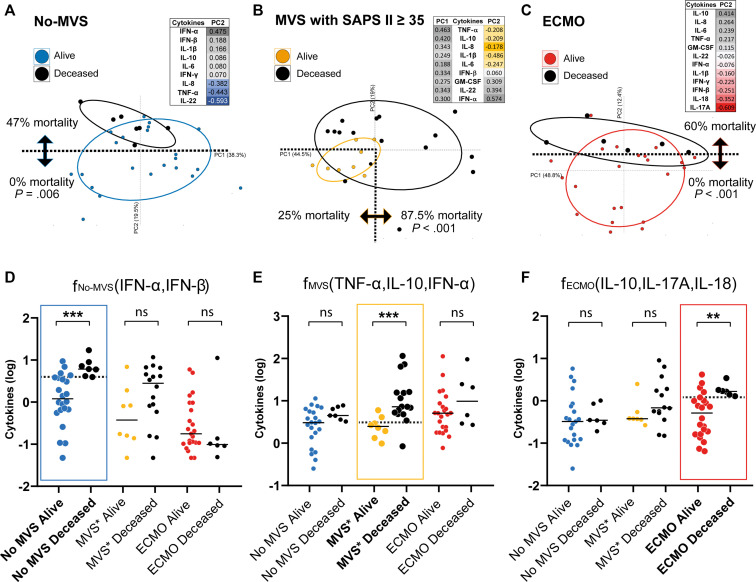
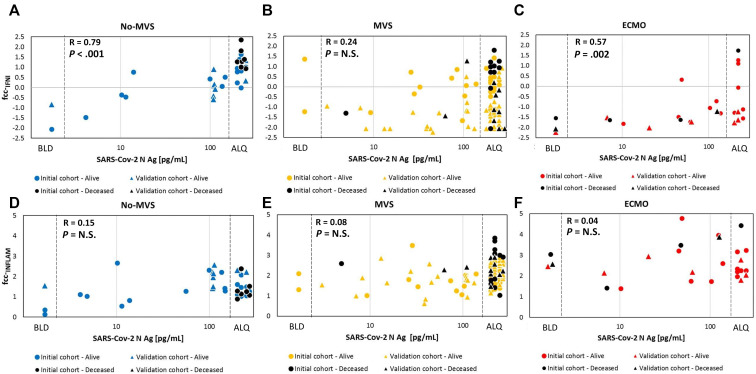
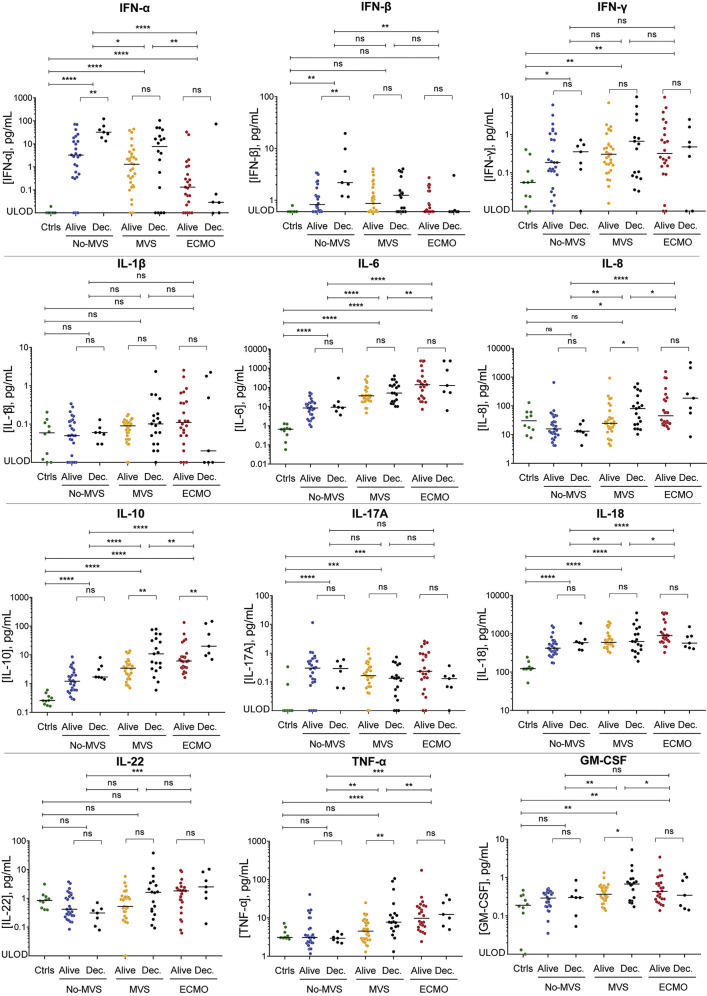
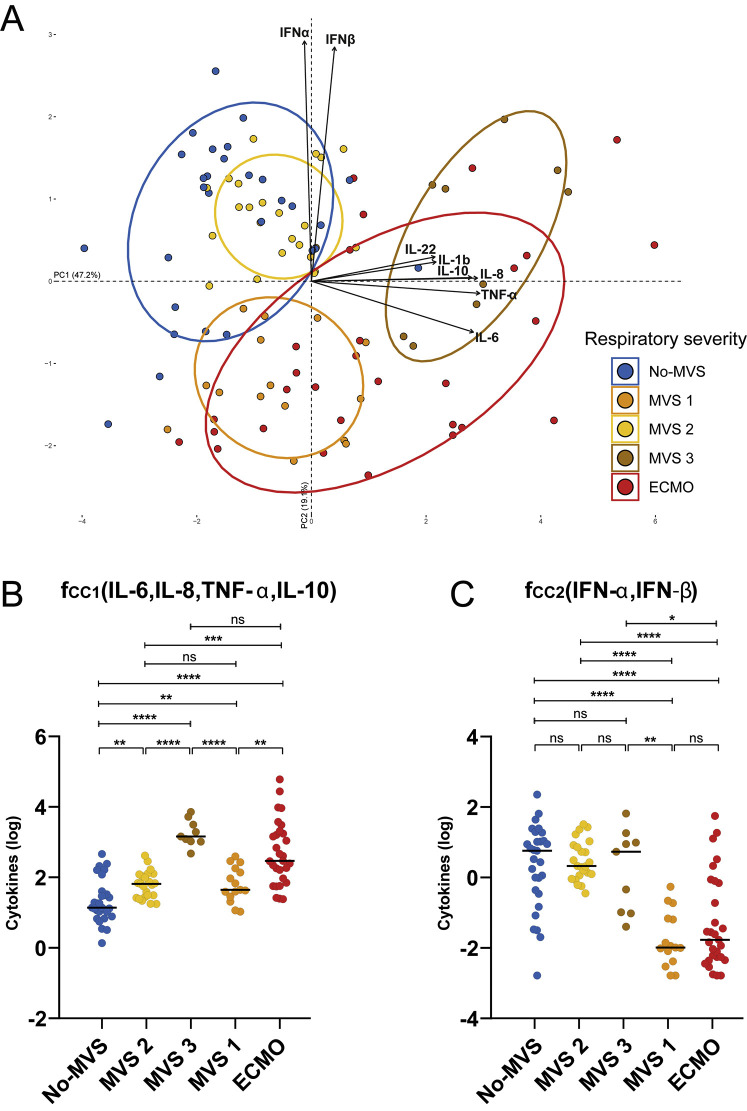
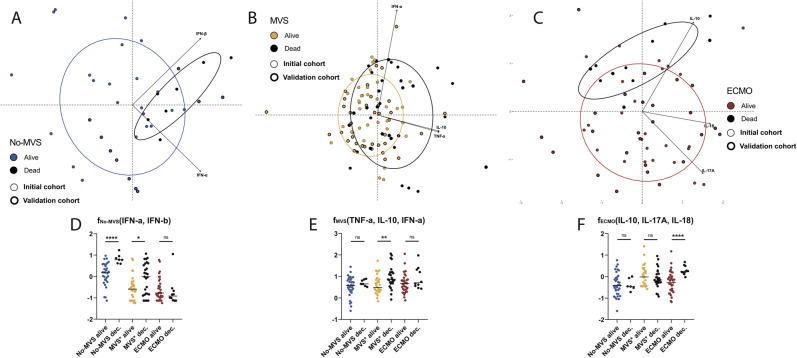
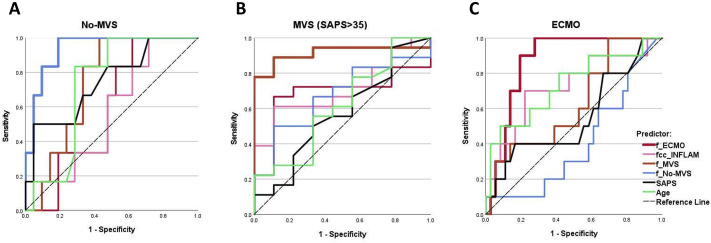
Results: At time of hospitalization, ECMO patients presented a dominant proinflammatory response with elevated levels of TNF-α, IL-6, IL-8, and IL-10. In contrast, an elevated type-I interferon response involving IFN-α and IFN-β was characteristic of No-MVS patients, whereas MVS patients exhibited both profiles. Mortality at 1 month was associated with higher levels of proinflammatory cytokines in ECMO patients, higher levels of type-I interferons in No-MVS patients, and their combination in MVS patients, resulting in a combined mortality prediction accuracy of 88.5% (risk ratio, 24.3; P < .0001). Severe acute respiratory syndrome coronavirus 2 antigen levels correlated with type-I interferon levels and were associated with mortality, but not with proinflammatory response or severity.

Conclusions: Distinct cytokine profiles are observed in association with COVID-19 severity and are differentially predictive of mortality according to oxygen support modalities. These results warrant personalized treatment of COVID-19 patients based on cytokine profiling.

Keywords: COVID-19; mortality; principal-component analysis; respiratory severity; serum cytokines; type-I interferons.


Figures

None
Graphical abstract
Fig 1
Fig 1
Distinct cytokine profiles associated with COVID-19 respiratory severity. A, PCA of 12 serum cytokines measured in patients with COVID-19 and controls. B, PCA, and PC factors (table), of the 8 cytokines most contributing to interpatient variation in patients with COVID-19, segregates the patients by respiratory severity groups. Ellipses represent the 68% CI of patient distribution in each group. Levels of the ensuing fcc-INFLAM (C), for inflammatory cytokines derived from PC1, and fcc-IFNI (D), for type-I interferons derived from PC2, are depicted for each respiratory severity group and the controls. Initial PCA with all 12 cytokines measured in the patients with COVID-19 had shown that IFN-γ, GM-CSF, IL-17A, and IL-18 either contribute less to the variation between patients and/or have a mixed contribution to PC1 and PC2. PC1 and PC2 contributed most of the variation between patients (67.3%), whereas higher PC dimensions had lower contributions (PC3 = 9.7%, PC4 = 6.6%) and did not contribute to separation of patients by severity. ns, Nonsignificant; PC, principal component. ∗P < .05; ∗∗P < .01; ∗∗∗P < .001; ∗∗∗∗P < .0001.
Fig 2
Fig 2
Distinct cytokine combinations associated with COVID-19 mortality. PCAs for each respiratory severity group: No-MVS (A), MVS(∗) (B), and ECMO (C) segregate surviving vs deceased patients in association with different cytokine combinations (corresponding PC factors in the tables). Levels of the ensuing fCC from the PC factors for each group, fNo-MVS (D), fMVS (E), and fECMO (F), are depicted for surviving vs deceased patients in each respiratory severity group. ns, Nonsignificant; PC, principal component. (∗)MVS with SAPS-II score greater than or equal to 35 (median of the MVS patients). ∗P < .05; ∗∗P < .01; ∗∗∗P < .001; ∗∗∗∗P < .0001.
Fig 3
Fig 3
SARS-CoV-2 serum viral load association with severity and mortality. A, SARS-CoV-2 nucleocapsid (N)-antigen levels depicted by respiratory severity group and deceased vs surviving patient per group (No-MVS: 100% ALQ in deceased vs 34.5% ALQ in surviving patients, P = .002; MVS: 86.4% ALQ in deceased vs 53.2% ALQ in surviving patients, P = .008; ECMO: 16.7% ALQ in deceased vs 47.6% ALQ in surviving patients, P = ns). B, SAPS-II scores depicted as function of N-antigen levels per patient (R = 0.05; P = ns), with deceased vs surviving patients marked. Only patients with a sample taken at most 14 days after symptom onset are included in the analysis, because antigen levels were significantly lower in samples taken after 14 days (50% BLD), as compared with until day 14 (5.4% BLD; P < .0001). For samples until 14 days there was no correlation of N-antigen levels with time from symptom onset and no difference between the cohorts. Ag, Antigen; ALQ, above upper limit of quantification; BLD, below limit of detection; ns, nonsignificant. ∗P < .05; ∗∗P < .01; ∗∗∗P < .001; ∗∗∗∗P < .0001.
Fig 4
Fig 4
Correlation between SARS-CoV-2 serum viral load and cytokine levels. The fCC values for fcc-IFNI comprising type-I interferons IFN-α, and IFN-β (A-C) and fcc-INFLAM comprising the inflammatory cytokines TNF-α, IL-10, IL-6, and IL-8 (D-F) are plotted as function of SARS-CoV-2 nucleocapsid (N)-antigen levels for each of the respiratory severity groups. Only patients with a sample taken at most 14 days after symptom onset are included in the analysis (see Fig 3). Ag, Antigen; ALQ, above upper limit of quantification; BLD, below limit of detection; N.S., nonsignificant.
Fig E1
Fig E1
Fig E2
Fig E2
Fig E3
Fig E3
Fig E4
Fig E4
Fig E5
Fig E5
Fig E6
Fig E6
Fig E7
Fig E7
Fig E8
Fig E8

References

    1. Huang C., Wang Y., Li X., Ren L., Zhao J., Hu Y. Clinical features of patients infected with 2019 novel coronavirus in Wuhan, China. Lancet (London, England) 2020;395:497–506. - PMC - PubMed
    1. Wang Q., Zhang Y., Wu L., Niu S., Song C., Zhang Z. Structural and functional basis of SARS-CoV-2 entry by using human ACE2. Cell. 2020;181:894–904.e9. - PMC - PubMed
    1. Schmidt M., Hajage D., Lebreton G., Monsel A., Voiriot G., Levy D. Extracorporeal membrane oxygenation for severe acute respiratory distress syndrome associated with COVID-19: a retrospective cohort study. Lancet Respir Med. 2020;8:1121–1131. - PMC - PubMed
    1. Moore J.B., June C.H. Cytokine release syndrome in severe COVID-19. Science. 2020;368:473–474. - PubMed
    1. Chen J., Subbarao K. The immunobiology of SARS∗. Annu Rev Immunol. 2007;25:443–472. - PubMed

Publication types