

Dynamics of the COVID-19 epidemic in urban and rural areas in the United States
- PMID: 33894385
- PMCID: PMC8061094
- DOI: 10.1016/j.annepidem.2021.04.007
Dynamics of the COVID-19 epidemic in urban and rural areas in the United States
Abstract
Purpose: There is a growing concern about the COVID-19 epidemic intensifying in rural areas in the United States (U.S.). In this study, we described the dynamics of COVID-19 cases and deaths in rural and urban counties in the U.S.
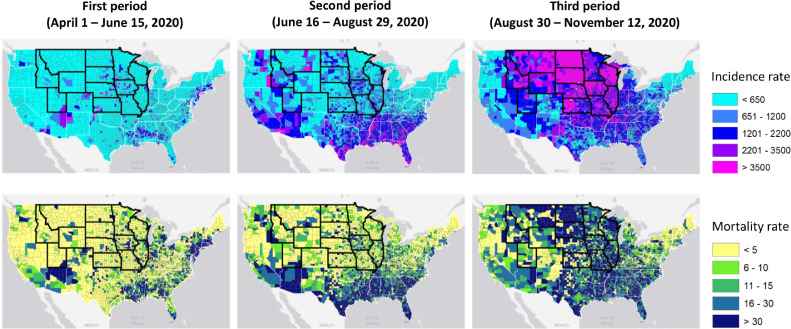
Methods: Using data from April 1 to November 12, 2020, from Johns Hopkins University, we estimated COVID-19 incidence and mortality rates and conducted comparisons between urban and rural areas in three time periods at the national level, and in states with higher and lower COVID-19 incidence rates.
Results: Results at the national level showed greater COVID-19 incidence rates in urban compared to rural counties in the Northeast and Mid-Atlantic regions of the U.S. at the beginning of the epidemic. However, the intensity of the epidemic has shifted to a rapid surge in rural areas. In particular, high incidence states located in the Mid-west of the country had more than 3,400 COVID-19 cases per 100,000 people compared to 1,284 cases per 100,000 people in urban counties nationwide during the third period (August 30 to November 12).
Conclusions: Overall, the current epicenter of the epidemic is located in states with higher infection rates and mortality in rural areas. Infection prevention and control efforts including healthcare capacity should be scaled up in these vulnerable rural areas.
Keywords: Covid-19; Disease mapping; Spatial epidemiology; United states: rural areas.
Copyright © 2021. Published by Elsevier Inc.
Figures
References
-
- Wu KJ.U.S. The New York Times; Manhattan, New York City: 2020. Coronavirus cases are rising sharply, but deaths are still down. https://www.nytimes.com/2020/07/03/health/coronavirus-mortality-testing...., Accessed on November 15, 2020.
-
- Bialek S., Bowen V., Chow N., Curns A., Gierke R., Hall A., et al. Centers for Disease Control and Prevention; Atlanta, Georgia: 2020. Geographic differences in COVID-19 cases, deaths, and incidence—United states. February 12–April 7, 2020.
-
- Miller I.F., Becker A.D., Grenfell B.T., Metcalf C.J.E. Disease and healthcare burden of COVID-19 in the United States. Nat. Med. 2020:1–6. - PubMed
MeSH terms
LinkOut - more resources
Full Text Sources
Other Literature Sources
Medical
Miscellaneous
