. 2021;12(2):715-739.
doi: 10.1016/j.jcmgh.2021.04.007. Epub 2021 Apr 21.

Programmed Death Ligand 1-Expressing Classical Dendritic Cells MitigateHelicobacter-Induced Gastritis

Affiliations

Programmed Death Ligand 1-Expressing Classical Dendritic Cells MitigateHelicobacter-Induced Gastritis

Du-Min Go et al. Cell Mol Gastroenterol Hepatol. 2021.

Abstract

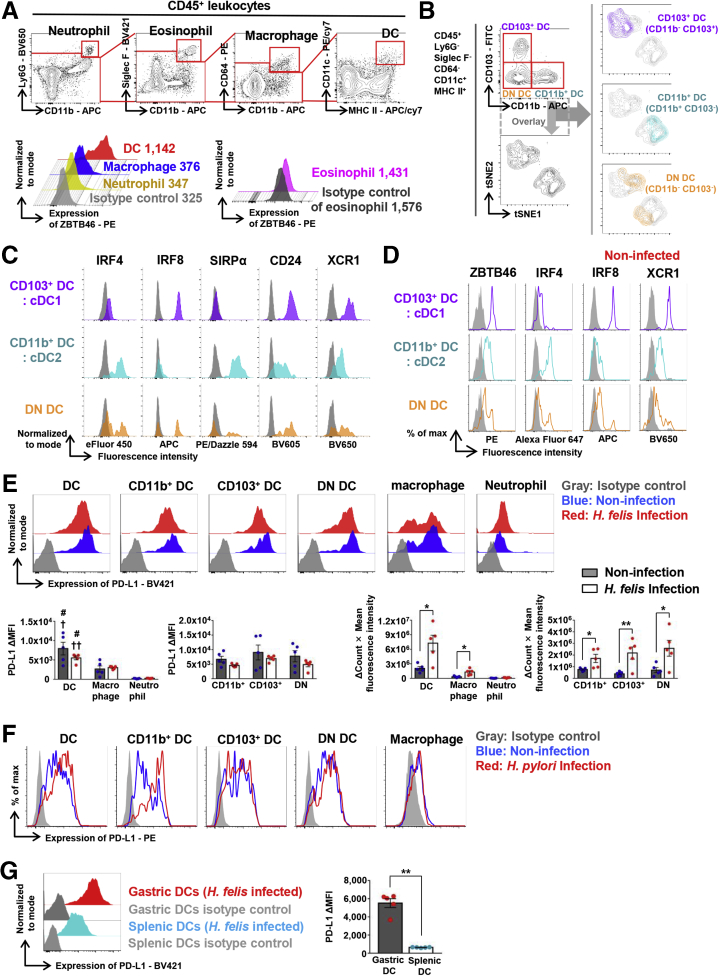
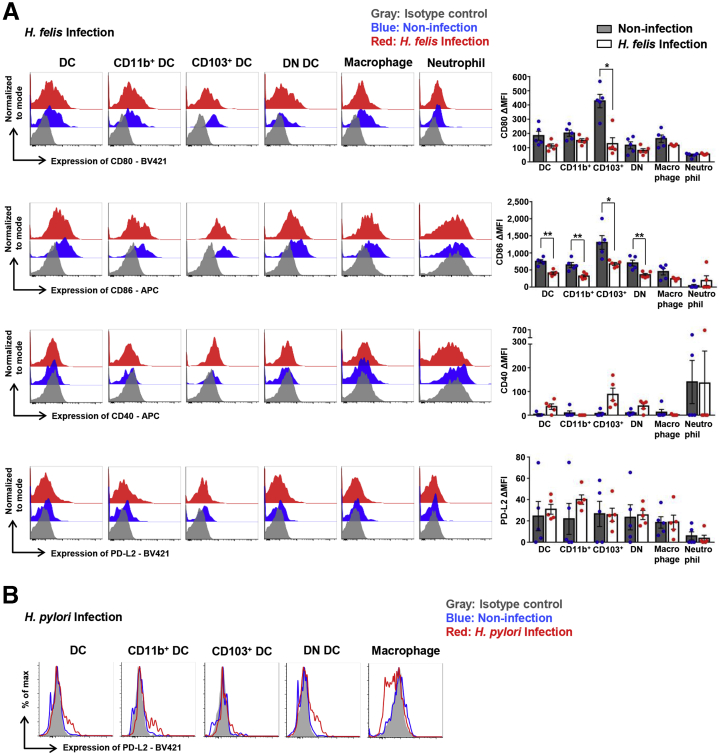
Background & aims: Helicobacter pylori has been reported to modulate local immune responses to colonize persistently in gastric mucosa. Although the induced expression of programmed cell death ligand 1 (PD-L1) has been suggested as an immune modulatory mechanism for persistent infection of H pylori, the main immune cells expressing PD-L1 and their functions in Helicobacter-induced gastritis still remain to be elucidated.

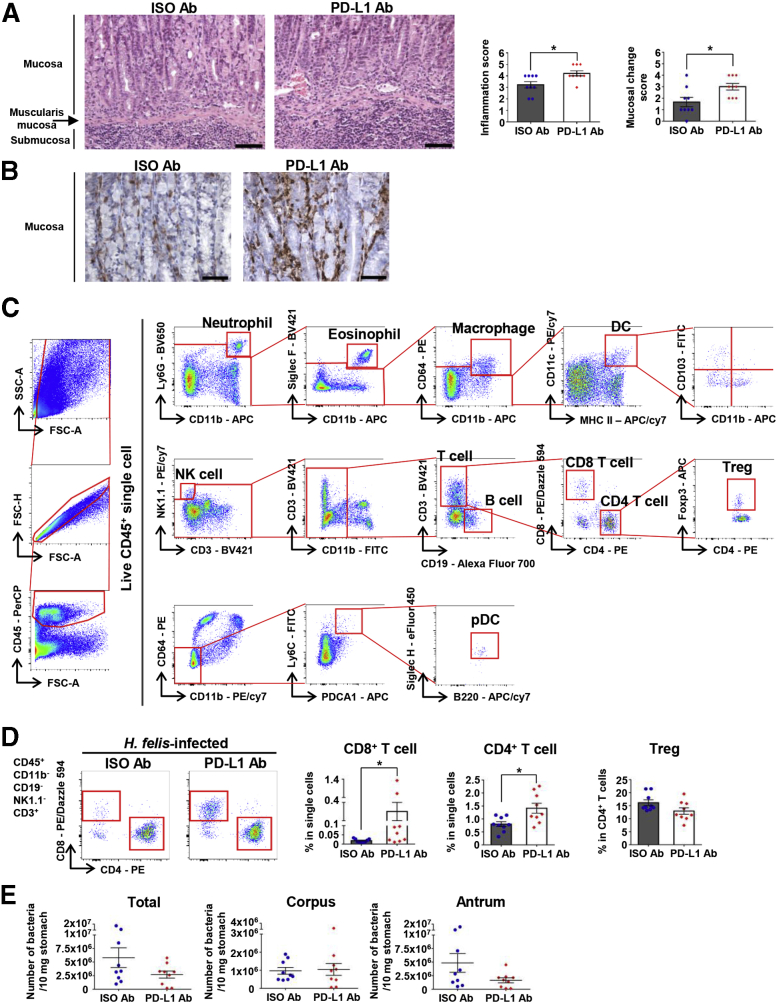
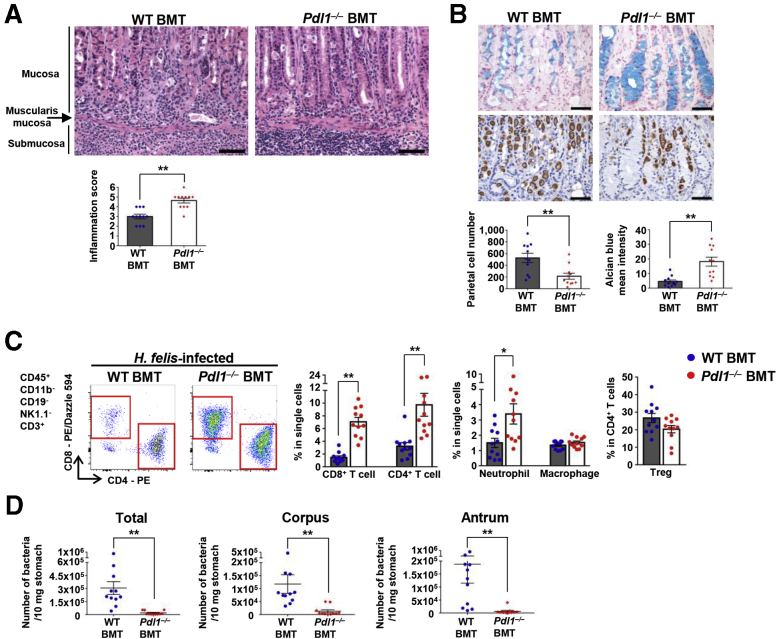
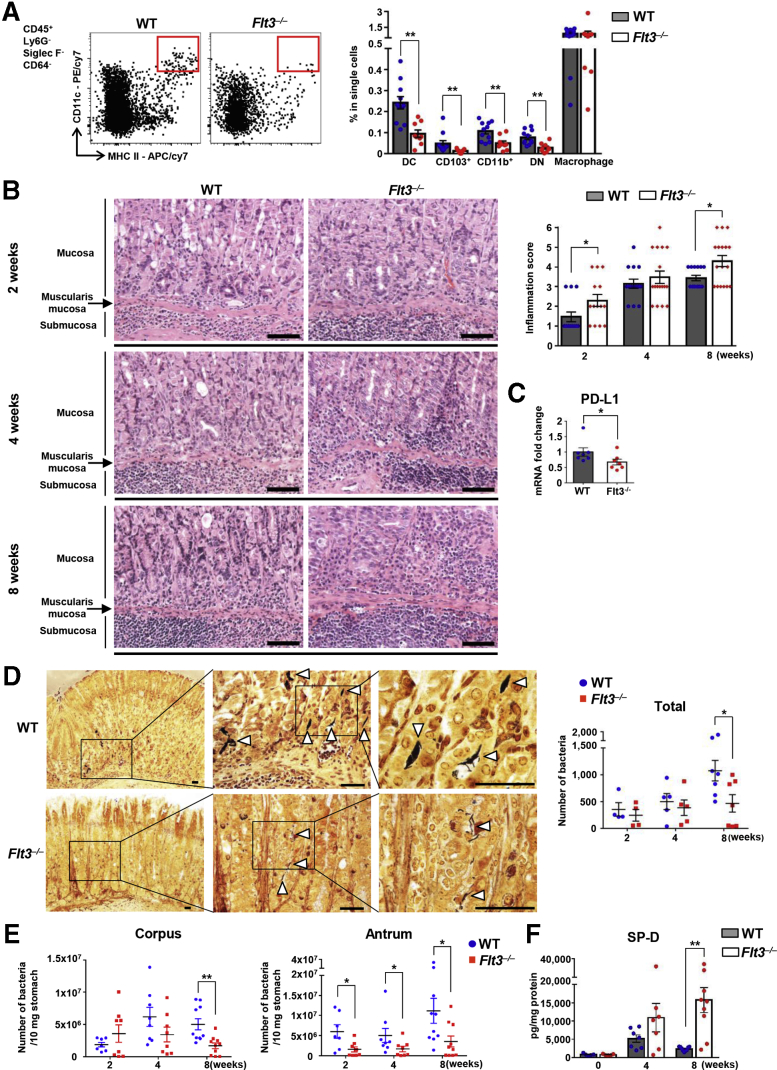
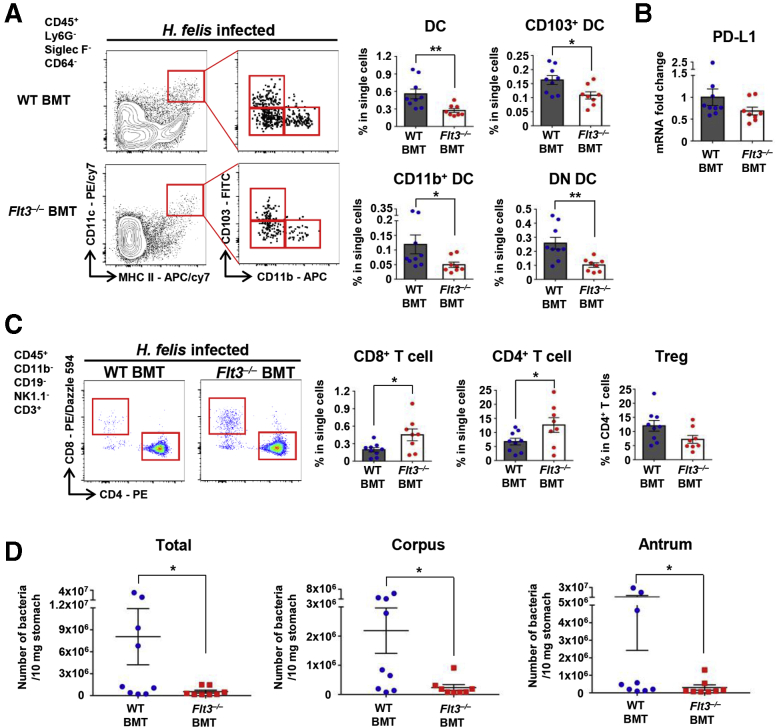
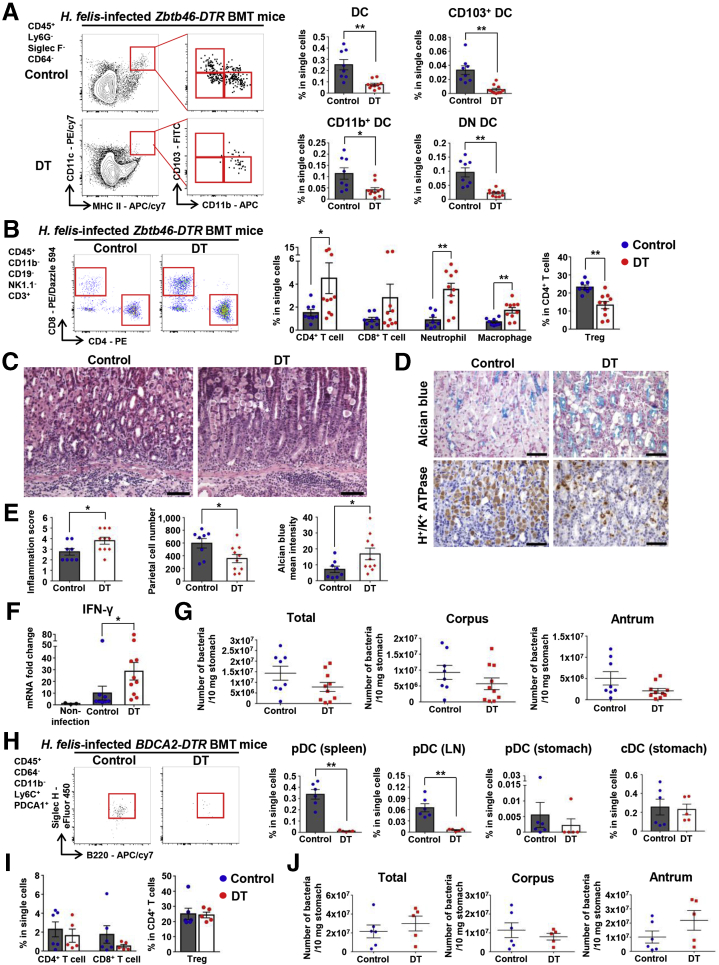
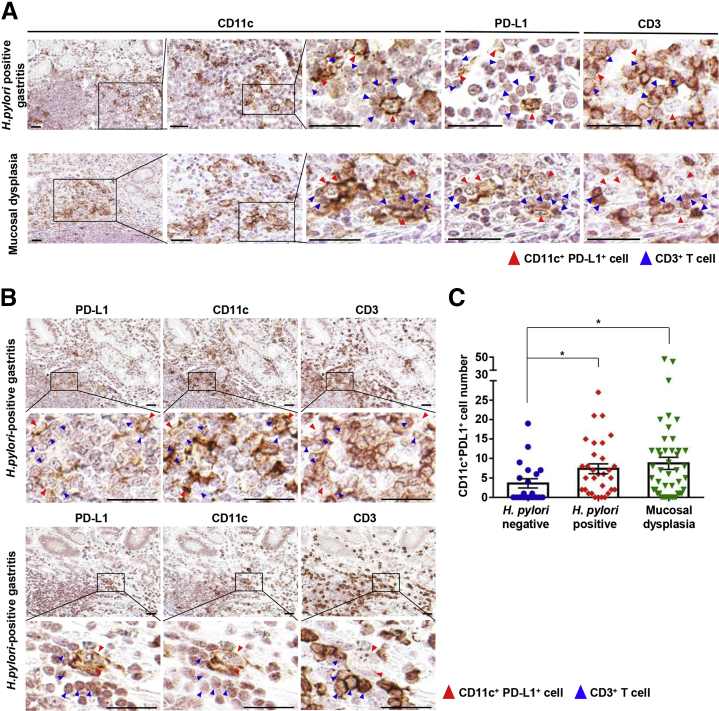
Methods: The blockades of PD-L1 with antibody or PD-L1-deficient bone marrow transplantation were performed in Helicobacter-infected mice. The main immune cells expressing PD-L1 in Helicobacter-infected stomach were determined by flow cytometry and immunofluorescence staining. Helicobacter felis or H pylori-infected dendritic cell (DC)-deficient mouse models including Flt3-/-, Zbtb46-diphtheria toxin receptor, and BDCA2-diphtheria toxin receptor mice were analyzed for pathologic changes and colonization levels. Finally, the location of PD-L1-expressing DCs and the correlation with H pylori infection were analyzed in human gastric tissues using multiplexed immunohistochemistry.

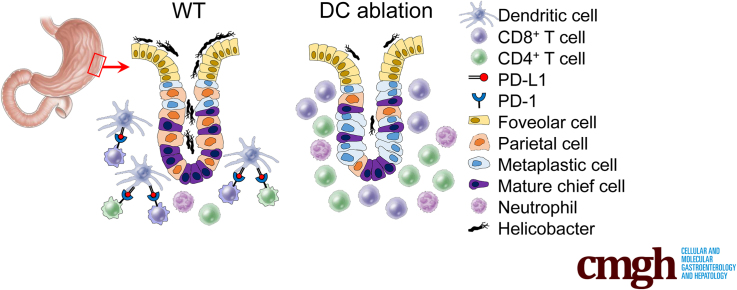
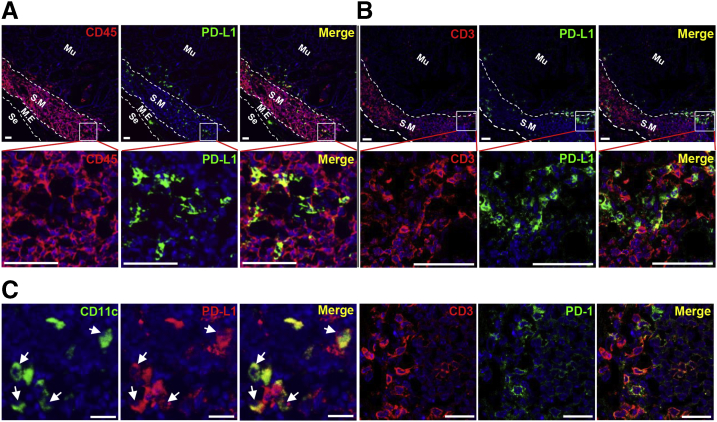
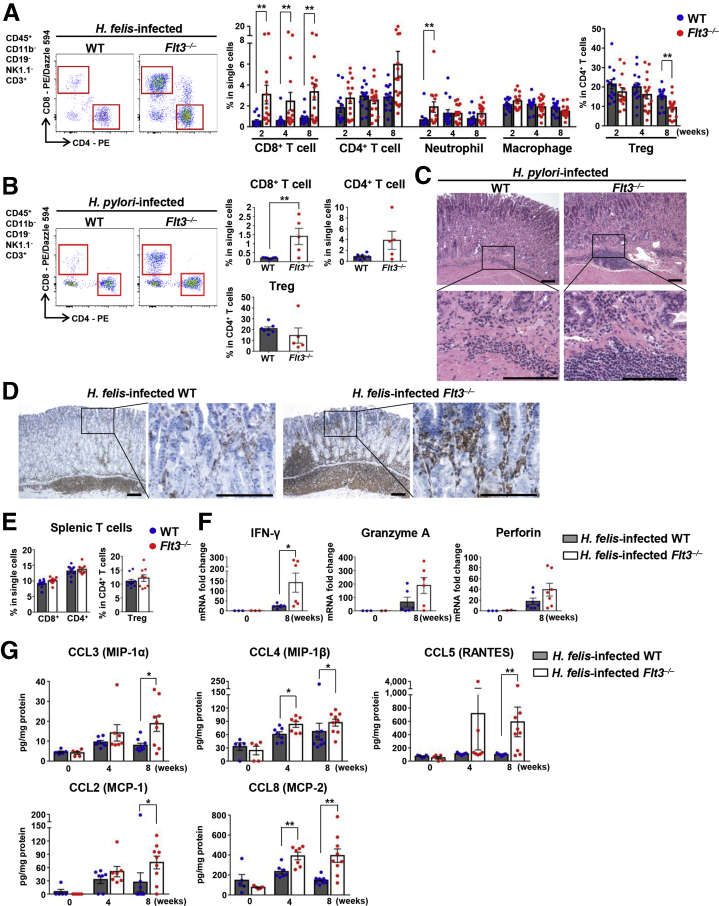
Results: Genetic or antibody-mediated blockade of PD-L1 aggravated Helicobacter-induced gastritis with mucosal metaplasia. Gastric classical DCs expressed considerably higher levels of PD-L1 than other immune cells and co-localized with T cells in gastritis lesions from Helicobacter-infected mice and human beings. H felis- or H pylori-infected Flt3-/- or classical DC-depleted mice showed aggravated gastritis with severe T-cell and neutrophil accumulation with low bacterial loads compared with that in control mice. Finally, PD-L1-expressing DCs were co-localized with T cells and showed a positive correlation with H pylori infection in human subjects.

Conclusions: The PD-1/PD-L1 pathway may be responsible for the immune modulatory function of gastric DCs that protects the gastric mucosa from Helicobacter-induced inflammation, but allows persistent Helicobacter colonization.

Keywords: Gastric Inflammation; Immune Regulation; Mucosal Metaplasia; T Cell.


Figures

None
Graphical abstract
Figure 1
Figure 1
Blockade of PD-L1 enhances gastric inflammation upon H felis infection for 4 weeks. (A) Histopathologic analysis of H felis–induced gastritis, oxyntic atrophy, and mucosal metaplasia according to grading criteria on H&E stain. Representative H&E images of the gastric corpus regions of isotype control mice and mice with PD-L1 blockade (left). Inflammation score and mucosal change score (right) (isotype control mice, n = 9; PD-L1 blockade mice, n = 9). Scale bar: 100 μm. (B) More severe mucosal infiltration of T cells in the gastric corpus regions of mice with PD-L1 blockade. Representative images of CD3 IHC (3,3'-diaminobenzidine substrate). Scale bar: 50 μm. (C) Gating strategy for the analysis of gastric immune cells. (D) Percentage of CD8+ T cells and CD4+ T cells in live single cells and of Tregs in live CD4+ T cells from the stomach of mice with PD-L1 blockade (n = 9) and isotype control mice (n = 9). Representative flow cytometry plots (left). (E) The bacterial loads were evaluated using quantitative real-time PCR for H felis flagellar filament B DNA extracted from the corpus and antrum, respectively (isotype control mice, n = 9; PD-L1 blockade mice, n = 9). Data are presented as means ± SEM. ∗P < .05. APC, allophycocyanin; FITC, fluorescein isothiocyanate; FSC, forward scatter; ISO, isotype control; NK, natural killer; PE, phycoerythrin; SSC, side scatter.
Figure 2
Figure 2
PD-L1 deficiency in BM-derived cells enhances gastric inflammation with mucosal metaplasia upon H felis infection for 4 weeks. (A) Histopathologic analysis of H felis–induced gastritis. Representative H&E images of the gastric corpus regions of WT BMT and Pdl1–/– BMT mice (top). Inflammation score (bottom) (WT BMT, n = 11; Pdl1–/– BMT, n = 11). Scale bar: 100 μm. (B) Histopathologic analysis of H felis–induced oxyntic atrophy and mucosal metaplasia. Representative serial images of the gastric corpus regions of WT BMT (left) and Pdl1–/– BMT (right) mice after Alcian blue staining (top) and H+/K+-ATPase IHC (bottom). Quantification of H+/K+-ATPase+ cells (parietal cells) and Alcian blue–positive region (WT BMT, n = 11; Pdl1–/– BMT, n = 11). Scale bar: 50 μm. (C) Percentage of CD8+ T cells, CD4+ T cells, neutrophils, and macrophages in live single cells and of Tregs in live CD4+ T cells from the stomach of WT BMT (n = 11) and Pdl1–/– BMT (n = 11) mice. Representative flow cytometry plots of T cells (left). (D) H felis loads were evaluated using quantitative real-time PCR for H felis flagellar filament B DNA extracted from the corpus and antrum, respectively (WT BMT, n = 11; Pdl1–/– BMT, n = 11). Data are presented as means ± SEM. ∗P < .05 and ∗∗P < .01. PE, phycoerythrin.
Figure 3
Figure 3
Location of PD-L1–expressing immune cells in the stomach during Helicobacter infection. (AC) Immunofluorescence for PD-L1, CD45, CD3, CD11c, and PD-1 in the gastric corpus regions of H felis–infected WT mice. (A and B) Note the localization of PD-L1+ cells in the submucosa and mucosal laminar propria immediately above the muscularis mucosa. PD-L1+ cells are co-stained with CD45 and co-localize with CD3+ T cells. Scale bar: 50 μm. (C) PD-L1+CD11c+ cells (arrows) and PD-1+CD3+ T cells in the submucosa. Scale bar: 20 μm. M.E, muscularis externa; Mu, mucosa; Se, serosa; S.M, submucosa.
Figure 4
Figure 4
Gastric cDCs express a high level of PD-L1. (A) Gating strategy of DCs, defined as CD45+Ly6G-Siglec F-CD64-CD11c+MHC II+ cells and expression of ZBTB46 in gastric DCs, macrophages, neutrophils, and eosinophils. Numbers in the histogram represent the median fluorescence intensity of ZBTB46 in each population. Note that DCs express considerably higher levels of ZBTB46 than other cell types. (B) A t-stochastic neighborhood embedding (tSNE) plot of total gastric cDCs and overlay of each cDC subset. (C) Expression of IRF4, IRF8, SIRPα, CD24, and XCR1 in 3 gastric cDC subsets under H felis infection. (D) Expression of ZBTB46, IRF4, IRF8, and XCR1 in 3 gastric cDC subsets under normal conditions. Gray indicates isotype control. (AD) Concatenated data from 3 independent experiments. (E) PD-L1 expression on innate immune cells 8 weeks after H felis infection. Δ mean fluorescence intensity (MFI) = (sample MFI) – (isotype control MFI) Δ(count × MFI) = ([count × mean fluorescence intensity] of sample) – ([count × mean fluorescence intensity] of isotype control). Note that DCs and DC subsets express considerably higher levels of PD-L1 than other cell types. Each figure represents 5 independent experiments. Three mice per group were pooled for each experiment. Data are presented as means ± SEM. P < .05, and ††P < .01, compared with macrophages; #P < .01, compared with neutrophils; ∗P < .05 and ∗∗P < .01, compared between the noninfected and H felis–infected groups. (F) As in panel E, but with H pylori infection. Note that DCs and DC subsets express considerably higher levels of PD-L1 than macrophages. (G) Comparison of PD-L1 expression levels in gastric DCs and splenic DCs 8 weeks after H felis infection. The left figure is representative of the 5 experiments. ΔMFI = (sample MFI) – (isotype control MFI). Three mice per group were pooled for each experiment. Stomach and spleen were collected from the same individuals. Data are presented as means ± SEM. ∗∗P < .01. APC, allophycocyanin; FITC, fluorescein isothiocyanate.
Figure 5
Figure 5
Expression level of co-stimulatory molecules and PD-L2 in gastric DCs. (A) Expression levels of CD80, CD86, CD40, and PD-L2 on innate immune cells 8 weeks after H felis infection. Data are presented as means ± SEM. ∗P < .05 and ∗∗P < .01. Each figure is representative of 5 independent experiments. Three mice per group were pooled for each experiment. (B) Expression level of PD-L2 on innate immune cells 18 months after H pylori infection. Three mice per group were pooled for the experiment. APC, allophycocyanin; max., maximum.
Figure 6
Figure 6
Helicobacter infection increases DCs in gastric mucosa and submucosa. (A) Localization of CD11c+ DCs (arrows) under steady state. Left: Representative images of CD11c IHC (3,3'-diaminobenzidine substrate). Right: Representative images of normal CD11c-Enhanced Yellow Fluorescent Protein (EYFP) mouse stomach. White arrowhead indicates a limiting ridge at the boundary of the glandular and nonglandular stomach. Scale bar: 50 μm. (B) Localization and number of gastric CD11c+ DCs (arrows) in the gastric corpus regions of H felis–infected WT mice. Left: Representative images of CD11c IHC (3,3'-diaminobenzidine substrate). Right: Manual cell count of CD11c+ DCs in 2 paraffin sections (n = 5 for each group). Scale bar: 50 μm. (C) Numeric increase in gastric DCs during H felis infection. Percentage of leukocytes, DCs, and DC subsets in live single cells from the stomach of WT mice with H felis infection. Left: Representative flow cytometry plots. Right: Asterisks at 2, 4, and 8 weeks after H felis infection (n = 13–14 for each group) signify a significant increase compared with that in normal WT mice (n = 11). Data are presented as means ± SEM. ∗P < .01. Week, duration of infection. APC, allophycocyanin; FITC, fluorescein isothiocyanate; FSC, forward scatter; Lu, lumen; M.E, muscularis externa; Mu, mucosa; M.S, mucosal surface; PerCP, peridinin-chlorophyll-protein complex; Se, serosa.
Figure 7
Figure 7
Flt3–/–mice with a decreased number of gastric DCs developed severe gastric inflammation with less Helicobacter colonization. (A) Percentage of DCs, DC subsets, and macrophages in live single cells from the stomach of normal Flt3–/– and WT mice. Representative flow cytometry plots (left). Gastric DCs and all DC subsets, but not macrophages, are deficient in Flt3–/– mice (n = 9) compared with WT mice (n = 11). (B) Histopathologic analysis of H felis–induced gastritis. Representative H&E images of the gastric corpus regions of WT and Flt3–/– mice were aligned (left). Inflammation score (right). Each mouse was scored (n = 13–17 for each group). Scale bar: 100 μm. (C) Relative PD-L1 mRNA expression levels in gastric corpus tissues from Flt3–/– and WT mice after H felis infection for 8 weeks. Results are shown as fold change compared with that in the H felis–infected WT group (n = 6–7 for each group). (D) Localization of H felis (white arrowheads) in the gastric corpus regions of WT and Flt3–/– mice (Warthin–Starry stain) and a manual count of H felis in 2 paraffin sections (n = 4–7 for each group). Scale bar: 50 μm. (E) H felis loads were evaluated using quantitative real-time PCR for H felis flagellar filament B DNA extracted from the corpus and antrum, respectively (n = 7–10 for each group). (F) Level of SP-D in gastric corpus tissues from Flt3–/– and WT mice using a magnetic luminex immunoassay (R&D Systems, Minneapolis, MN). Measured protein concentrations (pg/mL) were corrected for total protein content (mg/mL) (n = 7 and 9 for groups with 4 and 8 weeks of H felis infection, respectively; n = 5 for noninfection group). Data are presented as means ± SEM. ∗P < .05 and ∗∗P < .01. Weeks, duration of infection. APC, allophycocyanin.
Figure 8
Figure 8
Flt3–/–mice have enhanced mucosal metaplasia upon Helicobacter infection. (AC) Histopathologic analysis of H felis–induced metaplasia of the corpus mucosa. (A) Analysis of H felis–induced oxyntic atrophy and mucosal metaplasia. Representative serial images of H felis–infected WT (left) and H felis–infected Flt3–/– (right) mice for Alcian blue staining (top) and H+/K+-ATPase IHC (bottom) were aligned (2, 4, and 8 weeks after H felis infection). Scale bar: 50 μm. (B) Analysis of H felis–induced mucosal metaplasia and proliferation. Representative serial images of normal WT (top), H felis WT (middle) and H felis–infected Flt3–/– (bottom) mice after immunostaining for TFF2 (green), CLU (red), and Ki67 (3,3'-diaminobenzidine substrate) were aligned (8 weeks after H felis infection). Scale bar: 100 μm. (C) Quantification of H+/K+-ATPase+ cells (parietal cells) (n = 10 for each group), Alcian blue–positive region (n = 10 for each group), TFF2 and CLU double-positive region (WT, n = 9; Flt3–/–, n = 9), and Ki67-positive cells (WT, n = 9; Flt3–/–, n = 8) is shown. Data are presented as means ± SEM. ∗P < .05 and ∗∗P < .01. Weeks, duration of infection.
Figure 9
Figure 9
Flt3–/–mice show more prominent CD8+T-cell accumulation upon Helicobacter infection. (A) Percentage of CD8+ T cells, CD4+ T cells, neutrophils, and macrophages in live single cells and of Tregs in live CD4+ T cells from the stomach of Flt3–/– and WT mice with H felis infection (n = 13–17 for each H felis infection group, n = 9–11 for the noninfection group). Representative flow cytometry plots of T cells (left). (B) As in panel A, but with H pylori infection (WT, n = 7; Flt3–/–, n = 5). Note that the number of CD8+ T cells is higher in Flt3–/– mice. (C) Representative H&E images of the gastric corpus regions of H pylori–infected WT (left) and H pylori–infected Flt3–/– (right) mice were aligned. Scale bar: 200 μm. (D) More severe mucosal infiltration of T cells in the stomach of H felis–infected Flt3–/– mice. Representative images of CD3 IHC (3,3'-diaminobenzidine substrate). Scale bar: 200 μm. (E) The T-cell fraction in the spleens of WT and Flt3–/– mice 8 weeks after H felis infection. Note that DC depletion did not affect CD8+ T cells, CD4+ T cells, or the Treg population in the spleen (WT, n = 10; Flt3–/–, n = 9). (F) Relative IFN-γ, Granzyme A, and Perforin mRNA expression levels in gastric corpus tissues from Flt3–/– and WT mice after H felis infection for 8 weeks. Results are shown as fold change compared with the noninfected WT group (n = 6–7 for the H felis infection group, n = 2–3 for the noninfection group). (G) Chemokine levels in gastric corpus tissues from Flt3–/– and WT mice using a magnetic Luminex immunoassay. Measured protein concentrations (pg/mL) were corrected for total protein content (mg/mL) (n = 7 and 9 for groups with 4 and 8 weeks of H felis infection, respectively; n = 5 for noninfection group). Data are presented as means ± SEM. ∗P < .05 and ∗∗P < .01. Weeks, duration of infection.
Figure 10
Figure 10
Flt3–/–BMT mice with a decreased number of gastric DCs developed prominent T-cell responses with less Helicobacter colonization after H felis infection for 8 weeks. (A) The percentage of DCs and DC subsets in live single cells from the stomach of Flt3–/– BMT (n = 8) and WT BMT (n = 9) mice. Representative flow cytometry plots (left panel). (B) Relative PD-L1 mRNA expression levels in gastric corpus tissues from Flt3–/– BMT (n = 8) and WT BMT (n = 9) mice 8 weeks after H felis infection. Results are shown as fold change compared with that in the H felis–infected WT BMT group. (C) Percentage of CD8+ T cells and CD4+ T cells in live single cells and of Tregs in live CD4+ T cells from the stomach of Flt3–/– BMT (n = 8) and WT BMT (n = 9) mice. Representative flow cytometry plots (left panel). (D) H felis loads were evaluated using quantitative real-time PCR for H felis flagellar filament B DNA extracted from the corpus and antrum, respectively (WT BMT, n = 9; Flt3–/– BMT, n = 8). Data are presented as means ± SEM. ∗P < .05 and ∗∗P < .01. APC, allophycocyanin; PE, phycoerythrin.
Figure 11
Figure 11
Depletion of cDCs enhances Helicobacter-induced gastric inflammation. (A) Percentage of DCs and DC subsets in live single cells from the stomach of DT-injected Zbtb46-DTR BMT mice (cDC-ablated mice; n = 10) and PBS-injected Zbtb46-DTR BMT mice (control mice; n = 8) 4 weeks after H felis infection. Representative flow cytometry plots (left). Note that gastric DCs and DC subsets are Zbtb46-dependent cDCs. (B) Percentage of CD8+ T cells, CD4+ T cells, neutrophils, and macrophages in live single cells and of Tregs in live CD4+ T cells from the stomach of cDC-ablated (n = 10)and control (n = 8) mice. Representative flow cytometry plots of T cells (left). (C) Histopathologic analysis of H felis–induced gastritis. Representative H&E images of the gastric corpus regions of control (left) and cDC-ablated (right) mice. Scale bar: 100 μm. (D) Histopathologic analysis of H felis–induced oxyntic atrophy and mucosal metaplasia. Representative serial images of the gastric corpus regions of control (left) and cDC-ablated (right) mice after Alcian blue staining (top) and H+/K+-ATPase IHC (bottom). Scale bar: 50 μm. (E) Inflammation score (left) and quantification of H+/K+-ATPase+ cells (parietal cells) (middle), and Alcian blue–positive region (right) (control mice, n = 8; cDC-ablated mice, n = 10). (F) Relative gastric mRNA expression levels of IFN-γ. Results are shown as fold change compared with the noninfection group (noninfection group, n = 3; control group, n = 8; cDC-ablated group, n = 10). (G) bacterial loads were evaluated using quantitative real-time PCR for H felis flagellar filament B DNA extracted from the corpus and antrum, respectively (control mice, n = 8; cDC-ablated mice, n = 10). (H) Percentage of pDCs (spleen, gastric lymph node [LN], and stomach) and cDCs (stomach) in live single cells of DT-injected BDCA2-DTR BMT mice (pDC-ablated mice; n = 5) and PBS-injected BDCA2-DTR BMT mice (control; n = 6). Representative pDCs flow cytometry plot of 4 pooled stomachs per group (left). (I) Percentage of CD8+ T cells and CD4+ T cells in live single cells and of Tregs in live CD4+ T cells from the stomach of pDC-ablated mice (n = 5) and control mice (n = 6). (J) Bacterial loads were evaluated using quantitative real-time PCR for H felis flagellar filament B DNA extracted from the corpus and antrum, respectively (control mice, n = 6; pDC-ablated mice, n = 5). Data are presented as means ± SEM. ∗P < .05 and ∗∗P < .01. Weeks, duration of infection. PE, phycoerythrin.
Figure 12
Figure 12
PD-L1–expressing DCs co-localize with T cells in human Helicobacter-positive gastritis. (A) Multiplexed IHC-stained representative images of the stomach of H pylori–positive patients (top) and patients with mucosal dysplasia (bottom). Multiplexed IHC was performed sequentially on each single section in the order of PD-L1, CD11c, and CD3. After each immunostained section was scanned, the section was placed in antibody stripping buffer to erase the staining and subjected to another immunostaining. Note that PD-L1+CD11c+ cells (red arrowheads) co-localize with CD3+ cells (blue arrowheads). Scale bar: 30 μm. (B) Multiplexed IHC stained representative images of the stomach of other H pylori–positive patients. Note that the positions of PD-L1+ and CD11c+ cells are similar (low-power fields) and PD-L1+CD11c+ cells (red arrowheads) co-localize with CD3+ cells (blue arrowheads) (high-power fields). Scale bar: 30 μm. (C) Quantification of PD-L1+CD11c+ cells in a section of a biopsy sample (H pylori–negative sample, n = 21; H pylori–positive sample, n = 31; mucosal dysplasia sample, n = 46). Data are presented as means ± SEM. ∗P < .05.

References

    1. Arasanz H., Gato-Cañas M., Zuazo M., Ibañez-Vea M., Breckpot K., Kochan G., Escors D. PD1 signal transduction pathways in T cells. Oncotarget. 2017;8:51936–51945. - PMC - PubMed
    1. Fife B.T., Pauken K.E., Eagar T.N., Obu T., Wu J., Tang Q., Azuma M., Krummel M.F., Bluestone J.A. Interactions between PD-1 and PD-L1 promote tolerance by blocking the TCR-induced stop signal. Nat Immunol. 2009;10:1185–1192. - PMC - PubMed
    1. Wherry E.J. T cell exhaustion. Nat Immunol. 2011;12:492–499. - PubMed
    1. Chikuma S., Terawaki S., Hayashi T., Nabeshima R., Yoshida T., Shibayama S., Okazaki T., Honjo T. PD-1-mediated suppression of IL-2 production induces CD8+ T cell anergy in vivo. J Immunol. 2009;182:6682–6689. - PubMed
    1. Dong H., Strome S.E., Salomao D.R., Tamura H., Hirano F., Flies D.B., Roche P.C., Lu J., Zhu G., Tamada K., Lennon V.A., Celis E., Chen L. Tumor-associated B7-H1 promotes T-cell apoptosis: a potential mechanism of immune evasion. Nat Med. 2002;8:793–800. - PubMed

Publication types

MeSH terms