Review
. 2021 Oct:70:26-33.
doi: 10.1016/j.sbi.2021.03.005. Epub 2021 Apr 21.

Multicolor single-molecule FRET for DNA and RNA processes

Affiliations
Review

Multicolor single-molecule FRET for DNA and RNA processes

Xinyu A Feng et al. Curr Opin Struct Biol. 2021 Oct.

Abstract

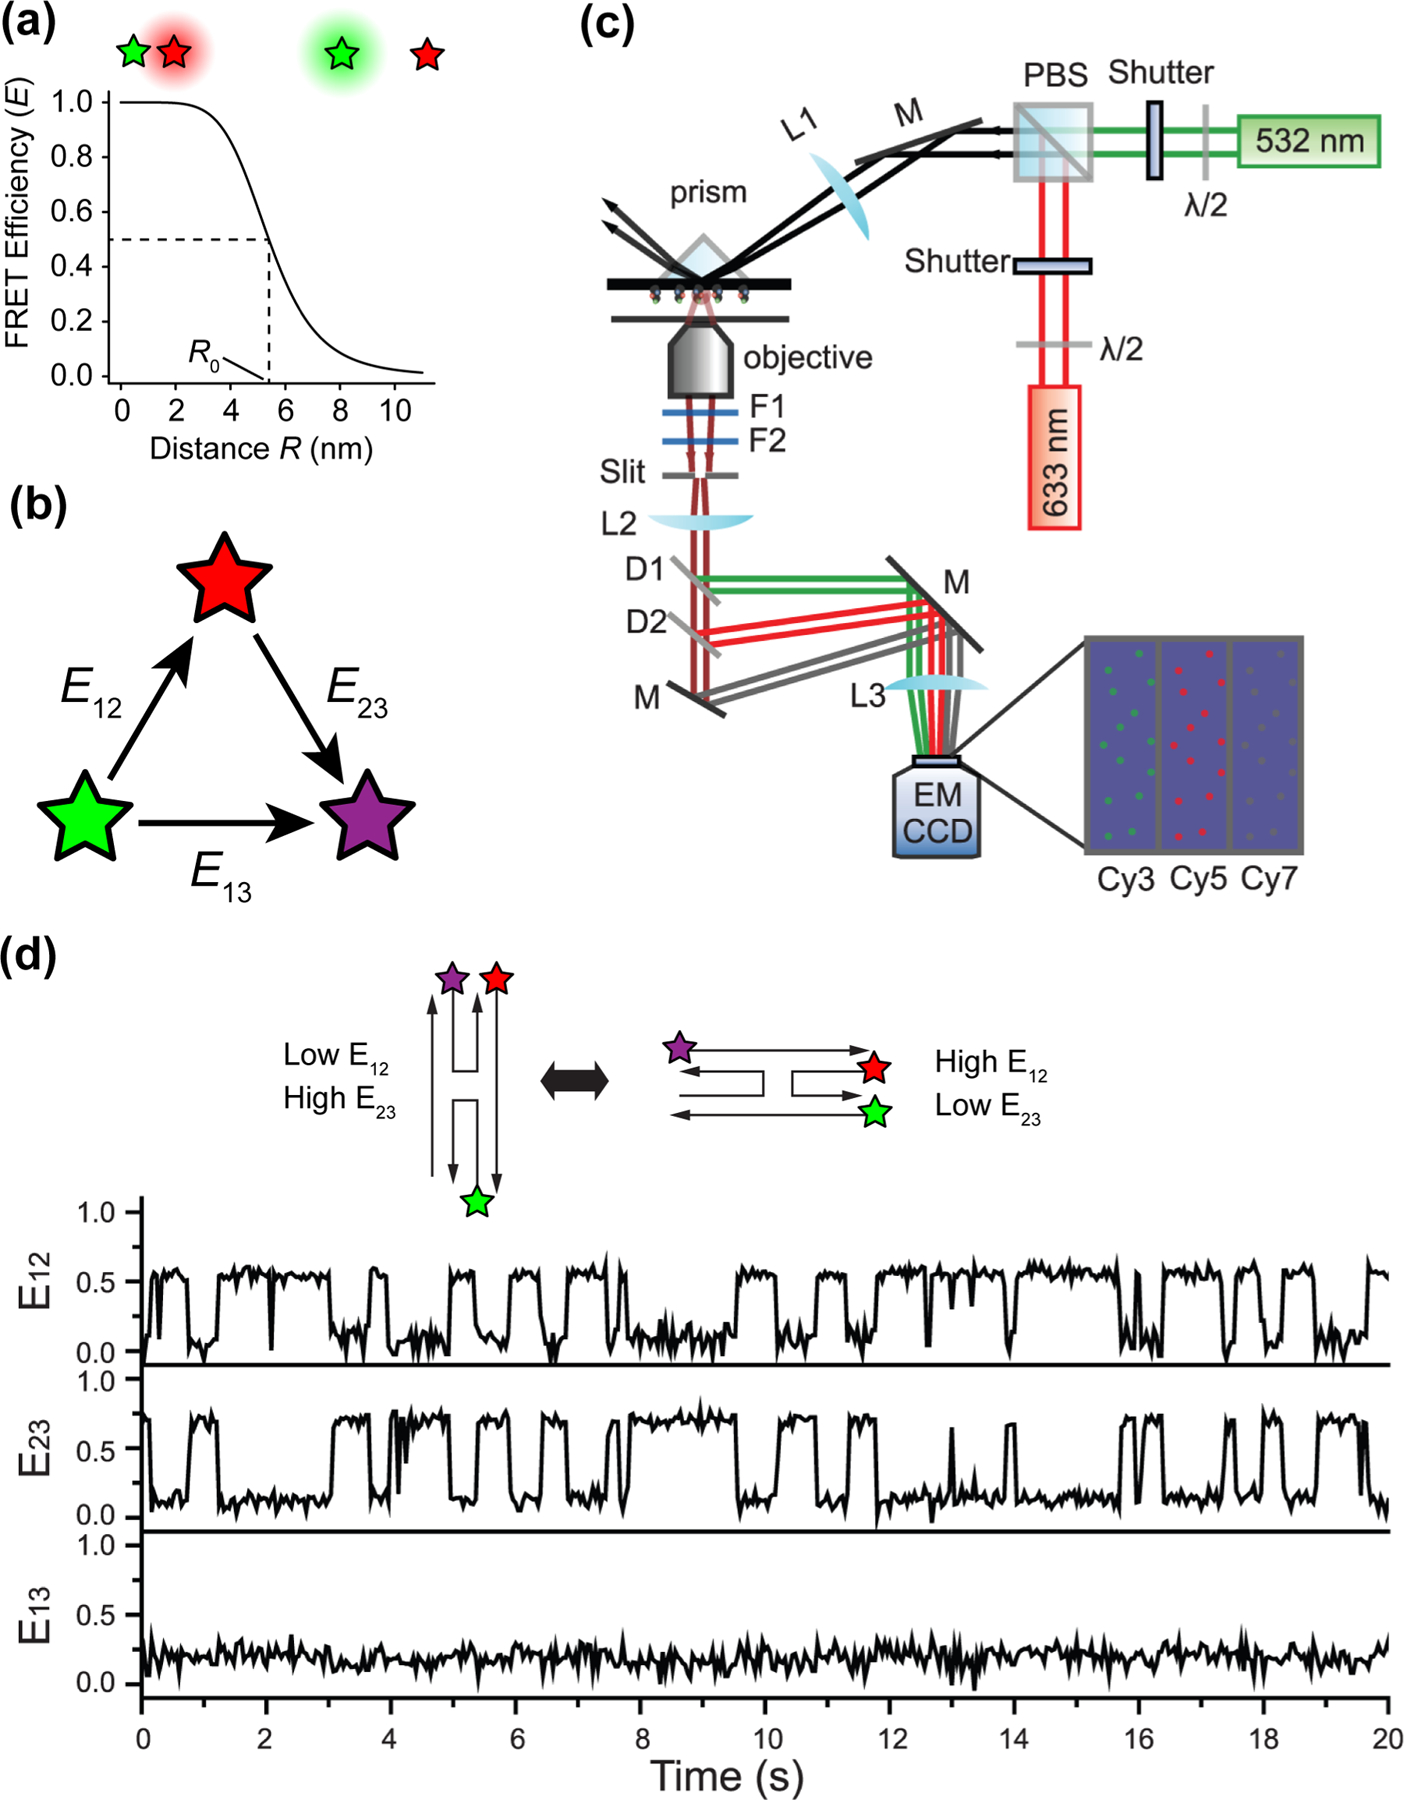
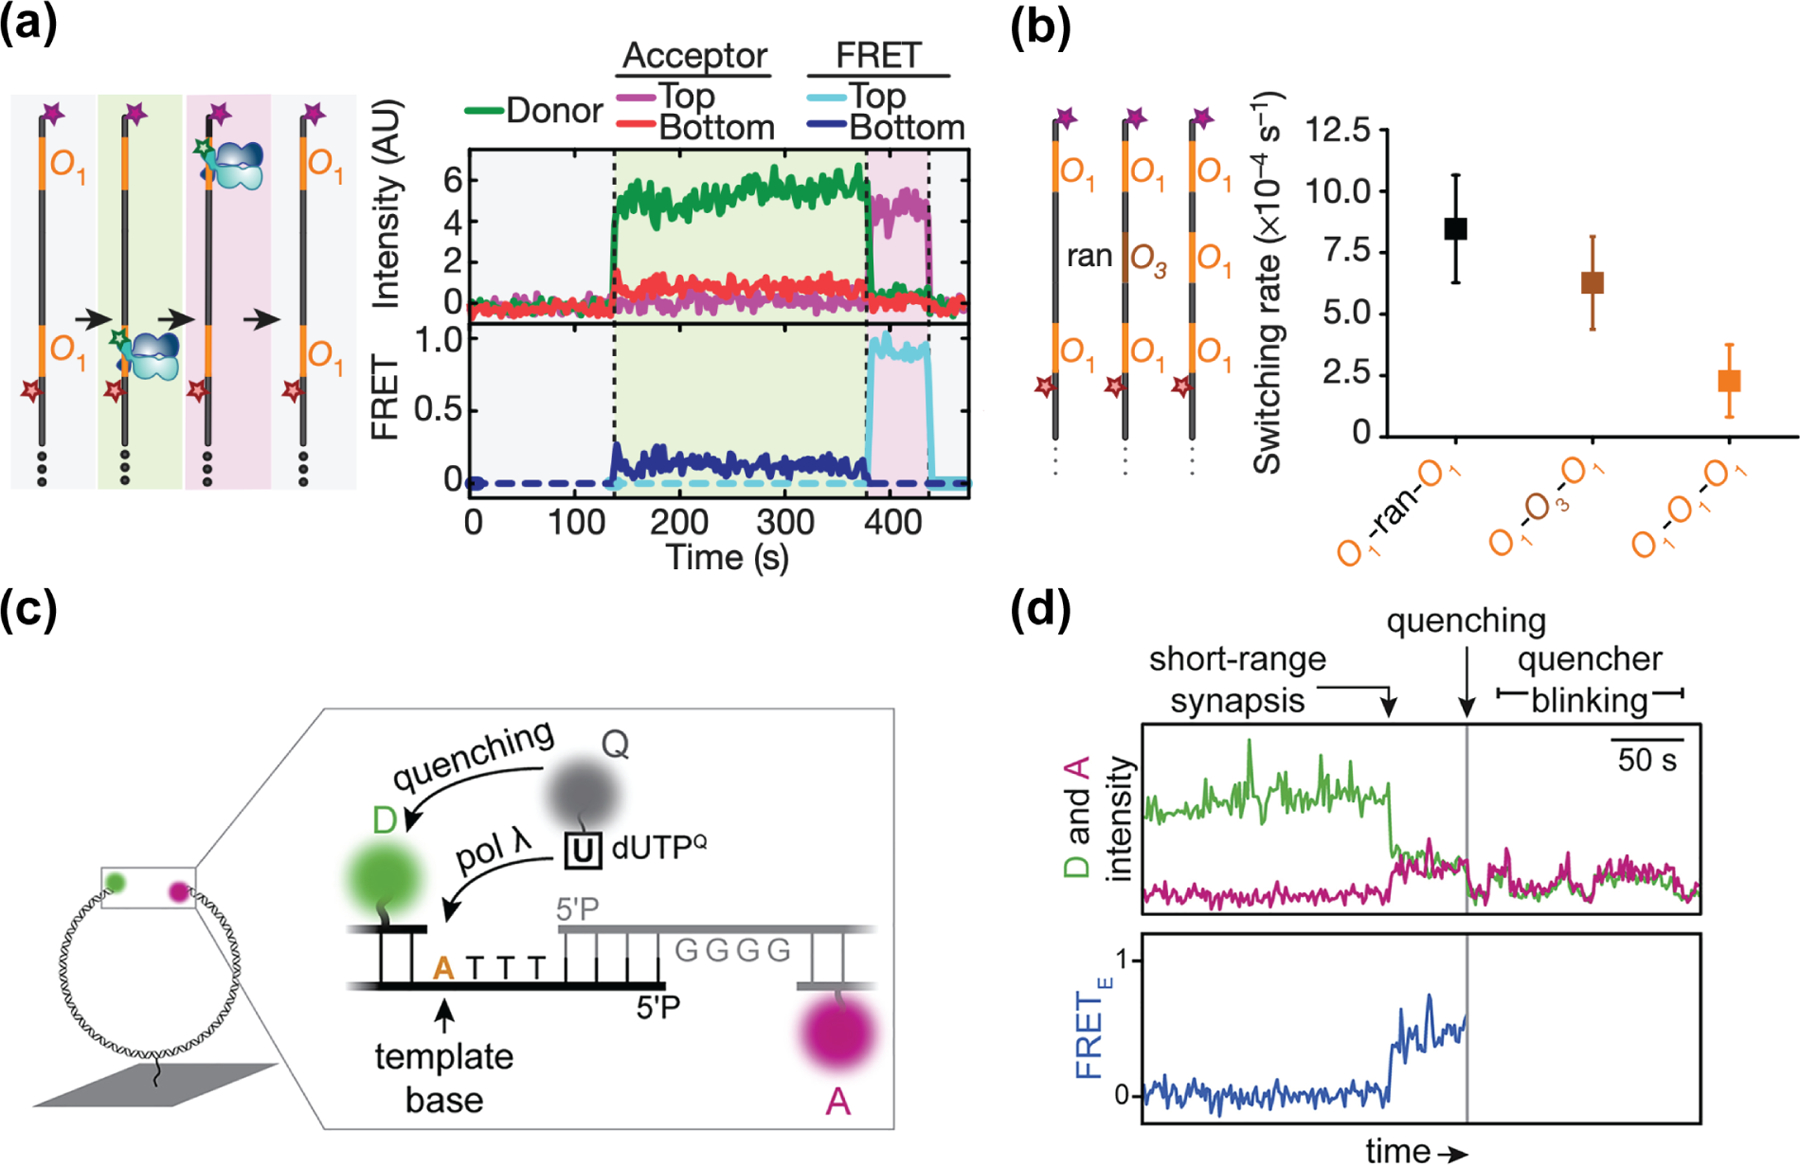
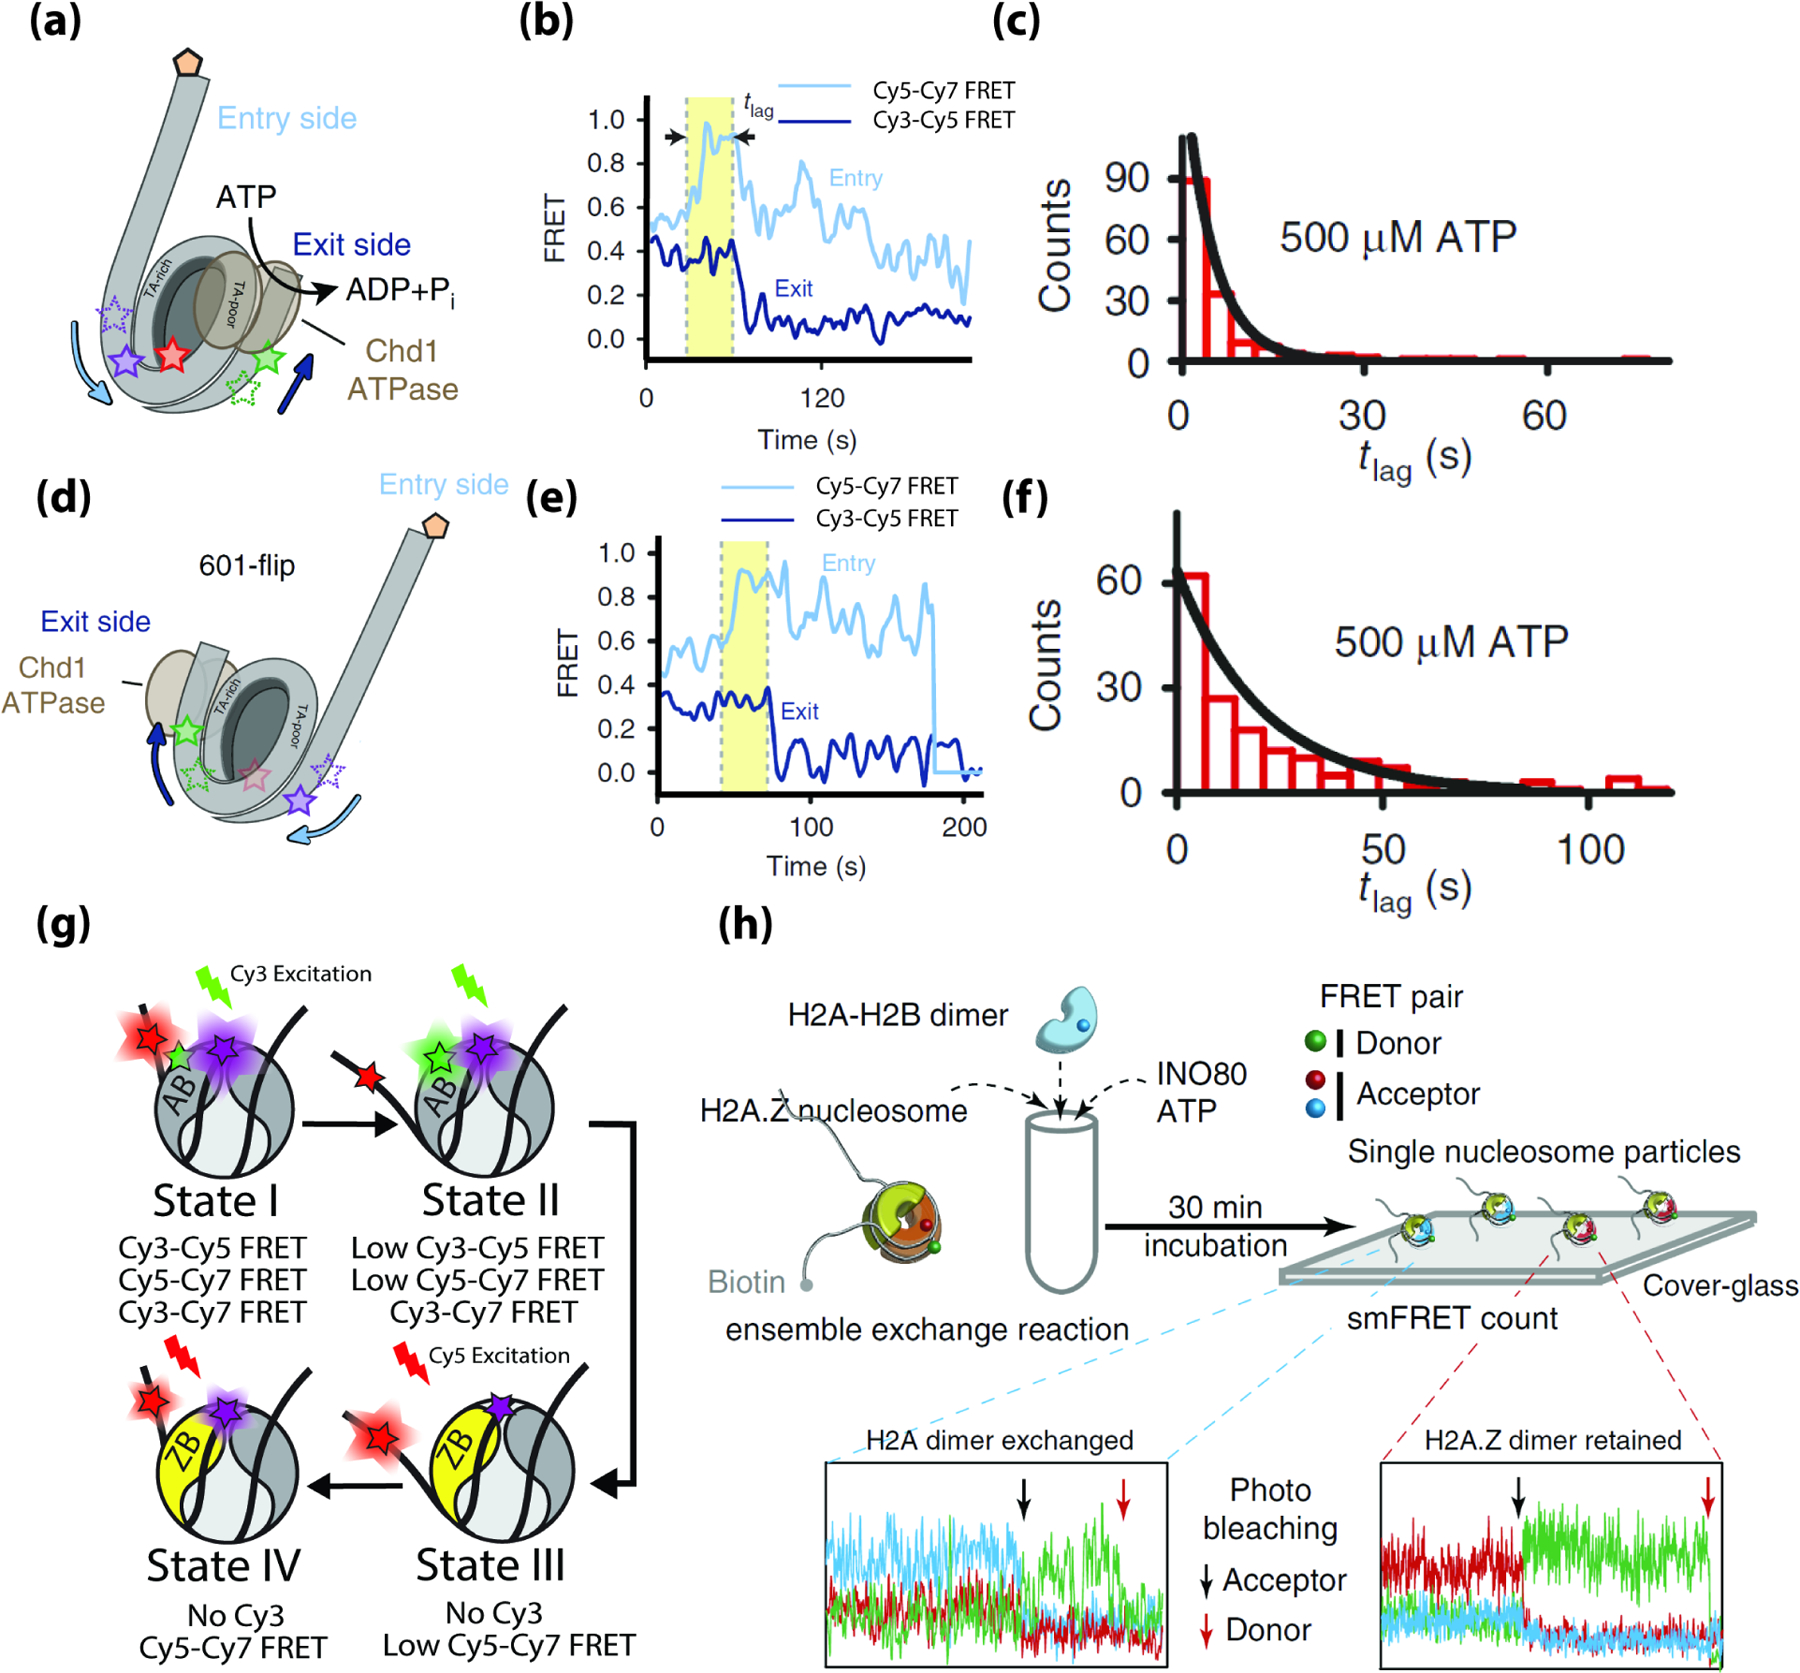
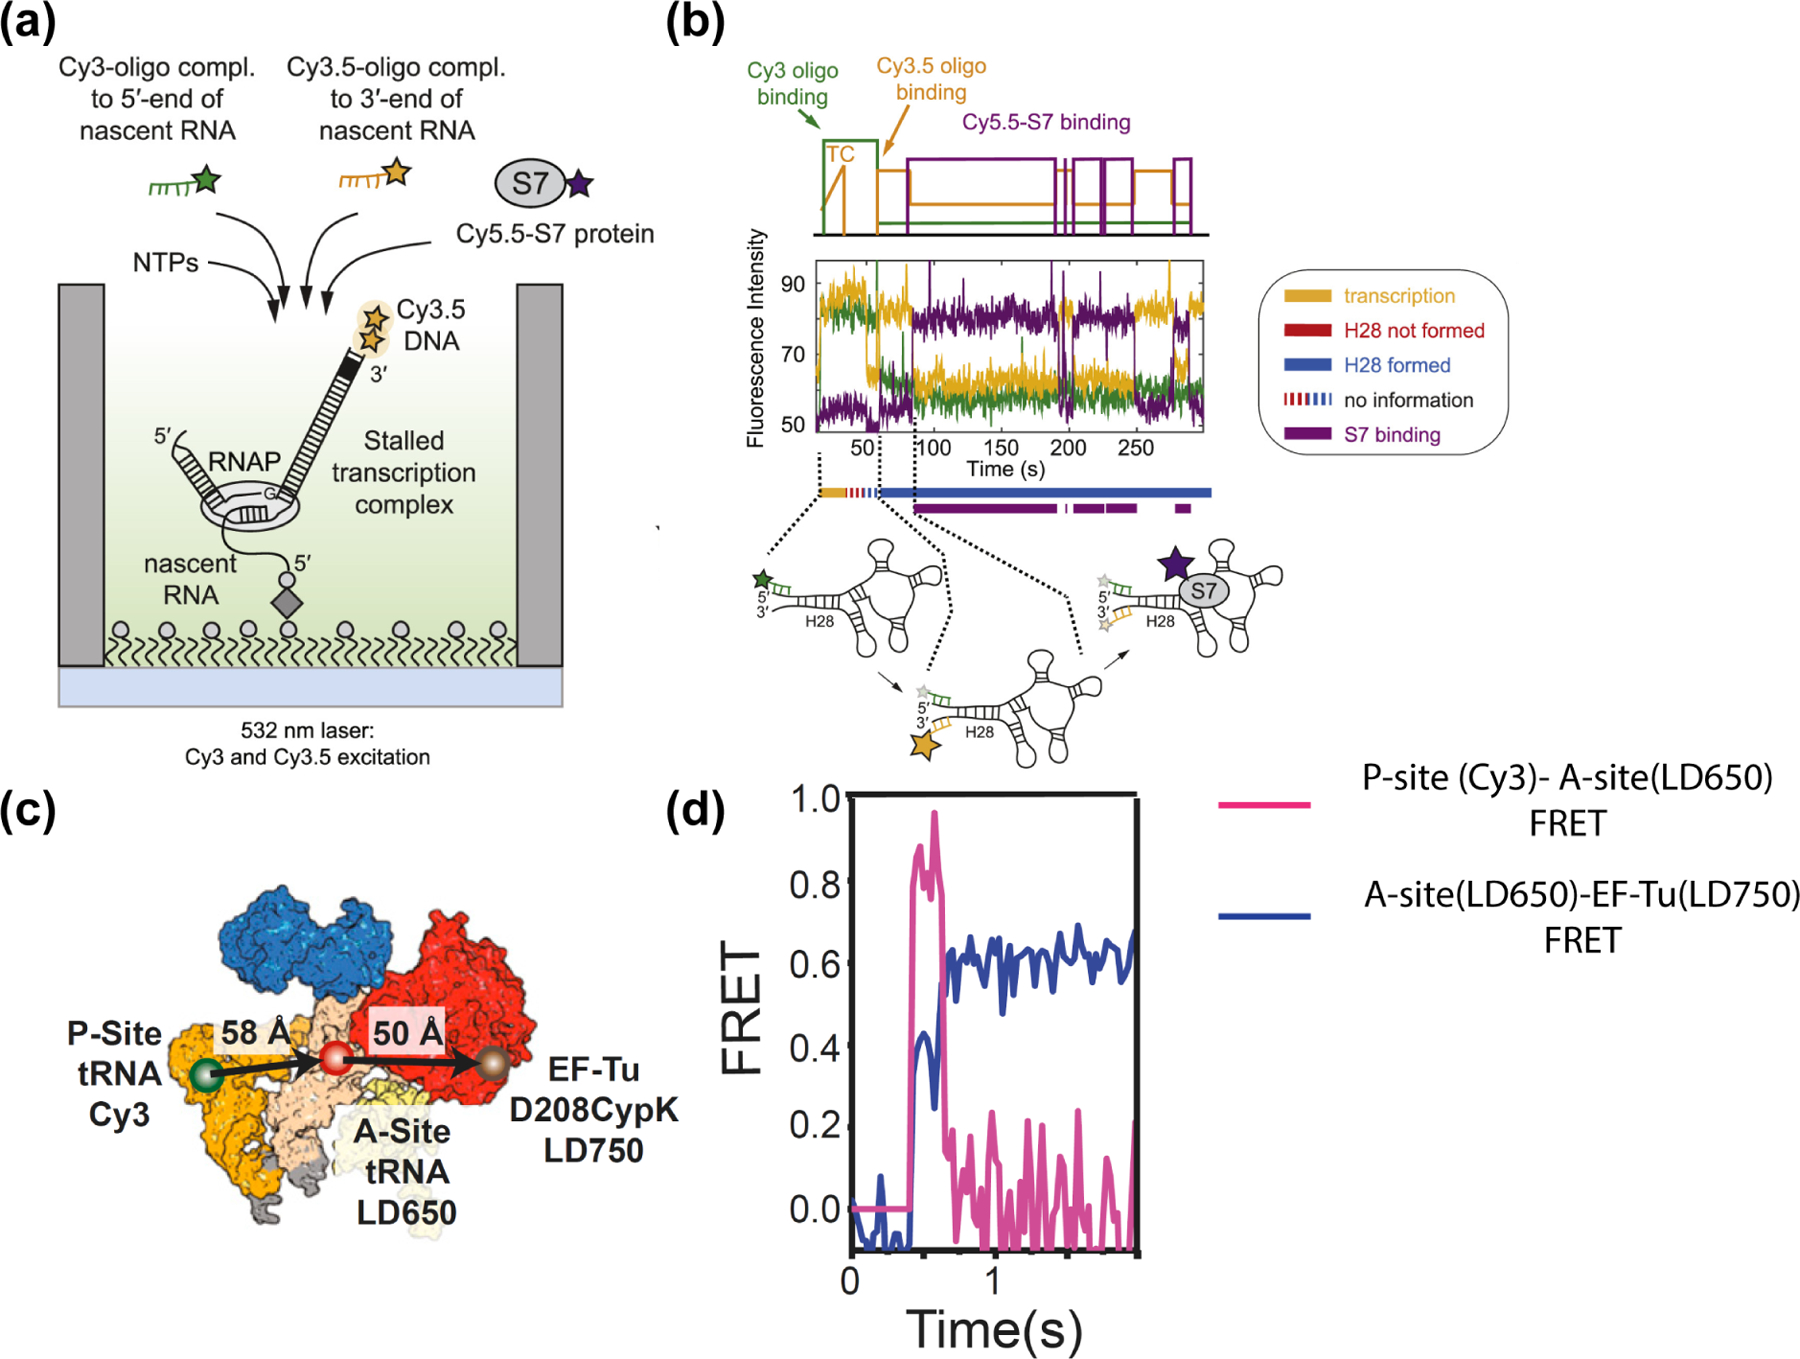
Single-molecule fluorescence resonance energy transfer (smFRET) is a useful tool for observing the dynamics of protein-nucleic acid interactions. Although most smFRET measurements have used two fluorophores, multicolor smFRET measurements using more than two fluorophores offer more information about how protein-nucleic acid complexes dynamically move, assemble, and disassemble. Multicolor smFRET experiments include three or more fluorophores and at least one donor-acceptor pair. This review highlights how multicolor smFRET is being used to probe the dynamics of three different classes of biochemical processes-protein-DNA interactions, chromatin remodeling, and protein translation.


Conflict of interest statement

Conflict of interest statement Nothing declared.

Figures

Figure 1.
Figure 1.
Multi-color single-molecule FRET. (a) Relationship between FRET efficiency and distance between FRET donor (green) and acceptor (red) fluorophores. R0 is the Forster radius, which is the distance between donor and acceptor where FRET efficiency equals 0.5. R0 = 5.4 nm for Cy3 and Cy5. (b) Directionality of energy transfer in a three-color FRET system. (c) Three-color FRET TIRF microscope setup. (d) Single-molecule traces of Holliday junction dynamics. E12, E23, and E13 refer to FRET efficiencies of the donor-acceptor pairs shown in b. (c) and (d) are adapted from Lee et al. [9].
Figure 2.
Figure 2.
Multicolor FRET studies on protein-DNA interactions. (a) Left: Cartoons depicting possible scenarios of Cy3-labeled LacI bound to DNA. The DNA contains two LacI-binding sites (O1), each site distinctly labeled with Cy5 or Cy7. Right: A set of single-molecule time traces capturing the binding of a LacI dimer onto the bottom O1 site (light green region), followed by re-localization to the top O1 site due to LacI sliding along the DNA (light purple region). (b) Left: DNA constructs with various intervening sequences between the two high-affinity O1 sites. (ran: random DNA sequence; O3: low-affinity LacI-binding site) (c) Cartoons showing the placement of fluorophores in the smFRET assay to monitor DNA orientation during NHEJ. DNA molecules are dual-labeled with Cy3 and Cy5 on each end. dUTP nucleotides are labeled with BHQ10 quencher. (d) A set of single-molecule time traces capturing the sequential steps of NHEJ, where an increase in FRET efficiency (first arrow) showing the alignment of two DNA ends is followed by the incorporation of the quencher-labeled nucleotide (grey line). (a) (b) are adapted from Marklund et al. [20]; (c) (d) are adapted from Stinson et al. [22].
Figure 3.
Figure 3.
Multi-color FRET measurements of chromatin remodeling. (a) The 3-color nucleosome construct used by Sabantsev et al. [30] (b) Example FRET time traces showing the entry side movement precedes the exit side. (c) Histogram of the lag time (tlag) between entry DNA movement and exit side movement (d) The ‘601-flip’ nucleosome construct used by Sabantsev et al. (e) Example FRET time traces showing the entry DNA movement precedes the exit DNA for the ‘601-flip’ nucleosome, consistentwith the construct in (a). (f) Histogram of the lag time (tlag) between entry DNA movement and exit side movement for the ‘601-flip’ nucleosome. (g) Cartoons depicting the four intermediate states of a canonical nucleosome undergoing H2A.Z exchange as well as their expected pair-wise FRET efficiencies. (h) Experimental scheme and representative traces to examine histone exchange by INO80 in Brahma et al. [33] (a-f) are adapted from Sabantsev et al. [30] (h) is adapted from Brahma et al. [33].
Figure 4.
Figure 4.
Multicolor smFRET studies on ribosome assembly and translation dynamics. (a) Experimental design to visualize nascent RNA folding and ribosomal protein binding on zero-mode waveguides. (b) Fluorescence time traces showing an initial gradual increase in Cy3.5 intensity due to transcription activity, presence of the Cy3-oligo complementary to the 5’ end of nascent RNA, followed by the dissociation of the RNAP-DNA complex (decrease of Cy3.5 intensity to background level), FRET between Cy3.5-oligo complementary to the 3’ end of nascent RNA and the Cy3-oligo indicates formation of the H28 helix, and subsequent gain and loss of FRET with Cy5.5-S7 protein due to S7 binding and disassociation. (c) The FRET construct used to observe EF-Tu-tRNA complex bind to a ribosomal protein complex with a tRNA in the P-site. (d) A real-time trajectory of EF-Tu-tRNA binding to the A-site of the (increase in both Cy3-LD650 and LD650-LD750 FRET), followed by subsequent unbinding of EF-Tu (LD650-LD750 FRET decrease) and the movement of the A-site tRNA into the accommodation corridor of the ribosome (Cy3-LD650 FRET decrease). (a-b) are adapted from Duss et al. [47] (c-d) are adapted from Morse et al. [51]

References

    1. Abbe E: Beiträge zur Theorie des Mikroskops und der mikrosk opischen Wahrnehmung: I. Die Construction von Mikroskopen auf Grund der Theorie. Arch für mikroskopische Anat 1873, 9:413–418.
    1. Hell SW, Wichmann J: Breaking the diffraction resolution limit by stimulated emission: stimulated-emission-depletion fluorescence microscopy. Opt Lett 1994, 19:780. - PubMed
    1. Rust MJ, Bates M, Zhuang X: Sub-diffraction-limit imaging by stochastic optical reconstruction microscopy (STORM). Nat Methods 2006, 3:793–795. - PMC - PubMed
    1. Betzig E, Patterson GH, Sougrat R, Lindwasser OW, Olenych S, Bonifacino JS, Davidson MW, Lippincott-Schwartz J, Hess HF: Imaging intracellular fluorescent proteins at nanometer resolution. Science (80- ) 2006, 313:1642–1645. - PubMed
    1. Förster T: Zwischenmolekulare Energiewanderung und Fluoreszenz. Ann Phys 1948, 437:55–75.

Publication types

LinkOut - more resources