

Which factors matter the most? Revisiting and dissecting antibody therapeutic doses
- PMID: 33895315
- PMCID: PMC8410626
- DOI: 10.1016/j.drudis.2021.04.022
Which factors matter the most? Revisiting and dissecting antibody therapeutic doses
Abstract
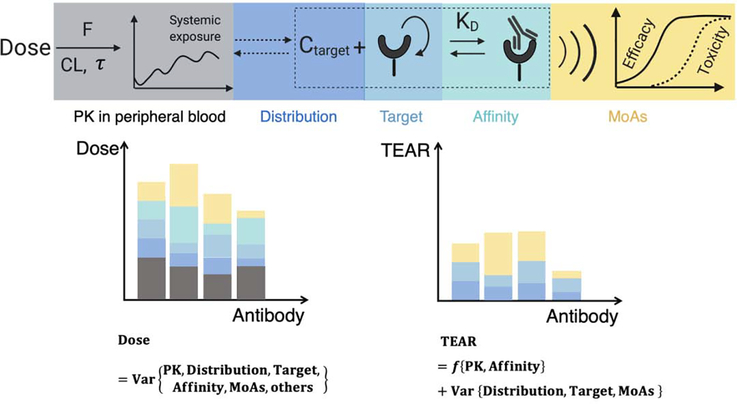
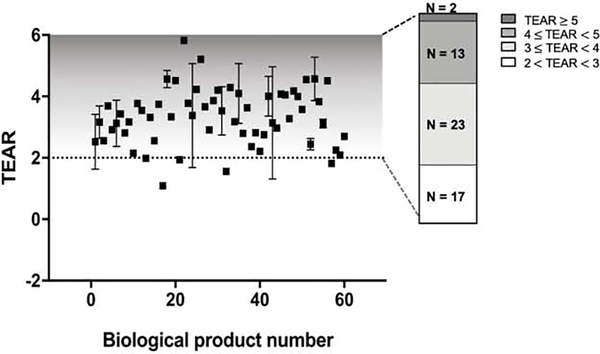
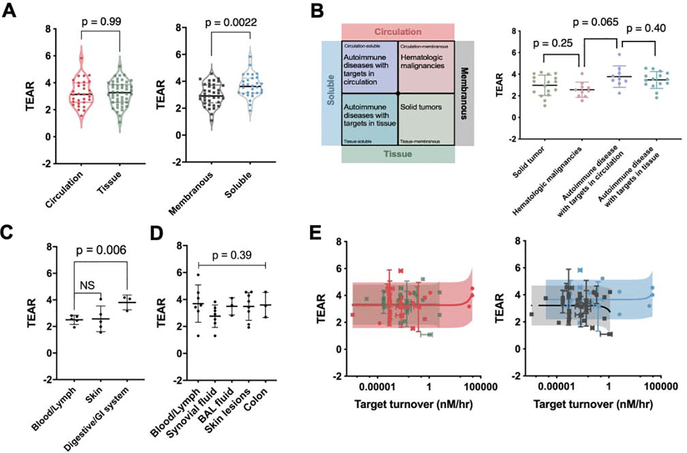
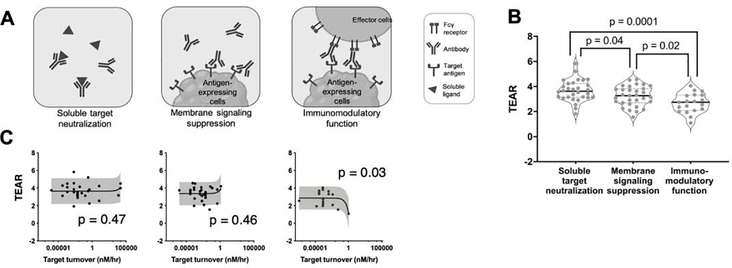
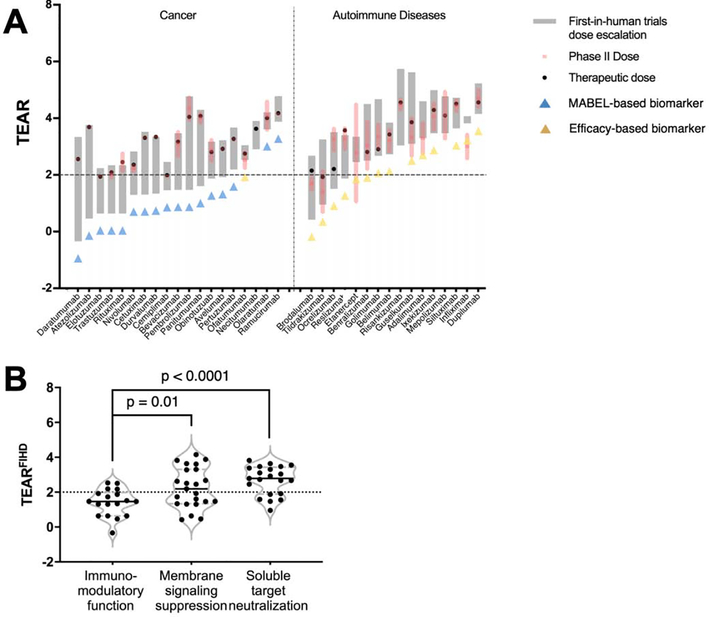
Factors such as antibody clearance and target affinity can influence antibodies' effective doses for specific indications. However, these factors vary considerably across antibody classes, precluding direct and quantitative comparisons. Here, we apply a dimensionless metric, the therapeutic exposure affinity ratio (TEAR), which normalizes the therapeutic doses by antibody bioavailability, systemic clearance and target-binding property to enable direct and quantitative comparisons of therapeutic doses. Using TEAR, we revisited and dissected the doses of up to 60 approved antibodies. We failed to detect a significant influence of target baselines, turnovers or anatomical locations on antibody therapeutic doses, challenging the traditional perceptions. We highlight the importance of antibodies' modes of action for therapeutic doses and dose selections; antibodies that work through neutralizing soluble targets show higher TEARs than those working through other mechanisms. Overall, our analysis provides insights into the factors that influence antibody doses, and the factors that are crucial for antibodies' pharmacological effects.
Copyright © 2021 Elsevier Ltd. All rights reserved.
Conflict of interest statement
Declaration of Competing Interest The authors declare that they have no known competing financial interests or personal relationships that could have appeared to influence the work reported in this paper.
Figures
Similar articles
-
AFIR: A Dimensionless Potency Metric for Characterizing the Activity of Monoclonal Antibodies.CPT Pharmacometrics Syst Pharmacol. 2017 Apr;6(4):258-266. doi: 10.1002/psp4.12169. Epub 2017 Apr 4. CPT Pharmacometrics Syst Pharmacol. 2017. PMID: 28375563 Free PMC article.
-
Pharmacokinetics of Tildrakizumab (MK-3222), an Anti-IL-23 Monoclonal Antibody, After Intravenous or Subcutaneous Administration in Healthy Subjects.Basic Clin Pharmacol Toxicol. 2018 Sep;123(3):294-300. doi: 10.1111/bcpt.13001. Epub 2018 Apr 20. Basic Clin Pharmacol Toxicol. 2018. PMID: 29510001 Clinical Trial.
-
Agonistic TAM-163 antibody targeting tyrosine kinase receptor-B: applying mechanistic modeling to enable preclinical to clinical translation and guide clinical trial design.MAbs. 2013 May-Jun;5(3):373-83. doi: 10.4161/mabs.23826. Epub 2013 Mar 25. MAbs. 2013. PMID: 23529133 Free PMC article.
-
Development of therapeutic antibodies to G protein-coupled receptors and ion channels: Opportunities, challenges and their therapeutic potential in respiratory diseases.Pharmacol Ther. 2017 Jan;169:113-123. doi: 10.1016/j.pharmthera.2016.04.013. Epub 2016 May 3. Pharmacol Ther. 2017. PMID: 27153991 Review.
-
Factors influencing the choice of monoclonal antibodies for antibody-drug conjugates.Drug Discov Today. 2022 Jan;27(1):354-361. doi: 10.1016/j.drudis.2021.09.015. Epub 2021 Sep 28. Drug Discov Today. 2022. PMID: 34597756 Review.
Cited by
-
Advancing cancer drug development with mechanistic mathematical modeling: bridging the gap between theory and practice.J Pharmacokinet Pharmacodyn. 2024 Dec;51(6):581-604. doi: 10.1007/s10928-024-09930-x. Epub 2024 Jun 21. J Pharmacokinet Pharmacodyn. 2024. PMID: 38904912 Free PMC article. Review.
-
Navigating large-volume subcutaneous injections of biopharmaceuticals: a systematic review of clinical pipelines and approved products.MAbs. 2024 Jan-Dec;16(1):2402713. doi: 10.1080/19420862.2024.2402713. Epub 2024 Sep 15. MAbs. 2024. PMID: 39279181 Free PMC article.
-
Clearance as an Early Indicator of Efficacy for Therapeutic Monoclonal Antibodies: Circumventing Dose Selection Challenges in Oncology.Clin Pharmacokinet. 2023 May;62(5):705-713. doi: 10.1007/s40262-023-01231-9. Epub 2023 Mar 17. Clin Pharmacokinet. 2023. PMID: 36930421 Clinical Trial.
-
Review of the Existing Translational Pharmacokinetics Modeling Approaches Specific to Monoclonal Antibodies (mAbs) to Support the First-In-Human (FIH) Dose Selection.Int J Mol Sci. 2022 Oct 22;23(21):12754. doi: 10.3390/ijms232112754. Int J Mol Sci. 2022. PMID: 36361546 Free PMC article. Review.
-
Rat as a Predictive Model for Human Clearance and Bioavailability of Monoclonal Antibodies.Antibodies (Basel). 2024 Dec 24;14(1):2. doi: 10.3390/antib14010002. Antibodies (Basel). 2024. PMID: 39846610 Free PMC article.
References
-
- Carter PJ and Lazar GA (2018) Next generation antibody drugs: pursuit of the ‘high-hanging fruit’. Nat. Rev. Drug Discov 17, 197–223 - PubMed
-
- Mould DR and Meibohm B (2016) Drug development of therapeutic monoclonal antibodies. BioDrugs 30, 275–293 - PubMed
-
- Zhao X et al. (2020) Model-based evaluation of the efficacy and safety of nivolumab once every 4 weeks across multiple tumor types. Ann. Oncol 31, 302–309 - PubMed
Publication types
MeSH terms
Substances
Grants and funding
LinkOut - more resources
Full Text Sources
Other Literature Sources
