. 2021 Jun 15:241:104236.
doi: 10.1016/j.jprot.2021.104236. Epub 2021 Apr 22.

Proteomic profiling of soft tissue sarcomas with SWATH mass spectrometry

Affiliations

Proteomic profiling of soft tissue sarcomas with SWATH mass spectrometry

Martina Milighetti et al. J Proteomics. .

Abstract

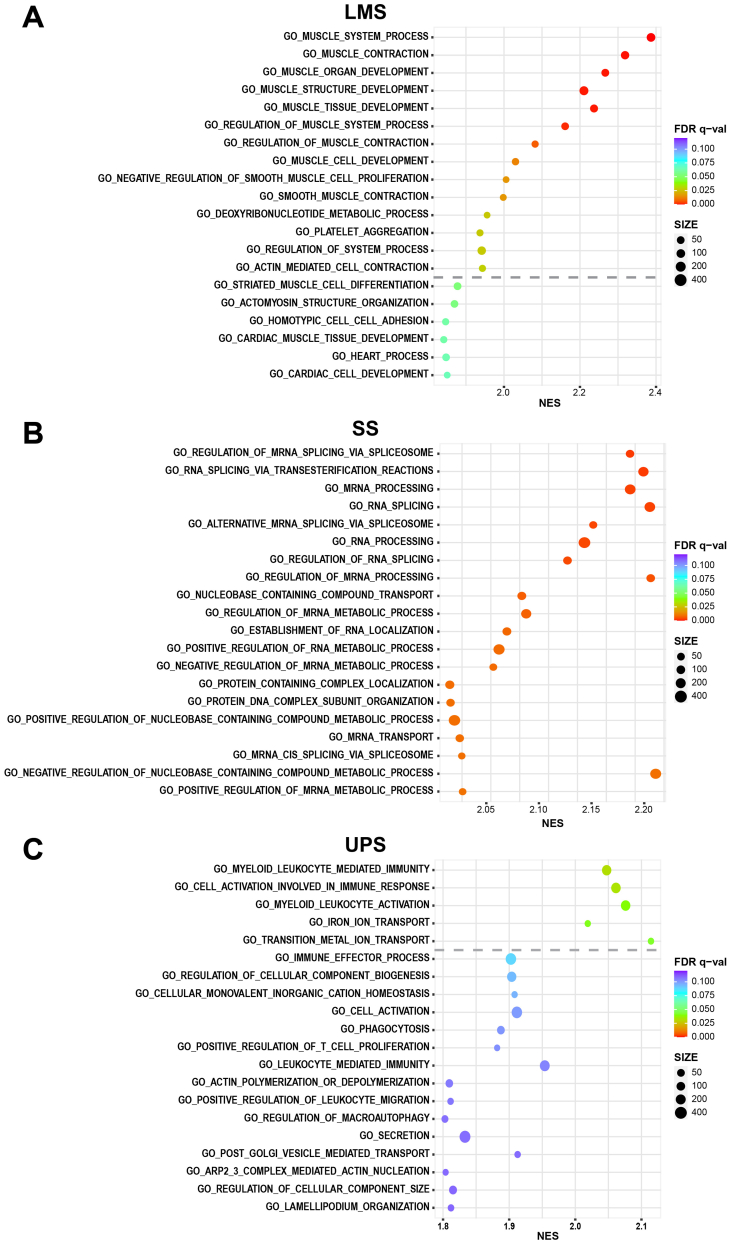
Soft tissue sarcomas (STS) are a group of rare and heterogeneous cancers. While large-scale genomic and epigenomic profiling of STS have been undertaken, proteomic analysis has thus far been limited. Here we utilise sequential window acquisition of all theoretical fragment ion spectra mass spectrometry (SWATH-MS) for proteomic profiling of formalin fixed paraffin embedded (FFPE) specimens from a cohort of STS patients (n = 36) across four histological subtypes (leiomyosarcoma, synovial sarcoma, undifferentiated pleomorphic sarcoma and dedifferentiated liposarcoma). We quantified 2951 proteins across all cases and show that there is a significant enrichment of gene sets associated with smooth muscle contraction in leiomyosarcoma, RNA splicing regulation in synovial sarcoma and leukocyte activation in undifferentiated pleomorphic sarcoma. We further identified a subgroup of STS cases that have a distinct expression profile in a panel of proteins, with worse survival outcomes when compared to the rest of the cohort. Our study highlights the value of comprehensive proteomic characterisation as a means to identify histotype-specific STS profiles that describe key biological pathways of clinical and therapeutic relevance; as well as for discovering new prognostic biomarkers in this group of rare and difficult-to-treat diseases.

Keywords: Biomarkers; FFPE; Mass spectrometry; Proteomics; SWATH MS; Soft tissue sarcoma.


Conflict of interest statement

The authors declare that they have no competing interests.

Figures

Unlabelled Image
Graphical abstract
Fig. 1
Fig. 1
Schematic of the experimental workflow highlighting the key steps that were undertaken for sample selection and preparation as well as SWATH-MS data acquisition and analysis.
Fig. 2
Fig. 2
(A) Hierarchical clustering of 2951 proteins across 36 STS cases. The full list of proteins is listed in Table S1. (B) 3D-tSNE plot depicts four distinct groups of STS cases corresponding to the distinct histological subtypes. LMS is leiomyosarcoma, SS is synovial sarcoma, UPS is undifferentiated pleomorphic sarcoma and DDLPS is dedifferentiated liposarcoma.
Fig. 3
Fig. 3
Plot of Gene Set Enrichment Analysis results showing the top ranked 20 positively enriched gene sets for (A) leiomyosarcoma (LMS), (B) synovial sarcoma (SS) and (C) undifferentiated pleomorphic sarcoma (UPS). The dashed line indicates a False Discovery Rate (FDR) = 0.05 threshold. The colour of the circles represents the FDR q-value while the size of the circle indicates the number of proteins within the dataset that is in each gene set. NES is the normalised enrichment score from the GSEA analysis.
Fig. 4
Fig. 4
Network diagrams in Force Atlas layouts depicting protein-protein interaction maps for proteins which are significantly upregulated in (A) leiomyosarcoma and (B) synovial sarcoma. In (A), proteins in blue are components involved in the regulation of smooth muscle contraction while those in purple are components of the matrisome and adhesome. In (B), the majority of significantly upregulated proteins in synovial sarcoma are involved in RNA splicing regulation and the different colours indicate the number of interactions between identified proteins. (For interpretation of the references to colour in this figure legend, the reader is referred to the web version of this article.)
Fig. 5
Fig. 5
(A) Volcano plot of the beta coefficients from univariable Cox regression analysis for each of the 2951 proteins in the proteomic dataset and their associated –log p-value. Red circles indicate 133 proteins with p < 0.05. The full list of proteins is listed in Table S3. (B) Hierarchical clustering of 133 proteins across 36 STS cases identifies 3 subgroups of mixed histological subtypes. (C) The Kaplan Meier curves for overall survival (OS) of the 3 subgroups identified in (B). LMS is leiomyosarcoma, SS is synovial sarcoma, UPS is undifferentiated pleomorphic sarcoma and DDLPS is dedifferentiated liposarcoma. (For interpretation of the references to colour in this figure legend, the reader is referred to the web version of this article.)
Fig. 6
Fig. 6
Comparison of expression profile of (A) vinculin and (B) decorin analysed by SWATH-MS (SWATH) with immunohistochemical (IHC) staining of TMA cores generated from the same tissue specimens in the cohort. Boxplots for SWATH-MS data shows 1st quartile, 3rd quartile and median value for each subtype, whiskers indicate interquartile range. Stacked bar charts indicate immunoreactivity of cases in each of the sarcoma subtypes. Photomicrographs of representative TMA cores with strong, weak and no staining for both proteins are shown.
Supplementary Figure S1
(A) Hierarchical clustering of 277 proteins that were found to be significantly differentially expressed across the four histotypes by multiclass Significance Analysis of Microarray (SAM) method (FDR <0.1%) across 36 STS cases. The full list of proteins is listed in Table S2. LMS is leiomyosarcoma, SS is synovial sarcoma, UPS is undifferentiated pleomorphic sarcoma and DDLPS is dedifferentiated liposarcoma.
Supplementary Figure S2
Boxplots comparing expression profile of MYH11 between reverse phase protein array (RPPA) dataset from the TCGA-SARC study and SWATH-MS dataset (SWATH) across 4 sarcoma subtypes. Boxplots shows 1st quartile, 3rd quartile and median value for each subtype, whiskers indicate interquartile range. Outliers are indicated by circle. Statistical significance is indicated by an asterisk where: * p < 0.05; ** p < 0.01; *** p < 0.001; **** p < 0.0001.

References

    1. WHO . 5th ed. World Health Organization; 2020. Classification of Tumours Editorial Board, Soft Tissue and Bone Tumours.
    1. Beck A.H., West R.B., van de Rijn M. Gene expression profiling for the investigation of soft tissue sarcoma pathogenesis and the identification of diagnostic, prognostic, and predictive biomarkers. Virchows Arch. 2010;456(2):141–151. - PMC - PubMed
    1. e.d.s.c. Cancer Genome Atlas Research Network. Electronic address, N Cancer genome atlas research, comprehensive and integrated genomic characterization of adult soft tissue sarcomas. Cell. 2017;171(4):950–965. e28. - PMC - PubMed
    1. Chudasama P., Mughal S.S., Sanders M.A., Hubschmann D., Chung I., Deeg K.I., Wong S.H., Rabe S., Hlevnjak M., Zapatka M., Ernst A., Kleinheinz K., Schlesner M., Sieverling L., Klink B., Schrock E., Hoogenboezem R.M., Kasper B., Heilig C.E., Egerer G., Wolf S., von Kalle C., Eils R., Stenzinger A., Weichert W., Glimm H., Groschel S., Kopp H.G., Omlor G., Lehner B., Bauer S., Schimmack S., Ulrich A., Mechtersheimer G., Rippe K., Brors B., Hutter B., Renner M., Hohenberger P., Scholl C., Frohling S. Integrative genomic and transcriptomic analysis of leiomyosarcoma. Nat. Commun. 2018;9(1):144. - PMC - PubMed
    1. Le Guellec S., Lesluyes T., Sarot E., Valle C., Filleron T., Rochaix P., Valentin T., Perot G., Coindre J.M., Chibon F. Validation of the Complexity INdex in SARComas prognostic signature on formalin-fixed, paraffin-embedded, soft-tissue sarcomas. Ann. Oncol. 2018;29(8):1828–1835. - PubMed

Publication types