. 2021 Jul:43:101979.
doi: 10.1016/j.redox.2021.101979. Epub 2021 Apr 17.

BMP4-mediated browning of perivascular adipose tissue governs an anti-inflammatory program and prevents atherosclerosis

Affiliations

BMP4-mediated browning of perivascular adipose tissue governs an anti-inflammatory program and prevents atherosclerosis

Wenjuan Mu et al. Redox Biol. 2021 Jul.

Abstract

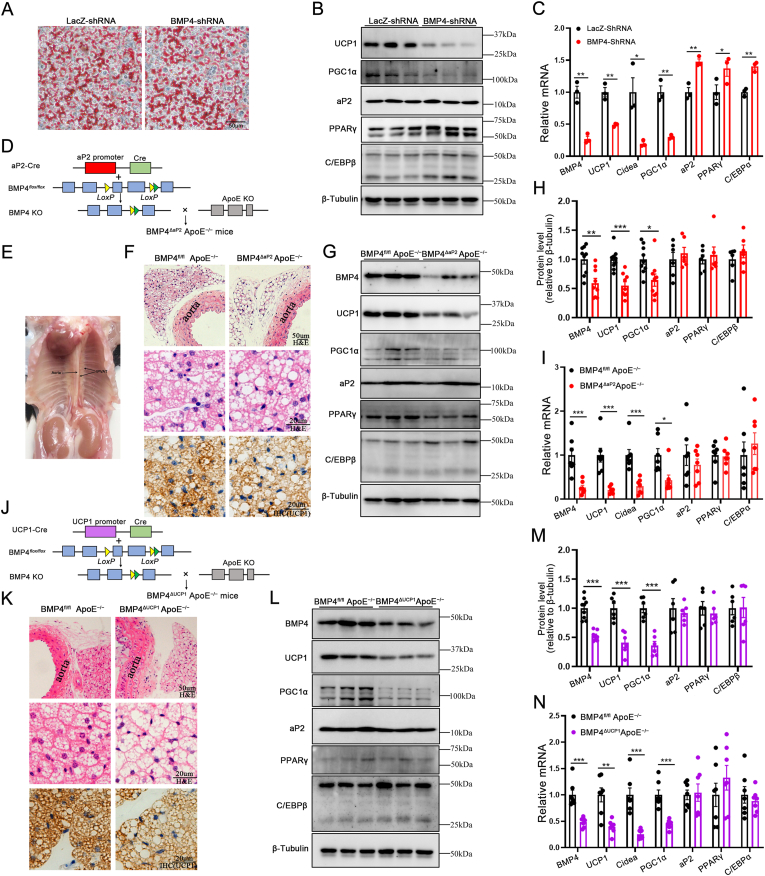
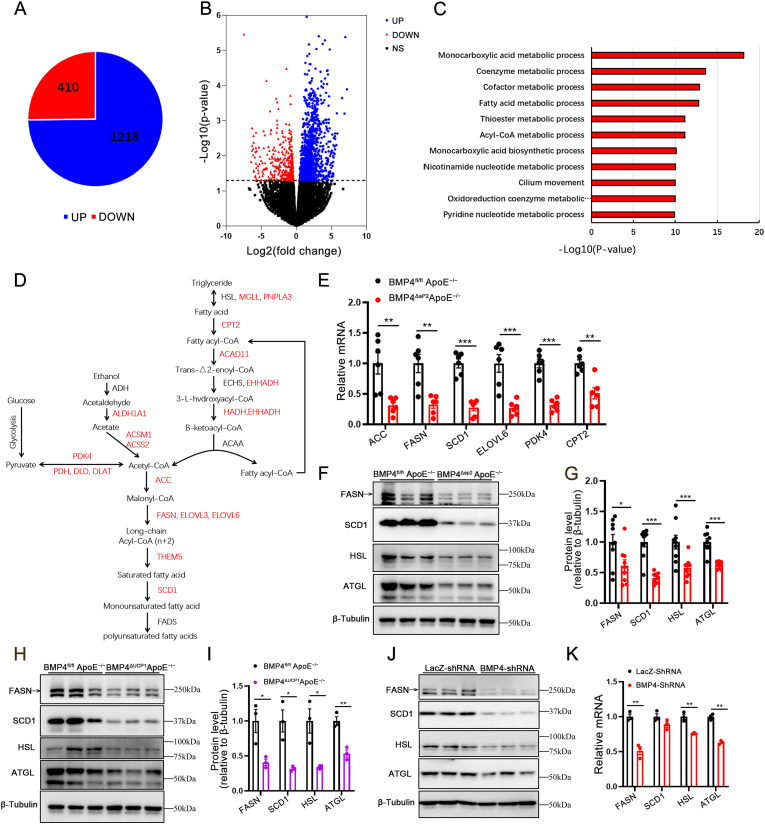
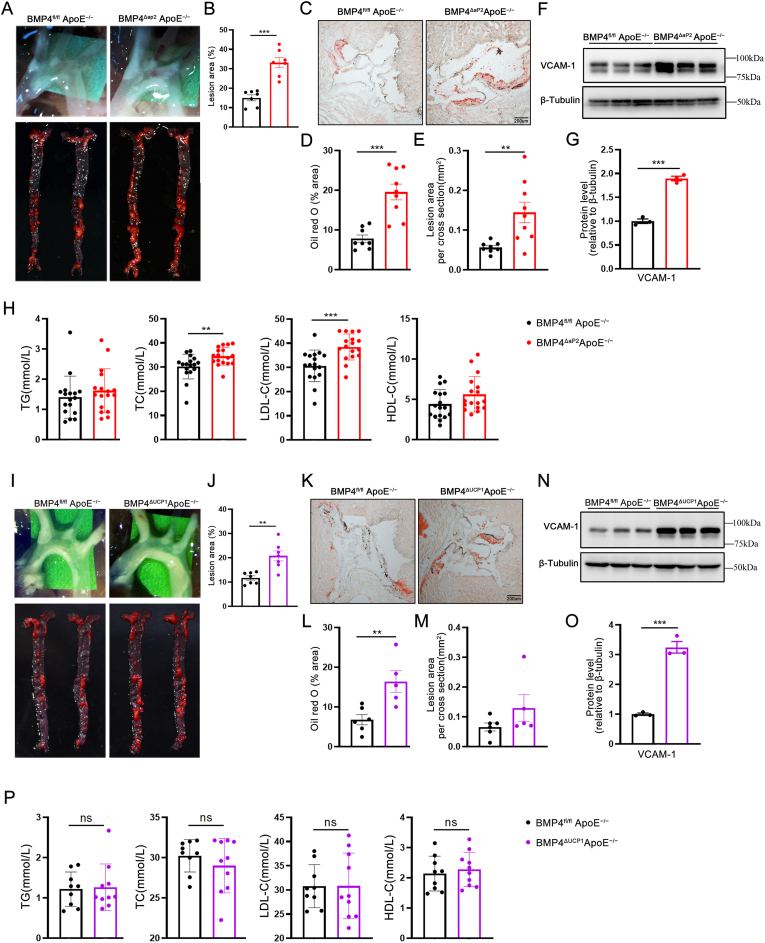
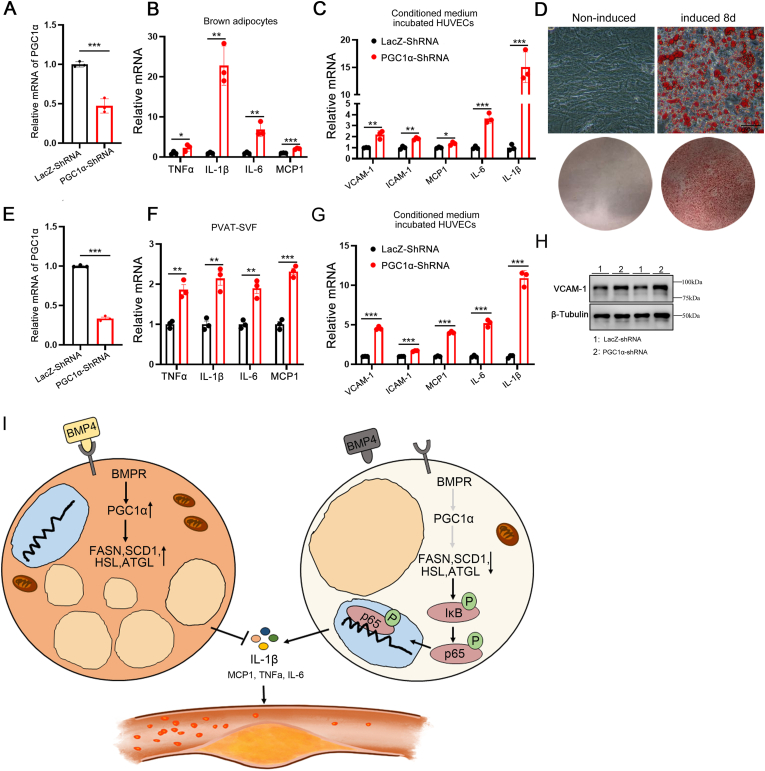
Loss of perivascular adipose tissue (PVAT) impairs endothelial function and enhances atherosclerosis. However, the roles of PVAT thermoregulation in vascular inflammation and the development of atherosclerosis remains unclear. Bone morphogenetic protein 4 (BMP4) transforms white adipocyte to beige adipocyte, while promotes a brown-to-white shift in inter-scapular brown adipose tissue (BAT). Here, we found that knockdown of BMP4 in PVAT reduced expression of brown adipocyte-characteristic genes and increased endothelial inflammation in vitro co-culture system. Ablating BMP4 expression either in adipose tissues or specifically in BAT in ApoE-/- mice demonstrated a marked exacerbation of atherosclerotic plaque formation in vivo. We further demonstrated that proinflammatory factors (especially IL-1β) increased in the supernatant of BMP4 knockdown adipocytes. Overexpression of BMP4 in adipose tissues promotes browning of PVAT and protects against atherosclerosis in ApoE-/- mice. These findings uncover an organ crosstalk between PVAT and blood endothelial cells that is engaged in atherosclerosis.

Keywords: Atherosclerosis; Browning; Inflammation; Lipid metabolism; Perivascular adipose tissue.


Conflict of interest statement

All authors declare that there are no conflicts of interest.

Figures

Image 1
Graphical abstract
Fig. 1
Fig. 1
Interaction between BMP4, PVAT metabolism and CAD. (A)Western blot analysis and quantification (B) of UCP1 and BMP4 expression in different adipose tissues (n = 3). (C) Relative mRNA levels of UCP1 and BMP4 were measured by qPCR. (n = 9). (D) Representative images corresponding to en face Oil Red O staining of the atherosclerotic lesion of whole aortas from WT and ApoE−/− mice. (E) Western blot analysis and quantification (F) of UCP1, PGC1α and BMP4 in PVAT of WT or ApoE−/− mice. (G) Relative mRNA levels of BMP4 UCP1, Cidea and PGC1α were measured by qPCR. (n = 3). (H) Correlation analysis of co-expression of BMP4 and UCP1 in human SAT, EAT and PAT. (I) Correlation analysis of co-expression of BMP4 and brown-related genes (PGC1α, Cidea, PRDM16) in human SAT, EAT and PAT. (J) Relative mRNA levels of BMP4 were determined in PAT and EAT of patients with coronary artery diseases (CAD) or those without. Values are means ± S.E.M. *P < 0.05, **P < 0.01, ***P < 0.001 by unpaired Student's t-test (F, G and J) or one-way analysis of variance (ANOVA) (B and C). Pearson's correlations between BMP4, and brown-related genes were calculated. (For interpretation of the references to colour in this figure legend, the reader is referred to the Web version of this article.)
Fig. 2
Fig. 2
Absence of BMP4 in PVAT produces a white-like phenotype. (A) Oil Red O staining of adipocytes differentiated from brown preadipocytes on day 8. (B) Western blot analysis of UCP1, Cidea, PGC1α, aP2, PPARγ and C/EBPβ in brown adipocytes with LacZ knockdown or BMP4 knockdown. (C) Relative mRNA levels of BMP4, UCP1, Cidea, PGC1α, aP2, PPARγ and C/EBPα in brown adipocytes with LacZ knockdown or BMP4 knockdown. (D)Schema of FABP4/aP2-Cre-BMP4flox/flox mouse models. (E) Gross picture of adult mouse thoracic aortic PVAT. (F) Representative HE and IHC(UCP1) microscopic picture of PVAT isolated from BMP4fl/fl ApoE−/− and BMP4ΔaP2 ApoE−/− mice fed with WD for 16 weeks. (G) Western blot analysis and quantification (H) of BMP4, UCP1 PGC1α, aP2, PPARγ and C/EBPβ in PVAT of BMP4fl/fl ApoE−/− and BMP4ΔaP2 ApoE−/− mice fed with WD for 16 weeks (n = 6–9). (I) Relative mRNA levels of BMP4, UCP1, Cidea, PGC1α, aP2, PPARγ and C/EBPα in PVAT of BMP4fl/fl ApoE−/− and BMP4ΔaP2 ApoE−/− mice fed with WD for 16 weeks (n = 7). (J) Schema of UCP1-Cre-BMP4flox/flox mouse models. (K) Representative HE and IHC(UCP1) microscopic picture of PVAT isolated from BMP4fl/fl ApoE−/− and BMP4ΔUCP1 ApoE−/− mice fed with WD for 16 weeks. (L) Western blot analysis and quantification (M) of BMP4, UCP1, Cidea, PGC1α, aP2, PPARγ and C/EBPβ in PVAT of BMP4fl/fl ApoE−/− and BMP4ΔUCP1 ApoE−/− mice fed with WD for 16 weeks (n = 6–9). (N) Relative mRNA levels of BMP4, UCP1, Cidea, PGC1α, aP2, PPARγ and C/EBPα in PVAT of BMP4fl/fl ApoE−/− and BMP4ΔUCP1 ApoE−/− mice fed with WD for 16 weeks (n = 7). Values are means ± S.E.M. *P < 0.05, **P < 0.01, ***P < 0.001 by unpaired Student's t-test (C, H, I, M and N). (For interpretation of the references to colour in this figure legend, the reader is referred to the Web version of this article.)
Fig. 3
Fig. 3
Absence of BMP4 in PVAT decreases the fatty acid metabolism. (A) Pie graph of RNA sequencing comparing PVAT of BMP4fl/fl ApoE−/− with BMP4ΔaP2 ApoE−/− mice. (B) Volcano plot of RNA sequencing comparing PVAT of BMP4fl/fl ApoE−/− with BMP4ΔaP2 ApoE−/− mice. (C) Gene ontology analysis for downregulated genes in KEGG pathways, pathways with p value < 0.00015 were listed. (D) Down-regulated genes in PVAT of BMP4ΔaP2 ApoE−/− mice identified by RNA sequencing are marked in red. (E) qPCR validation of genes selected from the pathways in (D). (F) Western blot analysis and quantification (G) of FASN, SCD1, HSL and ATGL in PVAT of BMP4fl/fl ApoE−/− and BMP4ΔaP2 ApoE−/− mice fed with WD for 16 weeks (n = 9). (H) Western blot analysis and quantification (I) of FASN, SCD1, HSL and ATGL in PVAT of BMP4fl/fl ApoE−/− and BMP4ΔUCP1 ApoE−/− mice fed with WD for 16 weeks (n = 3). (J) Western blot analysis of FASN, SCD1, HSL and ATGL in brown adipocytes with LacZ knockdown or BMP4 knockdown. (K) Relative mRNA levels of FASN, SCD1, HSL and ATGL in brown adipocytes with LacZ knockdown or BMP4 knockdown. Values are means ± S.E.M. *P < 0.05, **P < 0.01, ***P < 0.001 by unpaired Student's t-test (E, G, I, and K). (For interpretation of the references to colour in this figure legend, the reader is referred to the Web version of this article.)
Fig. 4
Fig. 4
BMP4 knockout adipocyte increase endothelial inflammation in vitro. (A) Relative mRNA levels of BMP4 in brown adipocytes with BMP4 knockdown and the controls. (B) Relative mRNA levels of VCAM-1, ICAM-1, MCP1, IL-6 and IL1β in TNFα pretreated HUVECs incubated with conditioned medium from brown adipocytes with BMP4 knockdown and the controls. (C) Western blot analysis of VCAM-1 expression in TNFα pre-treated HUVECs incubated with conditioned medium from brown adipocytes with BMP4 knockdown and the controls. (D) Relative mRNA expression levels of BMP4 in brown adipocytes with BMP4 overexpression and the controls. (E) Relative mRNA levels of VCAM-1, ICAM-1, MCP1, IL-6 and IL1β in TNFα pre-treated HUVECs incubated with conditioned medium from brown adipocytes with BMP4 overexpression and the controls. (F) Western blot analysis of VCAM-1 expression in TNFα pre-treated HUVECs incubated with conditioned medium from brown adipocytes with BMP4 overexpression and the controls. (G)Schematic of the transwell coculture chamber. (H) Relative mRNA levels of VCAM-1, ICAM-1, MCP1, IL-6 and IL1β in TNFα pre-treated HUVECs that were co-cultured for 24 h with PVAT isolated from BMP4fl/fl ApoE−/− and BMP4ΔaP2 ApoE−/− mice fed with WD for 16 weeks (n = 6). (I) Western blot analysis of VCAM-1 in TNFα pre-treated HUVECs that were co-cultured for 24 h with PVAT isolated from BMP4fl/fl ApoE−/− and BMP4ΔaP2 ApoE−/− mice fed with WD for 16 weeks (n = 3). (J) Relative mRNA levels of BMP4 in PVAT of BMP4fl/fl ApoE−/− and BMP4ΔaP2 ApoE−/− mice fed with WD for 20 weeks (n = 6). (K) Relative mRNA levels of VCAM-1, ICAM-1, MCP1, IL-6 and IL1β in TNFα pre-treated HUVECs that were co-cultured for 24 h with PVAT isolated from ApoE−/− and BMP4-Tg ApoE−/− mice fed with WD for 20 weeks (n = 6). (L) Western blot analysis of VCAM-1 expression in TNFα pre-treated HUVECs that were co-cultured for 24 h with PVAT isolated from ApoE−/− and BMP4-Tg ApoE−/− mice fed with WD for 20 weeks (n = 3). Values are means ± S.E.M. *P < 0.05, **P < 0.01, ***P < 0.001 by unpaired Student's t-test (H, J and K) or one-way analysis of variance (ANOVA) (A and B, D and E). (For interpretation of the references to colour in this figure legend, the reader is referred to the Web version of this article.)
Fig. 5
Fig. 5
BMP4 deficiency accelerates atherosclerotic plaque formation in ApoE−/−mice. (A) En face Oil Red O staining of whole aortas from BMP4fl/fl ApoE−/−, BMP4ΔaP2 ApoE−/− mice fed with WD for 16 weeks. (B) Quantification of atherosclerotic lesion size in the whole aortas (n = 7). (C) Representative oil red O staining of cross-sections of aortic sinus. (D) Quantification of positive area for oil red O staining (n = 8–9). (E) Quantification of average lesion size in aortic sinus (n = 8–9). (F) Western blot analysis and quantification (G) of VCAM-1 expression (n = 3). (H) The levels of plasma total triglyceride (TG), cholesterol (TC) and low-density lipoprotein-cholesterol (LDL-C) and high-density lipoprotein-cholesterol (HDL-C) in mice (n = 17). (I) En face Oil Red O staining of whole aortas from BMP4fl/fl ApoE−/−, BMP4ΔUCP1 ApoE−/−mice fed with WD for 16 weeks. (J) Quantification of atherosclerotic lesion size in the whole aortas (n = 7). (K) Representative oil red O staining of cross-sections of aortic sinus. (L) Quantification of positive area for oil red O staining (n = 5–6). (M) Quantification of average lesion size in aortic sinus (n = 5–6). (N) Western blot analysis and quantification (O) of VCAM-1 expression (n = 3). (P) The levels of plasma TG, TC and LDL-C and HDL-C in mice (n = 10). Values are means ± S.E.M. *P < 0.05, **P < 0.01, ***P < 0.001 by unpaired Student's t-test (B, D, E, G, H, J, L, M, N, O and P). (For interpretation of the references to colour in this figure legend, the reader is referred to the Web version of this article.)
Fig. 6
Fig. 6
Overexpression of BMP4 in adipocyte promotes browning of PVAT and inhibits atherosclerosis in ApoE−/−mice. Male ApoE−/− and BMP4-Tg ApoE−/− mice were fed with WD for 20 weeks. (A) Representative HE and IHC(UCP1) microscopic picture of PVAT isolated from ApoE−/− and BMP4-Tg ApoE−/−mice. (B) Western blot analysis and quantification (C) of BMP4, UCP1 PGC1α, aP2, PPARγ and C/EBPβ in PVAT of ApoE−/− and BMP4-Tg ApoE−/− mice (n = 4). (D) Relative mRNA levels of UCP1, Cidea PGC1α, aP2, PPARγ and C/EBPα in PVAT of ApoE−/− and BMP4-Tg ApoE−/− mice (n = 6). (E) En face Oil Red O staining of whole aortas from ApoE−/− and BMP4-Tg ApoE−/− mice. (F) Quantification of atherosclerotic lesion size in the whole aortas (n = 7). (G) Representative Oil Red O staining of cross-sections of aortic sinus. (H) Quantification of positive area for oil red O staining (n = 3–5). (I) Quantification of average lesion size in aortic sinus (n = 3–5). (J) Western blot analysis and quantification (K) of VCAM-1 expression (n = 3). (L)The levels of plasma TG, TC, LDL-C and HDL-C in mice (n = 14–16). Values are means ± S.E.M. *P < 0.05, **P < 0.01, ***P < 0.001 by unpaired Student's t-test (C, D, F, H, I, K and L). (For interpretation of the references to colour in this figure legend, the reader is referred to the Web version of this article.)
Fig. 7
Fig. 7
BMP4 knockdown in brown adipocytes increase adipocyte inflammation and pro-inflammatory factors secretion. (A) Gene ontology analysis for up-regulated genes in KEGG pathways, pathways with p value < 0.00015 were listed. (B) qPCR validation of genes selected from the T cell activation pathways. (C) Immunohistochemical staining of F4/80 expression in PVAT of BMP4fl/fl ApoE−/− and BMP4ΔaP2 ApoE−/− mice. The right graph shows the quantification of F4/80 positive cells in C (n = 5). (D) Relative mRNA levels of BMP4, UCP1, Cidea, PGC1α, aP2, PPARγ and C/EBPα in PVAT of BMP4fl/fl ApoE−/− and BMP4ΔaP2 ApoE−/− mice fed with WD for 16 weeks (n = 5). (E) Immunohistochemical staining of F4/80 expression in PVAT of BMP4fl/fl ApoE−/− and BMP4ΔUCP1 ApoE−/− mice. The right graph shows the quantification of F4/80 positive cells in C (n = 5). (F) Relative mRNA levels of BMP4, UCP1, Cidea, PGC1α, aP2, PPARγ and C/EBPα in PVAT of BMP4fl/fl ApoE−/− and BMP4ΔUCP1 ApoE−/− mice fed with WD for 16 weeks (n = 5). (G) Immunohistochemical staining of F4/80 expression in PVAT of ApoE−/− and BMP4-Tg ApoE−/− mice. The right graph shows the quantification of F4/80 positive cells in C (n = 3–4). (H) Relative mRNA levels of BMP4, UCP1, Cidea, PGC1α, aP2, PPARγ and C/EBPα in PVAT of ApoE−/− and BMP4-Tg ApoE−/− mice fed with WD for 20 weeks (n = 5). (I) Workflow. Graphical representation of the collection of brown adipocytes supernatant for proteomic analysis. (J) Volcano plot of adipocyte-conditioned medium proteome comparing BMP4 knockdown with lacZ knockdown. (K) Relative mRNA levels of TNFα,IL1β, IL-6 and MCP1 in brown adipocytes with BMP4 knockdown or the controls. (L) Corresponding mRNA expression levels of TNFα,IL1β, IL-6 and MCP1 in brown adipocyte. (M) Western blot analysis of VCAM-1 expression in HUVECs. (N) Levels of the inflammatory cytokines IL1β in the medium from adipocyte with BMP4 knockdown and LacZ knockdown. (O) Plasma concentrations of IL1β in WD-fed BMP4fl/fl ApoE−/−, BMP4ΔaP2 ApoE−/− and BMP4ΔUCP1 ApoE−/− mice. (P) Western blot analysis of p-IκBα, IκBα, p-p65, and p65 in brown adipocytes with BMP4 knockdown or lacZ knockdown. (Q) Western blot analysis of p-IκBα, IκBα, p-p65, and p65 in brown adipocytes cultured with or without NF-κB pathway inhibitor BMS-345541. (R) Relative mRNA levels of TNFα,IL1β, IL-6 and MCP1 in brown adipocytes cultured with or without NF-κB pathway inhibitor BMS-345541. Values are means ± S.E.M. *P < 0.05, **P < 0.01, ***P < 0.001 by unpaired Student's t-test (B to H, N and O), one-way analysis of variance (ANOVA) (K and L) or two-way analysis of variance (ANOVA) (R). (For interpretation of the references to colour in this figure legend, the reader is referred to the Web version of this article.)
Fig. 8
Fig. 8
BMP4 knockdown impair PGC1α mediated fatty acid metabolism and activate NF-κB signaling in brown adipocytes.(A)Relative mRNA levels of PGC1α in brown adipocytes with PGC1α knockdown or lacZ knockdown. (B) Relative mRNA levels of TNFα,IL1β, IL-6 and MCP1 in brown adipocytes with PGC1α knockdown or lacZ knockdown. (C) Relative mRNA levels of VCAM-1, ICAM-1, MCP1, IL-6 and IL1β were determined in TNFα pre-treated HUVEC incubated with conditioned medium from brown adipocyte with PGC1α knockdown or lacZ knockdown. (D) Oil Red O staining of brown adipocytes differentiated from SVF on day 8. (E) Relative mRNA levels of PGC1α in brown adipocytes differentiated from SVF with PGC1α knockdown or lacZ knockdown. (F) Relative mRNA levels of TNFα,IL1β, IL-6 and MCP1 brown adipocytes differentiated from SVF with PGC1α knockdown or lacZ knockdown. (G) Relative mRNA levels of VCAM-1, ICAM-1, MCP1, IL-6 and IL1β were determined in TNFα pre-treated HUVEC incubated with conditioned medium from brown adipocytes differentiated from SVF with PGC1α knockdown or lacZ knockdown. (H) Western blot analysis of VCAM-1 expression in HUVECs incubated with conditioned medium from brown adipocytes differentiated from SVF with PGC1α knockdown or lacZ knockdown. (I) Model illustrating the mechanism of BMP4-medicated adipocyte metabolism activation inhibit inflammation and atherosclerosis. BMP4 signaling activate PGC1α, which erect positive effect on adipocyte lipid metabolism by promote genes expression of lipogenesis (FASN and SCD1) and lipolysis (HSL and ATGL). The active lipid metabolism inhibits adipocyte inflammation thereby reduces proinflammatory factors secretion. BMP4 deficiency disrupts this positive effect. Impaired lipid metabolism activates NF-κB pathway thereby increases proinflammatory factors secretion which initiates HUVEC inflammation and leads to atherosclerosis. Values are means ± S.E.M. *P < 0.05, **P < 0.01, ***P < 0.001 by unpaired Student's t-test (A to C, E to G). (For interpretation of the references to colour in this figure legend, the reader is referred to the Web version of this article.)

References

    1. Williams K.J., Tabas I. Atherosclerosis--an inflammatory disease. N. Engl. J. Med. 1999;340:1928. author reply 1929. - PubMed
    1. Wolf D., Ley K. Immunity and inflammation in atherosclerosis. Circ. Res. 2019;124:315–327. - PMC - PubMed
    1. Shah P.K. Inflammation, infection and atherosclerosis. Trends Cardiovasc. Med. 2019;29:468–472. - PubMed
    1. Zhu Y., Xian X., Wang Z., Bi Y., Chen Q., Han X., Tang D., Chen R. Research progress on the relationship between atherosclerosis and inflammation. Biomolecules. 2018;8:80. - PMC - PubMed
    1. Libby P. The forgotten majority: unfinished business in cardiovascular risk reduction. J. Am. Coll. Cardiol. 2005;46:1225–1228. - PubMed

Publication types

Substances

LinkOut - more resources