. 2021 Aug 13;33(7):2235-2257.
doi: 10.1093/plcell/koab117.

Endosperm-based incompatibilities in hybrid monkeyflowers

Affiliations

Endosperm-based incompatibilities in hybrid monkeyflowers

Taliesin J Kinser et al. Plant Cell. .

Erratum in

Abstract

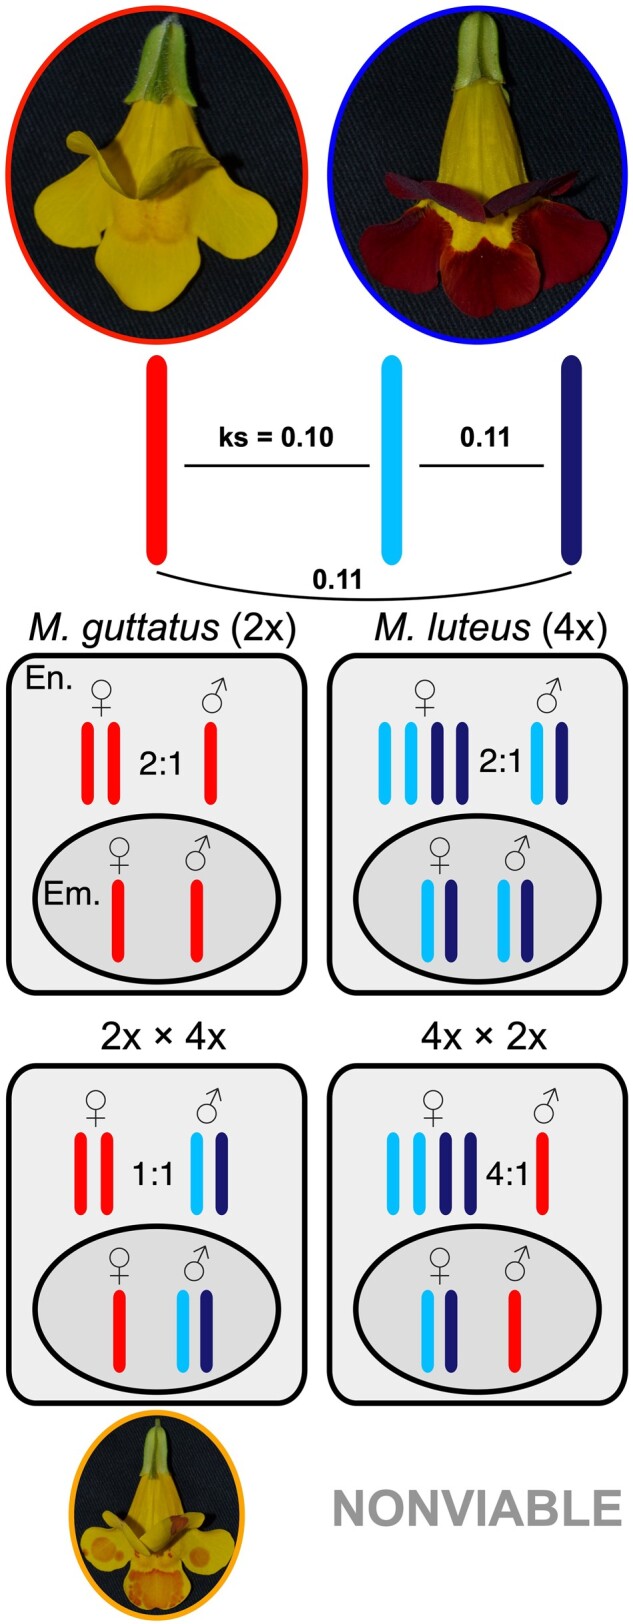
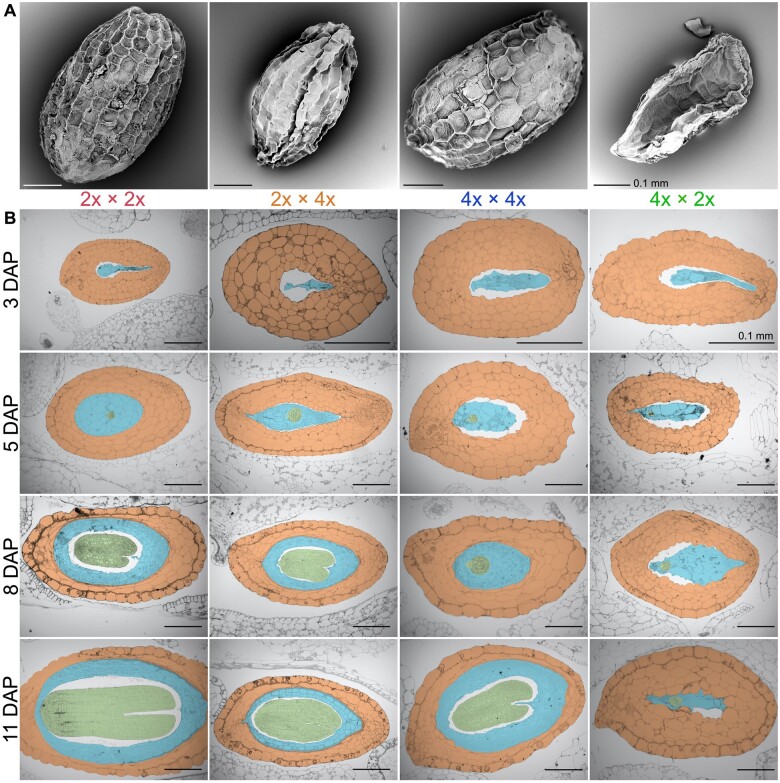
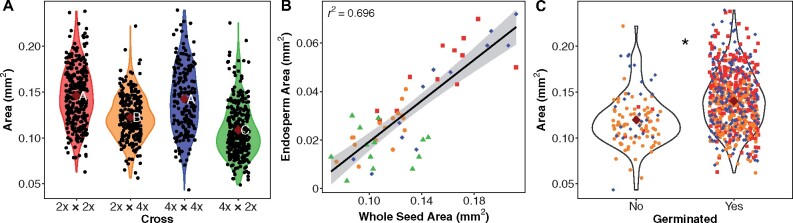
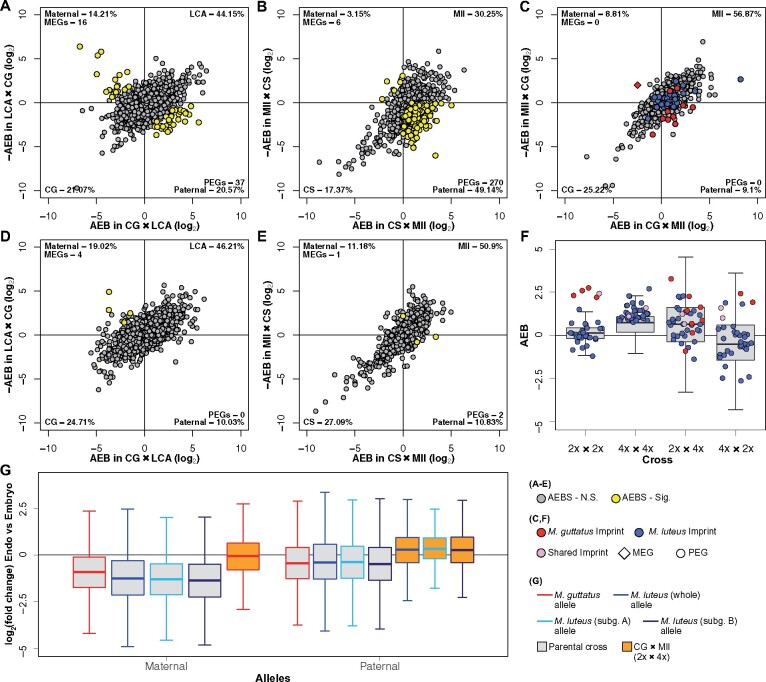
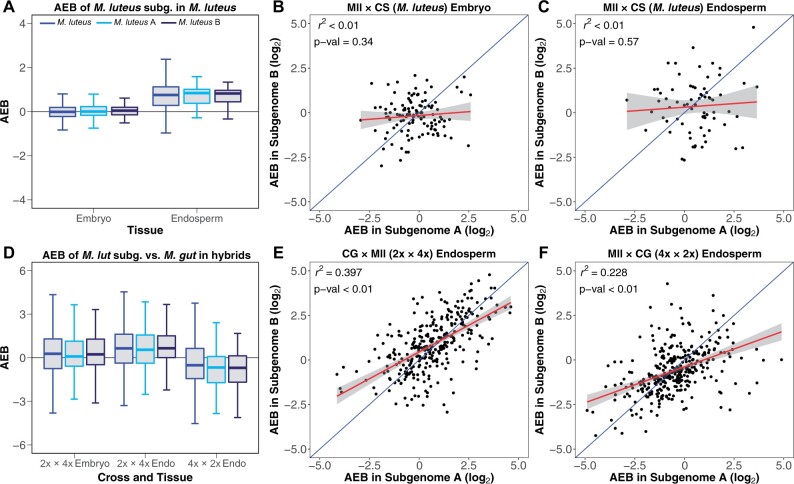
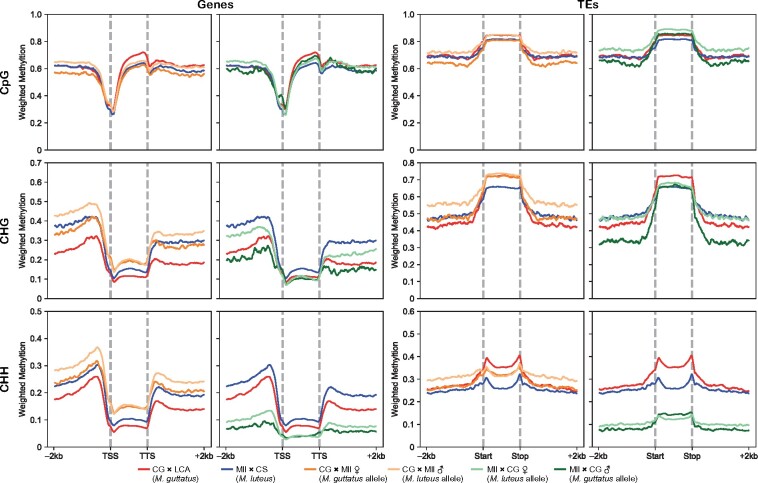
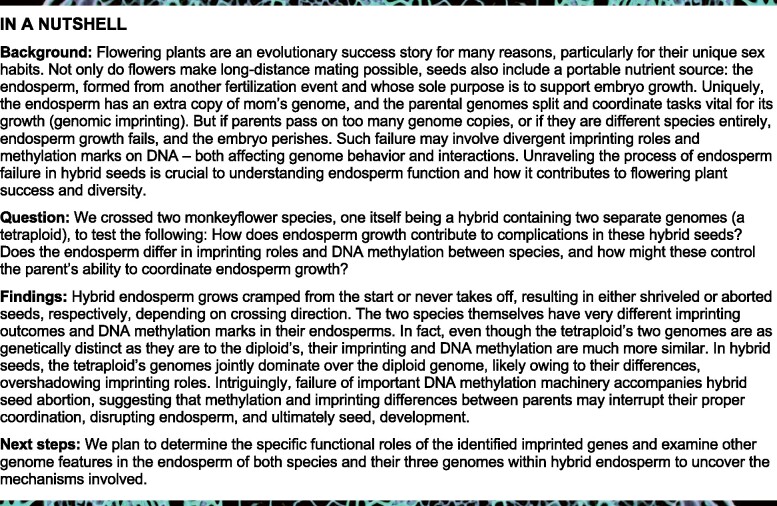
Endosperm is an angiosperm innovation central to their reproduction whose development, and thus seed viability, is controlled by genomic imprinting, where expression from certain genes is parent-specific. Unsuccessful imprinting has been linked to failed inter-specific and inter-ploidy hybridization. Despite their importance in plant speciation, the underlying mechanisms behind these endosperm-based barriers remain poorly understood. Here, we describe one such barrier between diploid Mimulus guttatus and tetraploid Mimulus luteus. The two parents differ in endosperm DNA methylation, expression dynamics, and imprinted genes. Hybrid seeds suffer from underdeveloped endosperm, reducing viability, or arrested endosperm and seed abortion when M. guttatus or M. luteus is seed parent, respectively, and transgressive methylation and expression patterns emerge. The two inherited M. luteus subgenomes, genetically distinct but epigenetically similar, are expressionally dominant over the M. guttatus genome in hybrid embryos and especially their endosperm, where paternal imprints are perturbed. In aborted seeds, de novo methylation is inhibited, potentially owing to incompatible paternal instructions of imbalanced dosage from M. guttatus imprints. We suggest that diverged epigenetic/regulatory landscapes between parental genomes induce epigenetic repatterning and global shifts in expression, which, in endosperm, may uniquely facilitate incompatible interactions between divergent imprinting schemes, potentially driving rapid barriers.


Figures

Figure 1
Figure 1
The Mimulus guttatus × M. luteus hybridization system. M. guttatus (in the red oval; left) is a diploid and M. luteus (in the blue oval; right) is a tetraploid with two distinct subgenomes (light blue and navy). Pairwise synonymous site divergences (ks) between the two M. luteus subgenomes and between each of them and M. guttatus are provided. Within seeds for each species, the genomic ratio between parental alleles is 2 maternal:1 paternal in the endosperm (En.) and 1:1 in the embryo (Em.), despite the tetraploidy of M. luteus. When hybridized, if M. guttatus is the maternal progenitor, the genomic ratio between parental alleles is 2:2 (1:1) in the endosperm, and seeds are often viable (M. × robertsii; orange). However, if M. luteus is the maternal progenitor, the ratio is 4:1 and seeds are almost always nonviable. Within the hybrids there are three distinct subgenomes (one from M. guttatus and two from M. luteus—colors are shown throughout).
Figure 2
Figure 2
Seed development of parental and reciprocal hybrid seeds. A, Scanning electron micrograph images of a representative seed from each cross (M. guttatus—2x × 2x [red]; 2x × 4x [orange]; M. luteus—4x × 4x [blue]; 4x × 2x [green]) is displayed. B, Histological sections were made of each cross through a developmental progression from 3, 5, 8, to 11 DAP. Crosses are displayed in columns and DAP is displayed in rows. Within the images, the seed coat is orange, embryo is green, and endosperm is blue. Scale bars, 0.1 mm
Figure 3
Figure 3
Relationship between endosperm and seed area and effect of seed area on germination. A, Seed area in each cross (M. guttatus—2x × 2x [red]; 2x × 4x [orange]; M. luteus—4x × 4x [blue]; 4x × 2x [green]) is represented in violin plots. Dark red diamonds display group means. Letters represent Tukey–Kramer results following an ANOVA. Groups with different letters are statistically different in area. B, Regression between endosperm area and area of the entire seed. The r2 value is provided. C, Area of seeds that failed to germinate compared with successfully germinated seeds among all crosses. 4x × 2x seeds are not included to avoid biasing the comparison since none germinated, and they were the smallest of the four crosses. Dark red diamonds represent group means and the asterisk indicates they are statistically different (P < 0.05, Welch’s t test).
Figure 4
Figure 4
Patterns of imprinting and parental bias. A–E, Distributions of AEB in the endosperm and embryo of M. guttatus (A and D, respectively) and M. luteus (B and E), and the endosperm of the hybrids (C). Genes in scatterplots are plotted by their AEB value in one cross on the x-axis against –AEB of the reciprocal cross on the y-axis. Due to the reciprocal crossing design, bias is divided into four quadrants. Points that fall into the bottom left or top right quadrants represent line or species-specific bias, points in the bottom right have paternal bias, and points in the top left have maternal bias. The percentage of genes in each of these quadrants is given in the corner of that quadrant. The number of PEGs and MEGs is also listed in their respective quadrants. A comparison between hybrid embryos is not included since there was insufficient tissue for Mll × CG (4x × 2x) embryo. Yellow points signify imprinted genes, as determined by a likelihood ratio test (LRT). M. luteus and M. guttatus PEGs identified within the hybrid endosperm (C) are highlighted in blue and red, respectively. The single MEG from M. guttatus is represented by a red diamond. Note these are not significantly imprinted in hybrid endosperm according to LRTs. F, AEB of M. guttatus (red) and M. luteus (blue) PEGs found in each cross, plotted onto the entire AEB distribution of that cross (shown as boxplots). AEB values of genes are averaged between reciprocal crosses for both M. guttatus (2x × 2x) and M. luteus (4x × 4x). G, Log2 fold-change of gene expression (measured in RPKM) between endosperm and embryo (positive values indicate greater endosperm expression) plotted for each allele (maternal and paternal) from M. guttatus, M. luteus, and CG × Mll (2x × 4x) crosses. RPKMs were averaged between reciprocal crosses for each tissue for both M. guttatus and M. luteus. Gray boxes indicate parental crosses (M. guttatus and M. luteus) and orange boxes indicate 2x × 4x. Red lines indicate the M. guttatus genome, and blue indicates the M. luteus genome, whether in parental crosses or inherited in 2x × 4x. The M. luteus genome is also separated into its two subgenomes: A (light blue lines) and B (navy lines). Outliers were removed for F and G
Figure 5
Figure 5
Comparison of AEB values between M. luteus subgenomes. AEB distribution of each of the two subgenomes from M. luteus (A, light blue and B, navy) in parental M. luteus (A) and reciprocal hybrid crosses (2x × 4x [CG × Mll] and 4x × 2x [Mll × CG] in D) for endosperm and embryo (other than 4x × 2x). AEB of reciprocal crosses for M. luteus are averaged. Linear regressions were performed comparing AEB values for genes on M. luteus subgenome A to AEB values of their respective homeologs on subgenome B for M. luteus (values for Mll × CS are shown here) embryo (B) and endosperm (C), and for the endosperm of 2x × 4x (E) and 4x × 2x (F). R2 values and P-values for linear regressions are provided in the top left corner of each plot. A hypothetical 1:1 relationship is shown in blue with the actual linear model in red. The gray shaded area represents the 95% confidence interval of the linear model.
Figure 6
Figure 6
Patterns of methylation in parent and hybrid endosperm. Gene (left two columns) and transposon (right two columns) methylation of each sequence context (CpG, CHG, and CHH—1st, 2nd, and 3rd row, respectively) in the endosperm of parental crosses (red—M. guttatus, blue—M. luteus) compared with that of each allele in reciprocal hybrids (orange—2x × 4x [1st and 3rd column], green—4x × 2x [2nd and 4th column]). The inherited M. luteus allele in each of the hybrid crosses is represented by the lighter shade of their respective color, and the inherited M. guttatus allele is represented by the darker shade. Weighted methylation is on the y-axis, while the x-axis represents the gene body (TSS = transcription start site and TTS = transcription termination site) or TE body and 2 kb upstream and downstream.
None

Comment in

  • Genome shock in monkeyflower hybrids.
    Andreuzza S. Andreuzza S. Plant Cell. 2021 Aug 13;33(7):2097-2098. doi: 10.1093/plcell/koab118. Plant Cell. 2021. PMID: 35233602 Free PMC article. No abstract available.

References

    1. Alger EI, Edger PP (2020) One subgenome to rule them all: underlying mechanisms of subgenome dominance. Curr Opin Plant Biol 54: 108–113 - PubMed
    1. Anders S, Pyl PT, Huber W. (2015). HTSeq—a python framework to work with high-throughput sequencing data. Bioinformatics 31: 166–169 - PMC - PubMed
    1. Baroux C, Spillane C, Grossniklaus U. (2002). Evolutionary origins of the endosperm in flowering plants. Genome Biol 3: 1026. - PMC - PubMed
    1. Batista RA, Figueiredo DD, Santos-González J, Köhler C (2019) Auxin regulates endosperm cellularization in Arabidopsis. Genes Dev 33: 466–476 - PMC - PubMed
    1. Batista RA, Köhler C (2020) Genomic imprinting in plants—revisiting existing models. Genes Dev 34: 24–36 - PMC - PubMed

Publication types

LinkOut - more resources