

Secondary Ion Mass Spectrometry Imaging Reveals Changes in the Lipid Structure of the Plasma Membranes of Hippocampal Neurons following Drugs Affecting Neuronal Activity
- PMID: 33896172
- PMCID: PMC8154318
- DOI: 10.1021/acschemneuro.1c00031
Secondary Ion Mass Spectrometry Imaging Reveals Changes in the Lipid Structure of the Plasma Membranes of Hippocampal Neurons following Drugs Affecting Neuronal Activity
Abstract
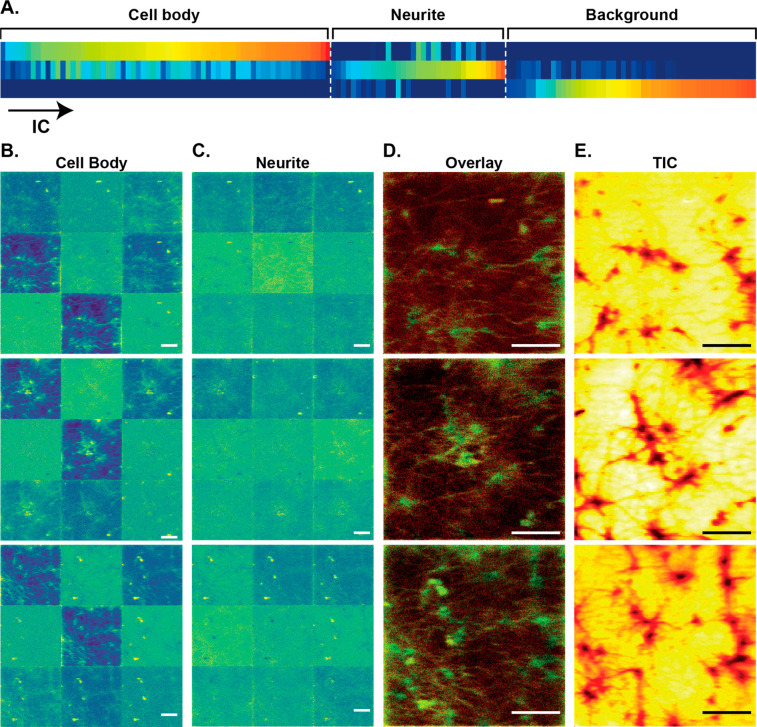
The cellular functions of lipids in the neuronal plasma membranes have been increasingly acknowledged, particularly their association to neuronal processes and synaptic plasticity. However, the knowledge of their regulatory mechanisms in neuronal cells remains sparse. To address this, we investigated the lipid organization of the plasma membranes of hippocampal neurons in relation to neuronal activity using secondary ion mass spectrometry imaging. The neurons were treated with drugs, particularly tetrodotoxin (TTX) and bicuculline (BIC), to induce chronic activation and silencing. Distinct lipid organization was found in the plasma membrane of the cell body and the neurites. Moreover, significant alterations of the levels of the membrane lipids, especially ceramides, phosphatidylserines, phosphatidic acids, and triacylglycerols, were observed under the TTX and BIC treatments. We suggest that many types of membrane lipids are affected by, and may be involved in, the regulation of neuronal function.
Keywords: ToF-SIMS; lipids; mass spectrometry imaging; membranes; neurons.
Conflict of interest statement
The authors declare no competing financial interest.
Figures


Similar articles
-
Lipid organization and turnover in the plasma membrane of human differentiating neural progenitor cells revealed by time-of-flight secondary ion mass spectrometry imaging.Talanta. 2024 May 15;272:125762. doi: 10.1016/j.talanta.2024.125762. Epub 2024 Feb 14. Talanta. 2024. PMID: 38394748
-
Nanometer-scale molecular organization in lipid membranes studied by time-of-flight secondary ion mass spectrometry.Biointerphases. 2018 Feb 8;13(3):03B408. doi: 10.1116/1.5019794. Biointerphases. 2018. PMID: 29421877
-
Quantifying the molar percentages of cholesterol in supported lipid membranes by time-of-flight secondary ion mass spectrometry and multivariate analysis.Anal Chem. 2013 Jan 2;85(1):91-7. doi: 10.1021/ac301856z. Epub 2012 Dec 13. Anal Chem. 2013. PMID: 23199099
-
Imaging lipids with secondary ion mass spectrometry.Biochim Biophys Acta. 2014 Aug;1841(8):1108-19. doi: 10.1016/j.bbalip.2014.03.003. Epub 2014 Mar 18. Biochim Biophys Acta. 2014. PMID: 24657337 Review.
-
Lipid Diversity in Cells and Tissue Using Imaging SIMS.Annu Rev Anal Chem (Palo Alto Calif). 2020 Jun 12;13(1):249-271. doi: 10.1146/annurev-anchem-091619-103512. Epub 2020 Mar 25. Annu Rev Anal Chem (Palo Alto Calif). 2020. PMID: 32212820 Review.
Cited by
-
Bicuculline ameliorates metabolic dysfunction-associated steatotic liver disease by inhibiting the nuclear factor-kappa B pathway and reducing lipid accumulation.World J Gastroenterol. 2025 May 7;31(17):105438. doi: 10.3748/wjg.v31.i17.105438. World J Gastroenterol. 2025. PMID: 40521270 Free PMC article.
-
Chemical Imaging and Analysis of Single Nerve Cells by Secondary Ion Mass Spectrometry Imaging and Cellular Electrochemistry.Front Synaptic Neurosci. 2022 May 16;14:854957. doi: 10.3389/fnsyn.2022.854957. eCollection 2022. Front Synaptic Neurosci. 2022. PMID: 35651734 Free PMC article. Review.
-
Advancements in ToF-SIMS imaging for life sciences.Front Chem. 2023 Aug 24;11:1237408. doi: 10.3389/fchem.2023.1237408. eCollection 2023. Front Chem. 2023. PMID: 37693171 Free PMC article. Review.
References
Publication types
MeSH terms
Substances
LinkOut - more resources
Full Text Sources
Medical
