GPU-accelerated real-time reconstruction in Python of three-dimensional datasets from structured illumination microscopy with hexagonal patterns
- PMID: 33896199
- PMCID: PMC8072201
- DOI: 10.1098/rsta.2020.0162
GPU-accelerated real-time reconstruction in Python of three-dimensional datasets from structured illumination microscopy with hexagonal patterns
Abstract
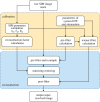
We present a structured illumination microscopy system that projects a hexagonal pattern by the interference among three coherent beams, suitable for implementation in a light-sheet geometry. Seven images acquired as the illumination pattern is shifted laterally can be processed to produce a super-resolved image that surpasses the diffraction-limited resolution by a factor of over 2 in an exemplar light-sheet arrangement. Three methods of processing data are discussed depending on whether the raw images are available in groups of seven, individually in a stream or as a larger batch representing a three-dimensional stack. We show that imaging axially moving samples can introduce artefacts, visible as fine structures in the processed images. However, these artefacts are easily removed by a filtering operation carried out as part of the batch processing algorithm for three-dimensional stacks. The reconstruction algorithms implemented in Python include specific optimizations for calculation on a graphics processing unit and we demonstrate its operation on experimental data of static objects and on simulated data of moving objects. We show that the software can process over 239 input raw frames per second at 512 × 512 pixels, generating over 34 super-resolved frames per second at 1024 × 1024 pixels. This article is part of the Theo Murphy meeting issue 'Super-resolution structured illumination microscopy (part 1)'.
Keywords: GPU processing; fluorescence microscopy; light-sheet microscopy; reconstruction algorithm; structured illumination microscopy; super-resolution microscopy.
Figures


Similar articles
-
Live, video-rate super-resolution microscopy using structured illumination and rapid GPU-based parallel processing.Microsc Microanal. 2011 Apr;17(2):191-6. doi: 10.1017/S1431927611000158. Epub 2011 Mar 9. Microsc Microanal. 2011. PMID: 21385522
-
Answering some questions about structured illumination microscopy.Philos Trans A Math Phys Eng Sci. 2022 Apr 4;380(2220):20210109. doi: 10.1098/rsta.2021.0109. Epub 2022 Feb 14. Philos Trans A Math Phys Eng Sci. 2022. PMID: 35152757 Free PMC article.
-
Structured illumination microscopy artefacts caused by illumination scattering.Philos Trans A Math Phys Eng Sci. 2021 Jun 14;379(2199):20200153. doi: 10.1098/rsta.2020.0153. Epub 2021 Apr 26. Philos Trans A Math Phys Eng Sci. 2021. PMID: 33896197
-
Structured illumination microscopy and image scanning microscopy: a review and comparison of imaging properties.Philos Trans A Math Phys Eng Sci. 2021 Jun 14;379(2199):20200154. doi: 10.1098/rsta.2020.0154. Epub 2021 Apr 26. Philos Trans A Math Phys Eng Sci. 2021. PMID: 33896206 Review.
-
Recent advancements in structured-illumination microscopy toward live-cell imaging.Microscopy (Oxf). 2015 Aug;64(4):237-49. doi: 10.1093/jmicro/dfv034. Epub 2015 Jun 30. Microscopy (Oxf). 2015. PMID: 26133185 Review.
Cited by
-
Super-resolution microscopy: a brief history and new avenues.Philos Trans A Math Phys Eng Sci. 2022 Apr 4;380(2220):20210110. doi: 10.1098/rsta.2021.0110. Epub 2022 Feb 14. Philos Trans A Math Phys Eng Sci. 2022. PMID: 35152764 Free PMC article.
-
An open-source microscopy framework for simultaneous control of image acquisition, reconstruction, and analysis.HardwareX. 2023 Feb 6;13:e00400. doi: 10.1016/j.ohx.2023.e00400. eCollection 2023 Mar. HardwareX. 2023. PMID: 36824447 Free PMC article.
-
An LED-Based structured illumination microscope using a digital micromirror device and GPU accelerated image reconstruction.PLoS One. 2022 Sep 9;17(9):e0273990. doi: 10.1371/journal.pone.0273990. eCollection 2022. PLoS One. 2022. PMID: 36084054 Free PMC article.
-
Fully automated multicolour structured illumination module for super-resolution microscopy with two excitation colours.Commun Eng. 2025 Mar 10;4(1):42. doi: 10.1038/s44172-025-00365-x. Commun Eng. 2025. PMID: 40065157 Free PMC article.
-
Facile Conversion and Optimization of Structured Illumination Image Reconstruction Code into the GPU Environment.Int J Biomed Imaging. 2024 Feb 28;2024:8862387. doi: 10.1155/2024/8862387. eCollection 2024. Int J Biomed Imaging. 2024. PMID: 38449563 Free PMC article.
References
-
- Heintzmann R, Cremer CG. 1999. Laterally modulated excitation microscopy: improvement of resolution by using a diffraction grating. Opt. Biopsies Microsc. Tech. III 3568, 185–196. (10.1117/12.336833) - DOI
LinkOut - more resources
Full Text Sources
Other Literature Sources

