. 2021 Apr 26;23(1):47.
doi: 10.1186/s12968-020-00695-z.

A deep learning pipeline for automatic analysis of multi-scan cardiovascular magnetic resonance

Affiliations

A deep learning pipeline for automatic analysis of multi-scan cardiovascular magnetic resonance

Hakim Fadil et al. J Cardiovasc Magn Reson. .

Abstract

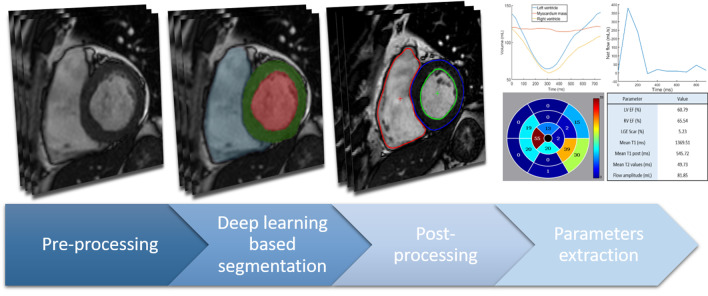
Background: Cardiovascular magnetic resonance (CMR) sequences are commonly used to obtain a complete description of the function and structure of the heart, provided that accurate measurements are extracted from images. New methods of extraction of information are being developed, among them, deep neural networks are powerful tools that showed the ability to perform fast and accurate segmentation. Iq1n order to reduce the time spent by reading physicians to process data and minimize intra- and inter-observer variability, we propose a fully automatic multi-scan CMR image analysis pipeline.

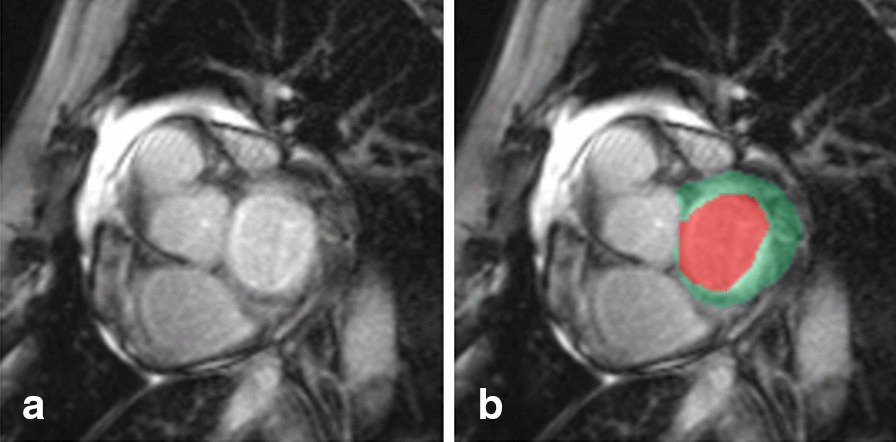
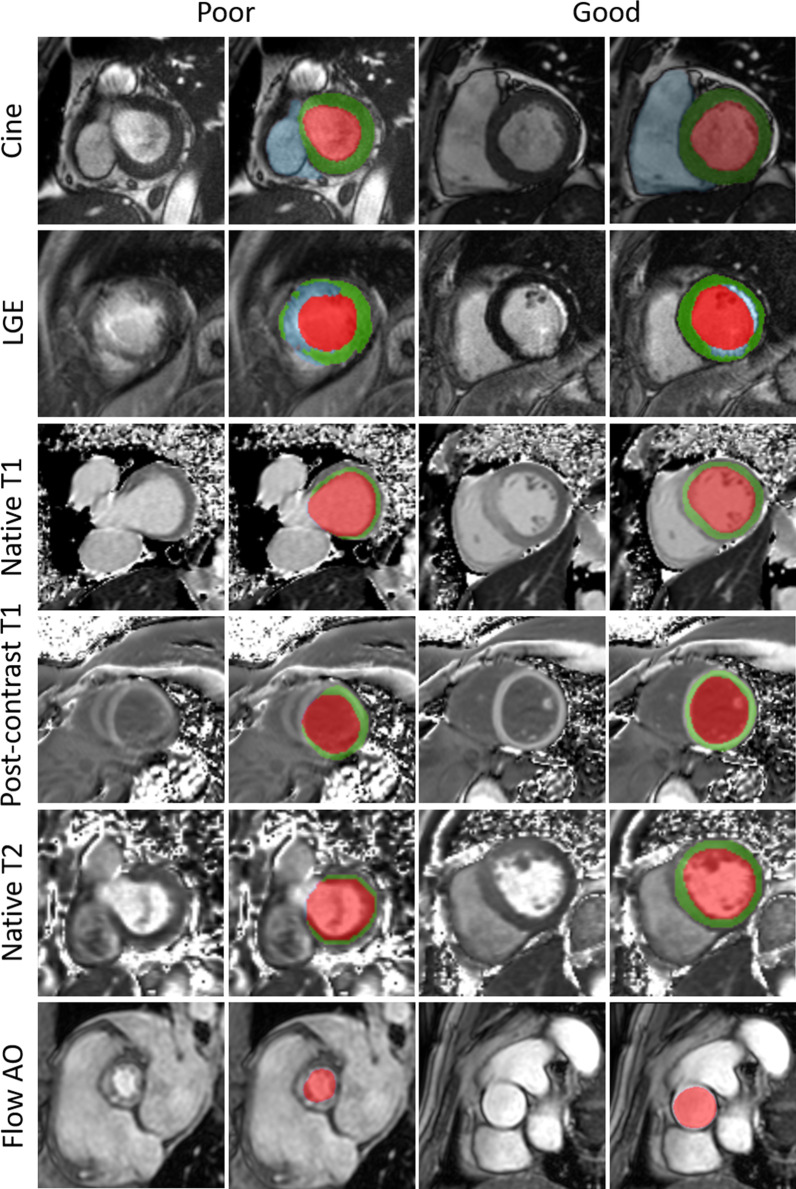
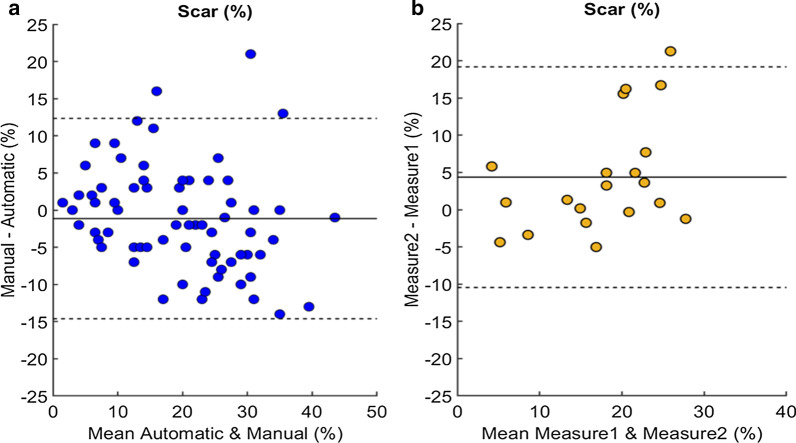
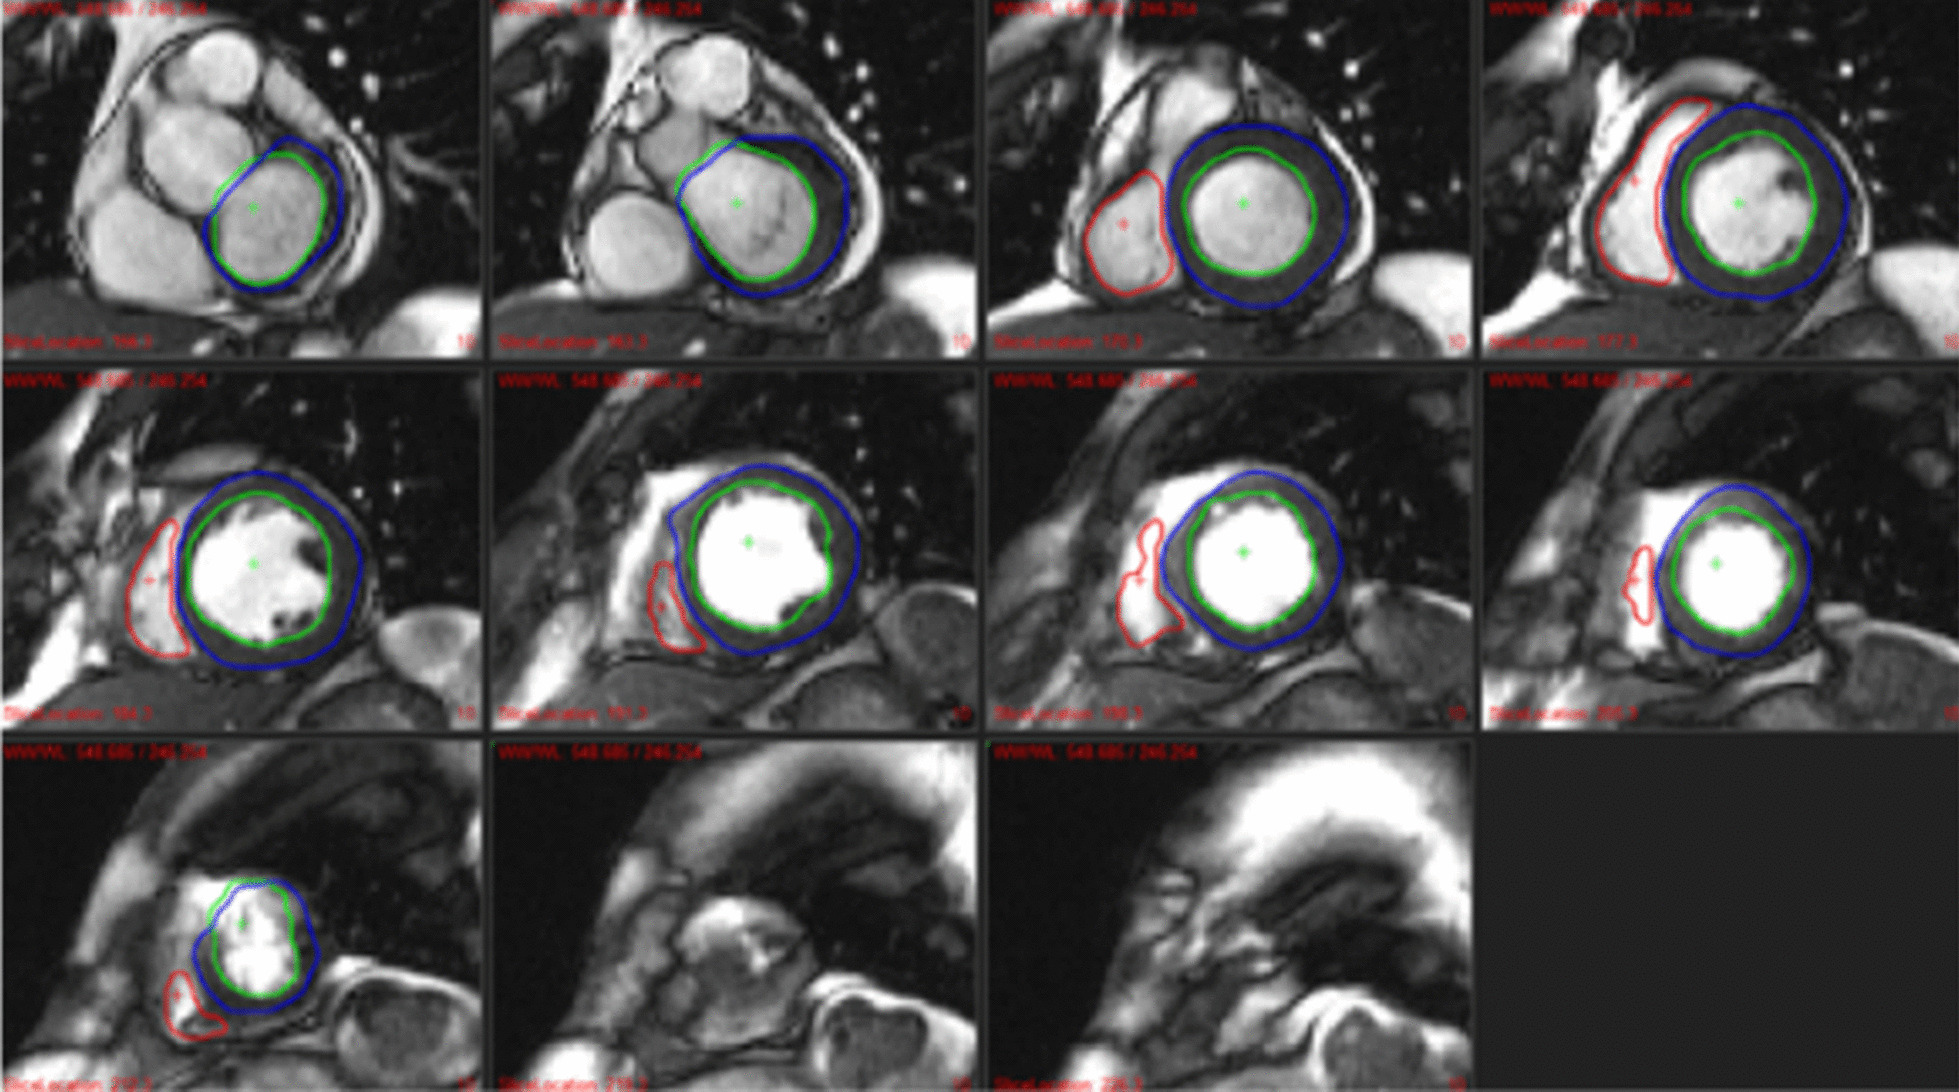
Methods: Sequence specific U-Net 2D models were trained to perform the segmentation of the left ventricle (LV), right ventricle (RV) and aorta in cine short-axis, late gadolinium enhancement (LGE), native T1 map, post-contrast T1, native T2 map and aortic flow sequences depending on the need. The models were trained and tested on a set of data manually segmented by experts using semi-automatic and manual tools. A set of parameters were computed from the resulting segmentations such as the left ventricular and right ventricular ejection fraction (EF), LGE scar percentage, the mean T1, T1 post, T2 values within the myocardium, and aortic flow. The Dice similarity coefficient, Hausdorff distance, mean surface distance, and Pearson correlation coefficient R were used to assess and compare the results of the U-Net based pipeline with intra-observer variability. Additionally, the pipeline was validated on two clinical studies.

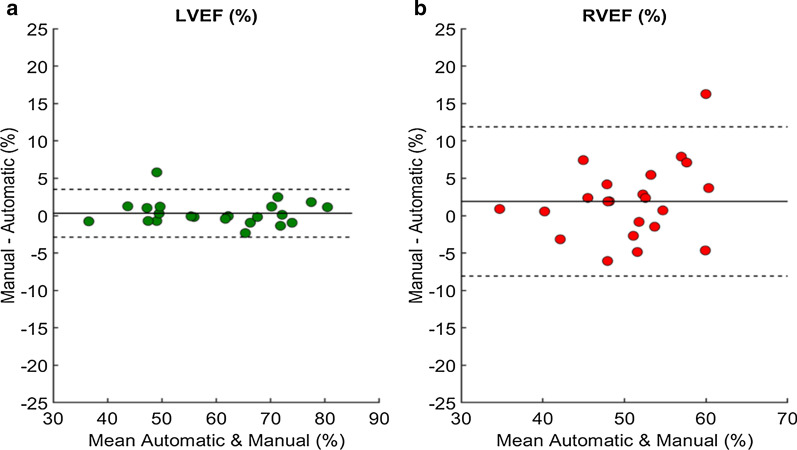
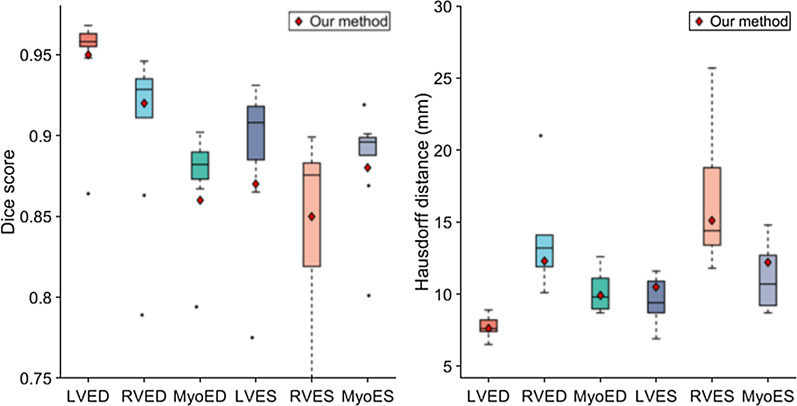
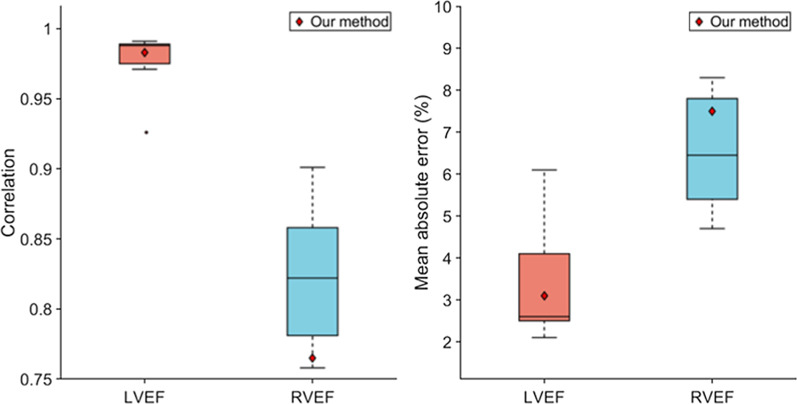
Results: The sequence specific U-Net 2D models trained achieved fast (≤ 0.2 s/image on GPU) and precise segmentation over all the targeted region of interest with high Dice scores (= 0.91 for LV, = 0.92 for RV, = 0.93 for Aorta in average) comparable to intra-observer Dice scores (= 0.86 for LV, = 0.87 for RV, = 0.95 for aorta flow in average). The automatically and manually computed parameters were highly correlated (R = 0.91 in average) showing results superior to the intra-observer variability (R = 0.85 in average) for every sequence presented here.

Conclusion: The proposed pipeline allows for fast and robust analysis of large CMR studies while guaranteeing reproducibility, hence potentially improving patient's diagnosis as well as clinical studies outcome.

Keywords: Aortic flow; Automatic analysis; Cine short-axis; Deep learning; Segmentation; T1 mapping; T2 mapping.


Conflict of interest statement

The authors declare that they have no competing interests.

Figures

Fig. 1
Fig. 1
Fully automatic multi-scan CMR analysis pipeline
Fig. 2
Fig. 2
An example of over-segmentation (segmentation of an extra slice more than our ground truth) around the basal slice (a). b The blood pool and the muscle are segmented by the U-Net 2D model as the LV cavity (red) and myocardium (green). Our human experts would not segment this slice as part of the LV
Fig. 3
Fig. 3
Bland–Altman plots of left ventricular ejection fraction (LVEF) (a) and right ventricular ejection fraction (RVEF) (b) measures between automated and manual measurements. The middle line denotes the mean difference (bias) and the two dashed lines denote ± 1.96 standard deviations from the mean. The plot a shows a mean difference of 0.4% with 95% limits of agreement being from -2.7% to 3.5% for LVEF. The plot b shows a mean difference of 1.9% with 95% limits of agreement being from -8% to 11.8% for RVEF
Fig. 4
Fig. 4
Results example of left cavity (red), left myocardium (green), right cavity (blue), scar tissue (blue), and aorta (red) segmentations obtained using the pipeline. Good, and poor results are shown for cine, LGE, T1, post-contrast T1, T2, and aortic flow images. The pipeline faces multiple challenges: the basal slice with its variability, and noise (CINE, T1, and T2); clouded and undefined boundaries (the myocardium on LGE images); artifacts compromising the shape of anatomical structures (post-contrast T1); and irregularities. Flow AO = aortic flow
Fig. 5
Fig. 5
Comparison of the segmentation accuracy of our method with the top 10 methods of the ACDC challenge on the testing dataset. In these box-and-whiskers plots the middle horizontal line represents the median, box hinges represent first and third quartiles, whiskers represent extreme values within 1.5 times the interquartile range, and asterisks represent outliers. The red diamond represents the result of our method. LV left ventricle cavity, RV right ventricle cavity, Myo left ventricle myocardium, ED end-diastolic, ES end-systolic
Fig. 6
Fig. 6
Comparison of the clinical metrics of our method with the top ten methods of the ACDC challenge on the testing dataset. In these box-and-whiskers plots the middle horizontal line represents the median, box hinges represent first and third quartiles, whiskers represent extreme values within 1.5 times the interquartile range, and asterisks represent outliers. The red diamond represents the result of our method. LV left ventricle, RV right ventricle, EF ejection fraction
Fig. 7
Fig. 7
Bland–Altman plots of late gadolinium enhancement (LGE) scar percentage between automated and manual measurements (a), as well as between two measurements by a same human observer (b). The middle line denotes the mean difference (bias) and the two dashed lines denote ± 1.96 standard deviations from the mean. The plot a shows a mean difference of 1.1% with 95% limits of agreement being from − 14.8 to 13.5%. The plot b shows a mean difference of 4.4% with 95% limits of agreement being from − 10.6 to 19.4%
Fig. 8
Fig. 8
Example of bad LV (left) and RV (right) deep learning segmentations that led to an error of 5.9% in LVEF and 14% in RVEF. The poor segmentations can be explained by the poor image quality of this Cine sequence with borders very blurry or/and blood pool very inhomogeneous. LV left ventricle, RV right ventricle, EF ejection fraction
Fig. 9
Fig. 9
Example of deep learning segmentation for the study B case leading to the highest error in ejection fraction. The error is mainly due to over-segmentation of the basal slice for the left ventricle, and poor detection of the right ventricle for the mid to apex slices due to high contrast in fatty tissue surrounding the heart

References

    1. Miller DD, Brown EW. Artificial intelligence in medical practice: the question to the answer? The American journal of medicine. 2018;131(2):129–133. doi: 10.1016/j.amjmed.2017.10.035. - DOI - PubMed
    1. Litjens G, Kooi T, Bejnordi BE, Setio AAA, Ciompi F, Ghafoorian M, Van Der Laak JA, Van Ginneken B, Sanchez CI. A survey on deep learning in medical image analysis. Med Image Anal. 2017;42:60–88. doi: 10.1016/j.media.2017.07.005. - DOI - PubMed
    1. Becker AS, Marcon M, Ghafoor S, Wurnig MC, Frauenfelder T, Boss A. Deep learning in mammography: diagnostic accuracy of a multipurpose image analysis software in the detection of breast cancer. Invest Radiol. 2017;52(7):434–440. doi: 10.1097/RLI.0000000000000358. - DOI - PubMed
    1. Marchesseau S, Ho JX, Totman JJ. Influence of the short-axis cine acquisition protocol on the cardiac function evaluation: a reproducibility study. Eur J Radiol Open. 2016;3:60–66. doi: 10.1016/j.ejro.2016.03.003. - DOI - PMC - PubMed
    1. Bernard O, Lalande A, Zotti C, Cervenansky F, Yang X, Heng P-A, Cetin I, Lekadir K, Camara O, Ballester MAG, et al. Deep learning techniques for automatic mri cardiac multi-structures segmentation and diagnosis: Is the problem solved? IEEE Trans Med Imaging. 2018;99:1. - PubMed

Publication types