

cAMP-Dependent Signaling Restores AP Firing in Dormant SA Node Cells via Enhancement of Surface Membrane Currents and Calcium Coupling
- PMID: 33897445
- PMCID: PMC8063038
- DOI: 10.3389/fphys.2021.596832
cAMP-Dependent Signaling Restores AP Firing in Dormant SA Node Cells via Enhancement of Surface Membrane Currents and Calcium Coupling
Abstract
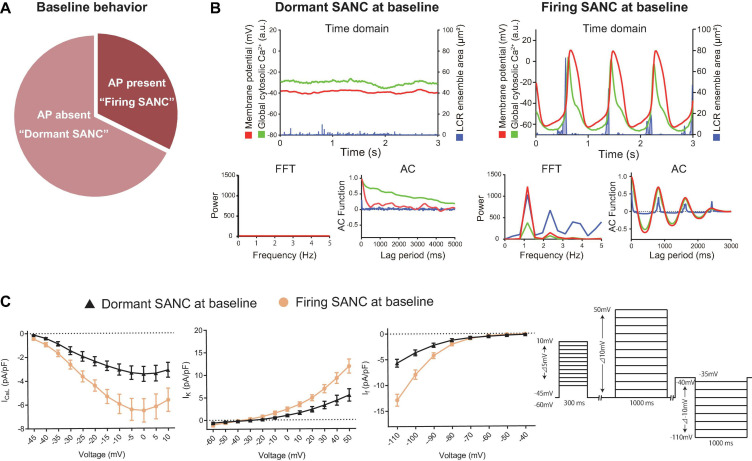
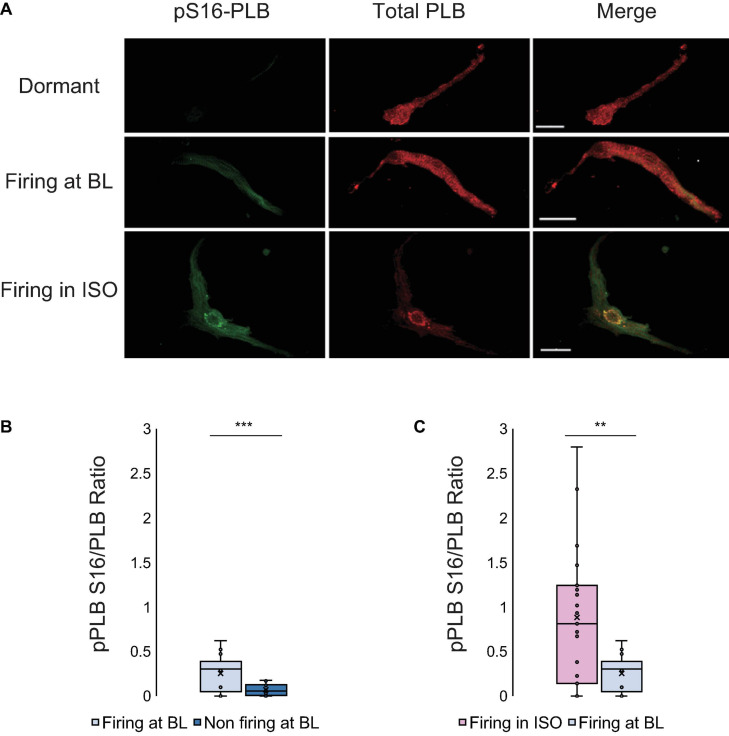
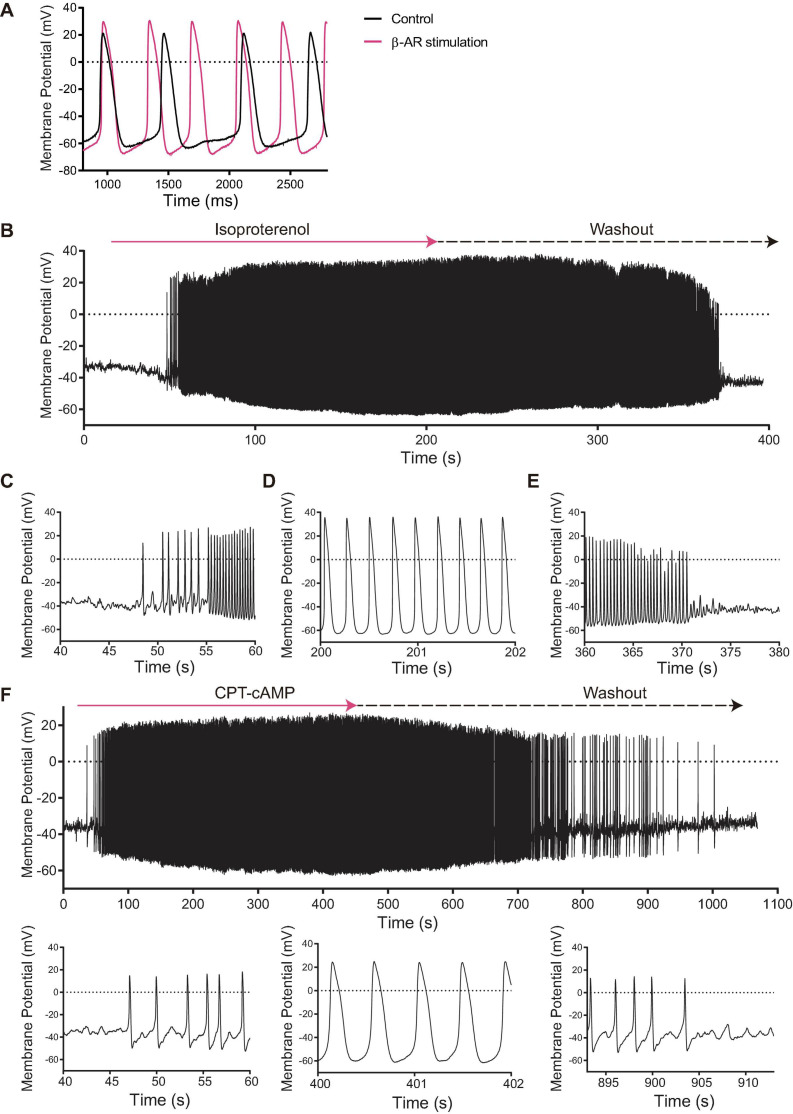
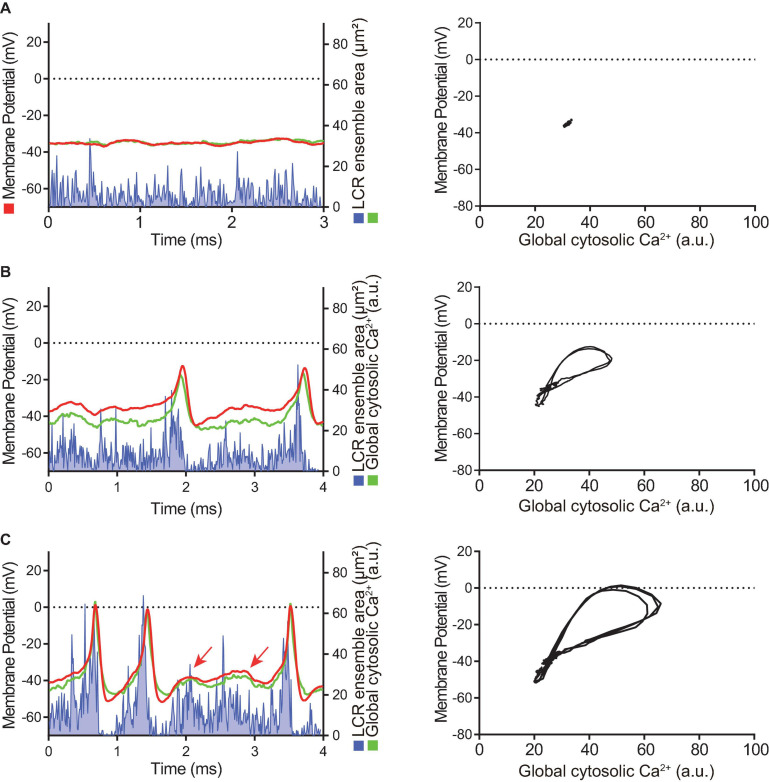
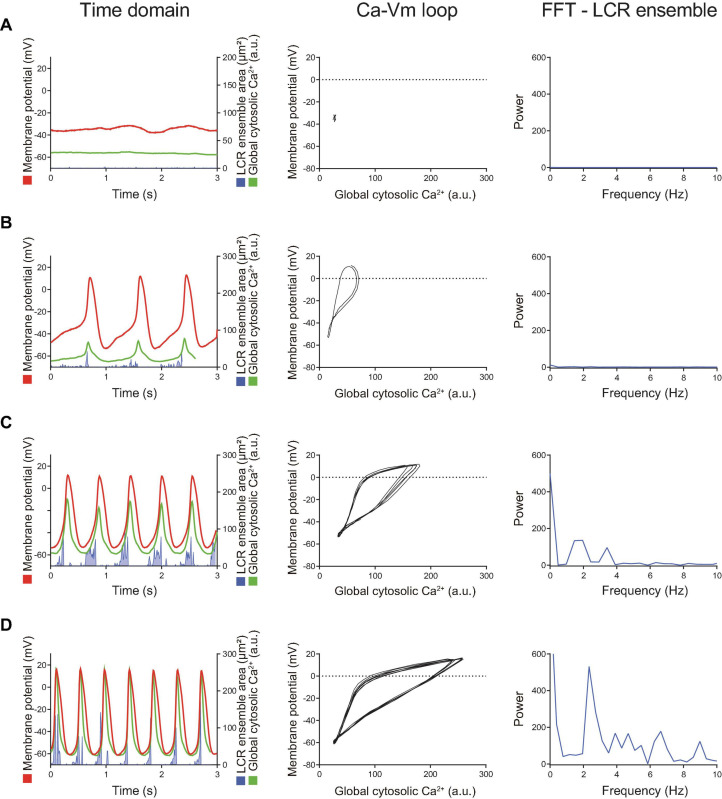
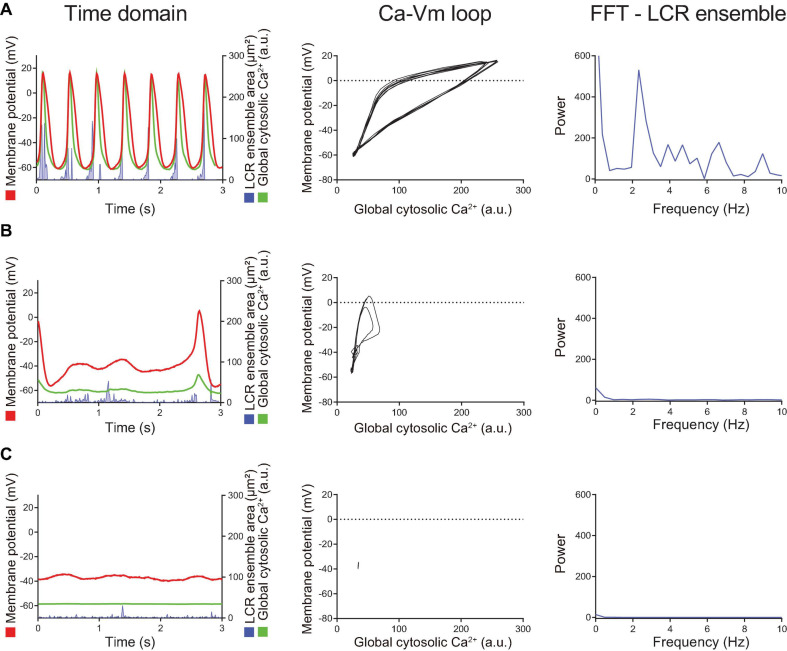
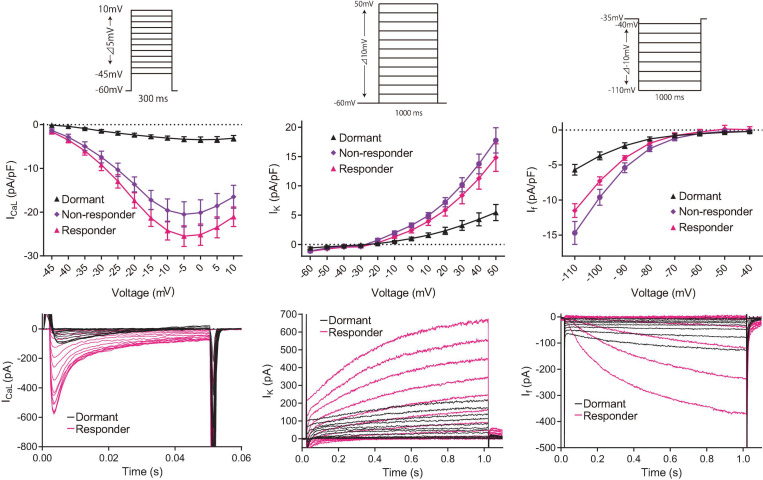
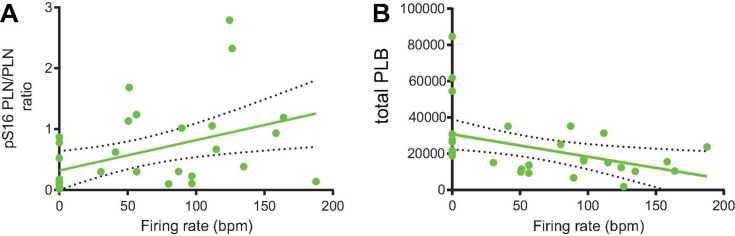
Action potential (AP) firing rate and rhythm of sinoatrial nodal cells (SANC) are controlled by synergy between intracellular rhythmic local Ca2+ releases (LCRs) ("Ca2+ clock") and sarcolemmal electrogenic mechanisms ("membrane clock"). However, some SANC do not fire APs (dormant SANC). Prior studies have shown that β-adrenoceptor stimulation can restore AP firing in these cells. Here we tested whether this relates to improvement of synchronization of clock coupling. We characterized membrane potential, ion currents, Ca2+ dynamics, and phospholamban (PLB) phosphorylation, regulating Ca2+ pump in enzymatically isolated single guinea pig SANC prior to, during, and following β-adrenoceptor stimulation (isoproterenol) or application of cell-permeant cAMP (CPT-cAMP). Phosphorylation of PLB (Serine 16) was quantified in the same cells following Ca2+ measurement. In dormant SANC LCRs were small and disorganized at baseline, membrane potential was depolarized (-38 ± 1 mV, n = 46), and ICaL, If, and IK densities were smaller vs SANC firing APs. β-adrenoceptor stimulation or application of CPT-cAMP led to de novo spontaneous AP generation in 44 and 46% of dormant SANC, respectively. The initial response was an increase in size, rhythmicity and synchronization of LCRs, paralleled with membrane hyperpolarization and small amplitude APs (rate ∼1 Hz). During the transition to steady-state AP firing, LCR size further increased, while LCR period shortened. LCRs became more synchronized resulting in the growth of an ensemble LCR signal peaked in late diastole, culminating in AP ignition; the rate of diastolic depolarization, AP amplitude, and AP firing rate increased. ICaL, IK, and If amplitudes in dormant SANC increased in response to β-adrenoceptor stimulation. During washout, all changes reversed in order. Total PLB was higher, but the ratio of phosphorylated PLB (Serine 16) to total PLB was lower in dormant SANC. β-adrenoceptor stimulation increased this ratio in AP-firing cells. Thus, transition of dormant SANC to AP firing is linked to the increased functional coupling of membrane and Ca2+ clock proteins. The transition occurs via (i) an increase in cAMP-mediated phosphorylation of PLB accelerating Ca2+ pumping, (ii) increased spatiotemporal LCR synchronization, yielding a larger diastolic LCR ensemble signal resulting in an earlier increase in diastolic INCX; and (iii) increased current densities of If, ICaL, and IK.
Keywords: cardiac automaticity; coupled-oscillator system; dormant cells; pacemaker mechanism; sinoatrial nodal cells.
Copyright © 2021 Tsutsui, Florio, Yang, Wirth, Yang, Kim, Ziman, Bychkov, Monfredi, Maltsev and Lakatta.
Conflict of interest statement
The authors declare that the research was conducted in the absence of any commercial or financial relationships that could be construed as a potential conflict of interest.
Figures
Similar articles
-
Heterogeneity of calcium clock functions in dormant, dysrhythmically and rhythmically firing single pacemaker cells isolated from SA node.Cell Calcium. 2018 Sep;74:168-179. doi: 10.1016/j.ceca.2018.07.002. Epub 2018 Jul 10. Cell Calcium. 2018. PMID: 30092494 Free PMC article.
-
Spontaneous, local diastolic subsarcolemmal calcium releases in single, isolated guinea-pig sinoatrial nodal cells.PLoS One. 2017 Sep 25;12(9):e0185222. doi: 10.1371/journal.pone.0185222. eCollection 2017. PLoS One. 2017. PMID: 28945810 Free PMC article.
-
Phosphoprotein Phosphatase 1 but Not 2A Activity Modulates Coupled-Clock Mechanisms to Impact on Intrinsic Automaticity of Sinoatrial Nodal Pacemaker Cells.Cells. 2021 Nov 10;10(11):3106. doi: 10.3390/cells10113106. Cells. 2021. PMID: 34831329 Free PMC article.
-
Unique Ca2+-Cycling Protein Abundance and Regulation Sustains Local Ca2+ Releases and Spontaneous Firing of Rabbit Sinoatrial Node Cells.Int J Mol Sci. 2018 Jul 25;19(8):2173. doi: 10.3390/ijms19082173. Int J Mol Sci. 2018. PMID: 30044420 Free PMC article. Review.
-
Ca2+/Calmodulin-Dependent Protein Kinase II (CaMKII) Regulates Basal Cardiac Pacemaker Function: Pros and Cons.Cells. 2024 Dec 25;14(1):3. doi: 10.3390/cells14010003. Cells. 2024. PMID: 39791704 Free PMC article. Review.
Cited by
-
The Role of POPDC Proteins in Cardiac Pacemaking and Conduction.J Cardiovasc Dev Dis. 2021 Nov 23;8(12):160. doi: 10.3390/jcdd8120160. J Cardiovasc Dev Dis. 2021. PMID: 34940515 Free PMC article. Review.
-
What makes the sinoatrial node tick? A question not for the faint of heart.Philos Trans R Soc Lond B Biol Sci. 2023 Jun 19;378(1879):20220180. doi: 10.1098/rstb.2022.0180. Epub 2023 May 1. Philos Trans R Soc Lond B Biol Sci. 2023. PMID: 37122227 Free PMC article. Review.
-
Genetics of sinoatrial node function and heart rate disorders.Dis Model Mech. 2023 May 1;16(5):dmm050101. doi: 10.1242/dmm.050101. Epub 2023 May 17. Dis Model Mech. 2023. PMID: 37194974 Free PMC article. Review.
-
Paradigm shift: new concepts for HCN4 function in cardiac pacemaking.Pflugers Arch. 2022 Jul;474(7):649-663. doi: 10.1007/s00424-022-02698-4. Epub 2022 May 13. Pflugers Arch. 2022. PMID: 35556164 Free PMC article. Review.
-
Disorder in Ca2+ release unit locations confers robustness but cuts flexibility of heart pacemaking.J Gen Physiol. 2022 Sep 5;154(9):e202113061. doi: 10.1085/jgp.202113061. Epub 2022 Aug 9. J Gen Physiol. 2022. PMID: 35943725 Free PMC article.
References
-
- Bychkov R., Juhaszova M., Tsutsui K., Coletta C., Stern M. D., Maltsev V. A., et al. (2020). Synchronized cardiac impulses emerge from multi-scale, heterogeneous local calcium signals within and among cells of heart pacemaker tissue. JACC Clin. Electrophysiol. 6 907–931. 10.1016/j.jacep.2020.06.022 - DOI - PMC - PubMed
LinkOut - more resources
Full Text Sources
Other Literature Sources
Molecular Biology Databases
Miscellaneous