

Respiratory Induced Modulation in f-Wave Characteristics During Atrial Fibrillation
- PMID: 33897462
- PMCID: PMC8060635
- DOI: 10.3389/fphys.2021.653492
Respiratory Induced Modulation in f-Wave Characteristics During Atrial Fibrillation
Abstract
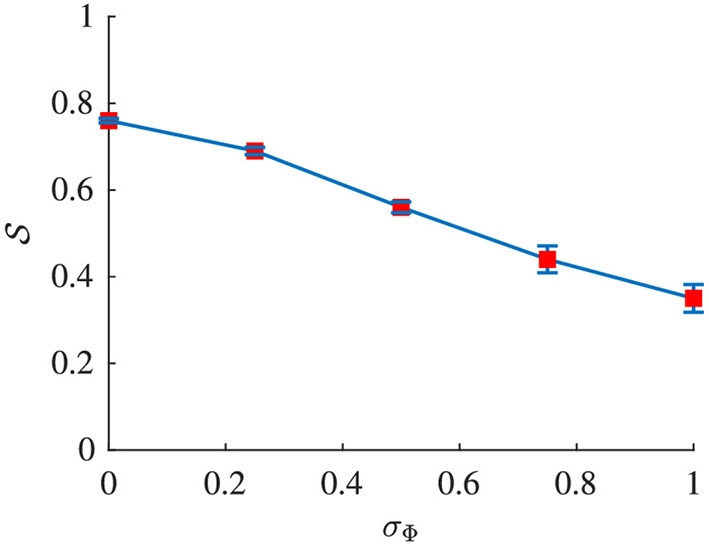
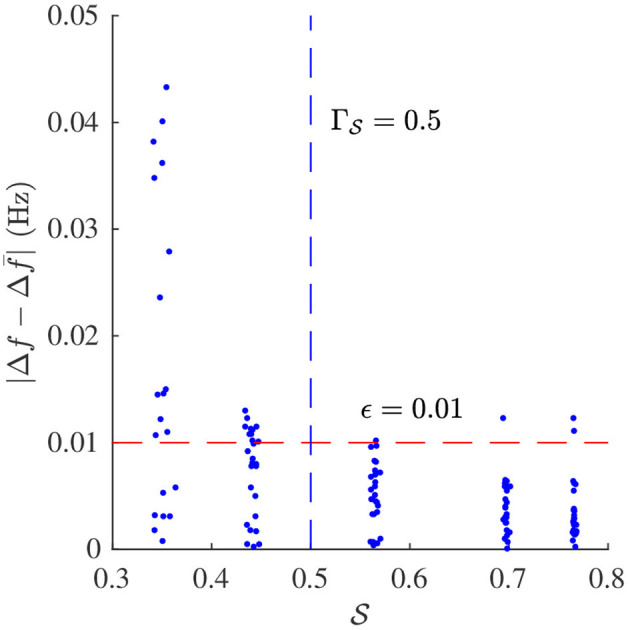
The autonomic nervous system (ANS) is an important factor in cardiac arrhythmia, and information about ANS activity during atrial fibrillation (AF) may contribute to personalized treatment. In this study we aim to quantify respiratory modulation in the f-wave frequency trend from resting ECG. First, an f-wave signal is extracted from the ECG by QRST cancelation. Second, an f-wave model is fitted to the f-wave signal to obtain a high resolution f-wave frequency trend and an index for signal quality control ( ). Third, respiratory modulation in the f-wave frequency trend is extracted by applying a narrow band-pass filter. The center frequency of the band-pass filter is determined by the respiration rate. Respiration rate is estimated from a surrogate respiration signal, obtained from the ECG using homomorphic filtering. Peak conditioned spectral averaging, where spectra of sufficient quality from different leads are averaged, is employed to obtain a robust estimate of the respiration rate. The envelope of the filtered f-wave frequency trend is used to quantify the magnitude of respiratory induced f-wave frequency modulation. The proposed methodology is evaluated using simulated f-wave signals obtained using a sinusoidal harmonic model. Results from simulated signals show that the magnitude of the respiratory modulation is accurately estimated, quantified by an error below 0.01 Hz, if the signal quality is sufficient ( ). The proposed method was applied to analyze ECG data from eight pacemaker patients with permanent AF recorded at baseline, during controlled respiration, and during controlled respiration after injection of atropine, respectively. The magnitude of the respiratory induce f-wave frequency modulation was 0.15 ± 0.01, 0.18 ± 0.02, and 0.17 ± 0.03 Hz during baseline, controlled respiration, and post-atropine, respectively. Our results suggest that parasympathetic regulation affects the magnitude of respiratory induced f-wave frequency modulation.
Keywords: ECG processing; atrial fibrillation; autonomic nervous system; f-wave frequency; parasympathetic regulation; respiratory modulation.
Copyright © 2021 Abdollahpur, Holmqvist, Platonov and Sandberg.
Conflict of interest statement
The authors declare that the research was conducted in the absence of any commercial or financial relationships that could be construed as a potential conflict of interest.
Figures


References
-
- Abdollahpur M., Holmqvist F., Platonov P. G., Sandberg F. (2020). Respiratory modulation in permanent atrial fibrillation, in 2020 Computing in Cardiology (Rimini: ), 1–4. 10.22489/CinC.2020.182 - DOI
LinkOut - more resources
Full Text Sources
Other Literature Sources