

Maximal Fat Oxidation During Exercise Is Already Impaired in Pre-pubescent Children With Type 1 Diabetes Mellitus
- PMID: 33897473
- PMCID: PMC8062964
- DOI: 10.3389/fphys.2021.664211
Maximal Fat Oxidation During Exercise Is Already Impaired in Pre-pubescent Children With Type 1 Diabetes Mellitus
Abstract
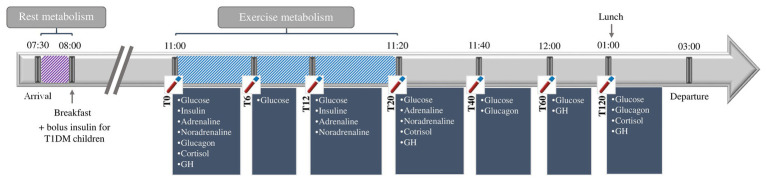
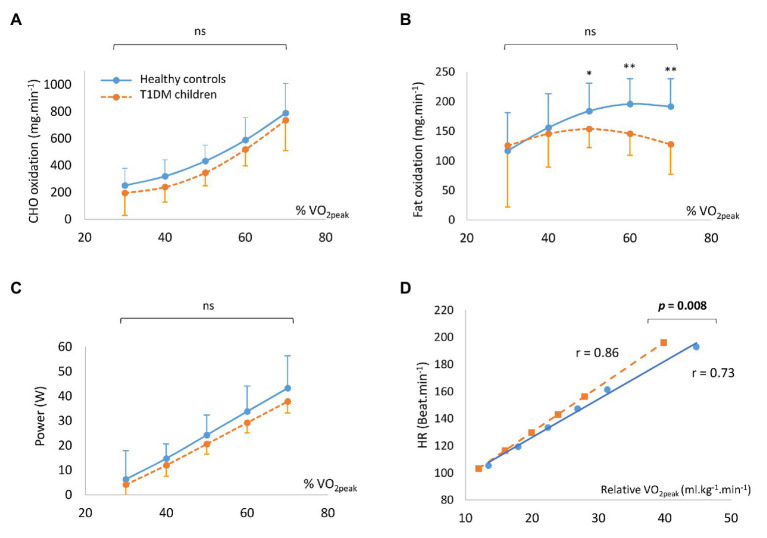
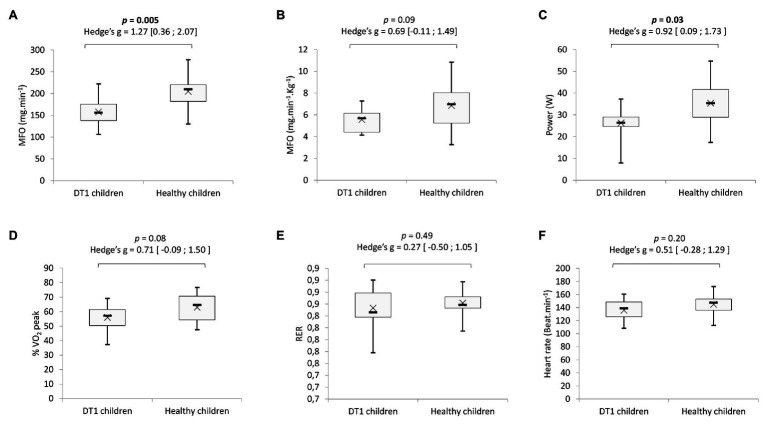
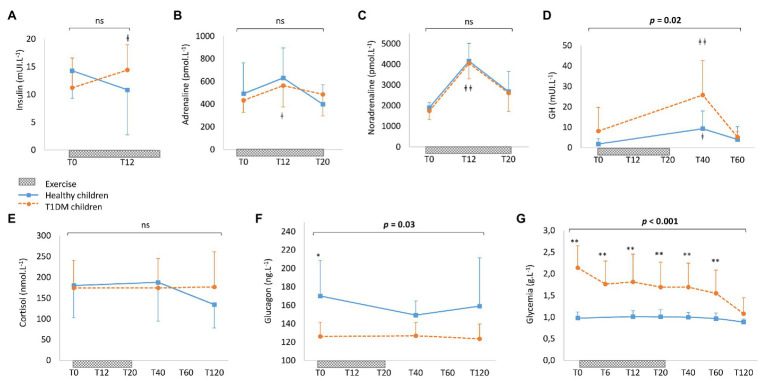
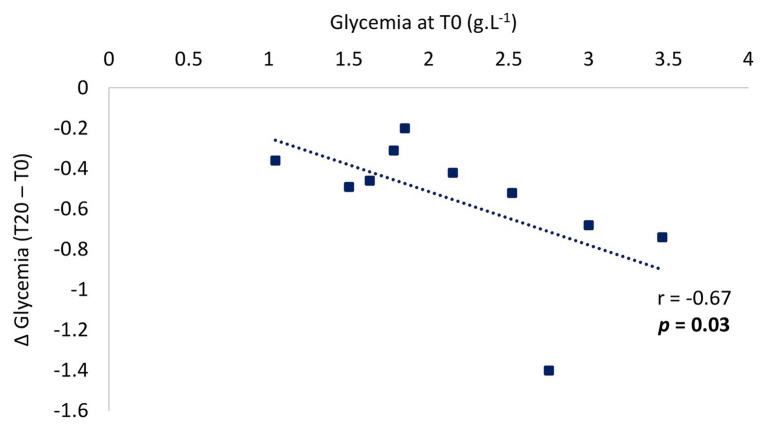
Objective: We evaluated substrate utilization during submaximal exercise, together with glycemic responses and hormonal counter-regulation to exercise, in children with type 1 diabetes mellitus (T1DM). Methods: Twelve pre-pubescent children with T1DM and 12 healthy children were matched by sex and age. Participants completed a submaximal incremental exercise test to determine their fat and carbohydrate oxidation rates by indirect calorimetry. Levels of glycemia, glucagon, cortisol, growth hormone, noradrenaline, adrenaline, and insulin were monitored until 120 min post-exercise. Results: Absolute peak oxygen uptake (VO2 peak) was significantly lower in the children with T1DM than in the healthy controls (1131.4 ± 102.5 vs. 1383.0 ± 316.6 ml.min-1, p = 0.03). Overall carbohydrate and lipid oxidation rates were the same in the two groups, but for exercise intensities, higher than 50% of VO2 peak, fat oxidation rate was significantly lower in the children with T1DM. The absolute maximal lipid oxidation rate was significantly lower in the T1DM children (158.1 ± 31.6 vs. 205.4 ± 42.1 mg.min-1, p = 0.005), and they reached a significantly lower exercise power than the healthy controls (26.4 ± 1.2 vs. 35.4 ± 3.3 W, p = 0.03). Blood glucose responses to exercise were negatively correlated with pre-exercise blood glucose concentrations (r = -0.67; p = 0.03). Conclusion: Metabolic and hormonal responses during sub-maximal exercise are impaired in young children with T1DM.
Keywords: glucose metabolism; glycemia; metabolic; pediatric; physical activity.
Copyright © 2021 Fel, Rochette, Walther, Echaubard, Pereira, Merlin, Terral and Duché.
Conflict of interest statement
The authors declare that the research was conducted in the absence of any commercial or financial relationships that could be construed as a potential conflict of interest.
Figures
References
-
- Brun J.-F., Varlet-Marie E., Jrme A., Mercier J. (2012). “Measurement and physiological relevance of the maximal lipid oxidation rate during exercise (LIPOXmax)” in An international perspective on topics in sports medicine and sports injury. ed. Zaslav K. R. (London: InTech; ).
LinkOut - more resources
Full Text Sources
Other Literature Sources
Miscellaneous