. 2021 Apr 7:12:595746.
doi: 10.3389/fimmu.2021.595746. eCollection 2021.

Immune Subtyping in Latent Tuberculosis

Affiliations

Immune Subtyping in Latent Tuberculosis

Ushashi Banerjee et al. Front Immunol. .

Abstract

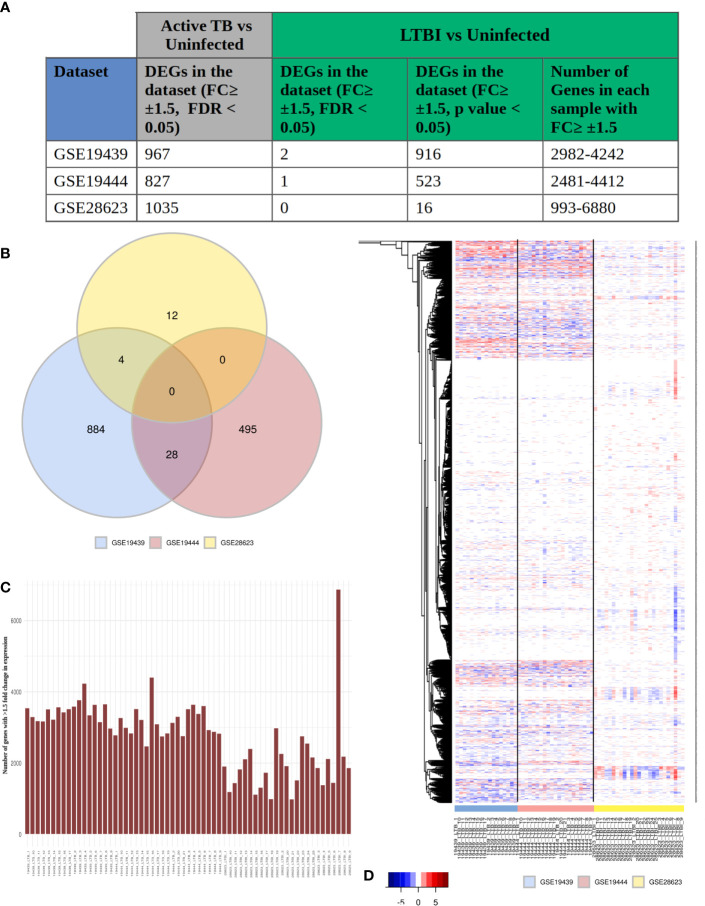
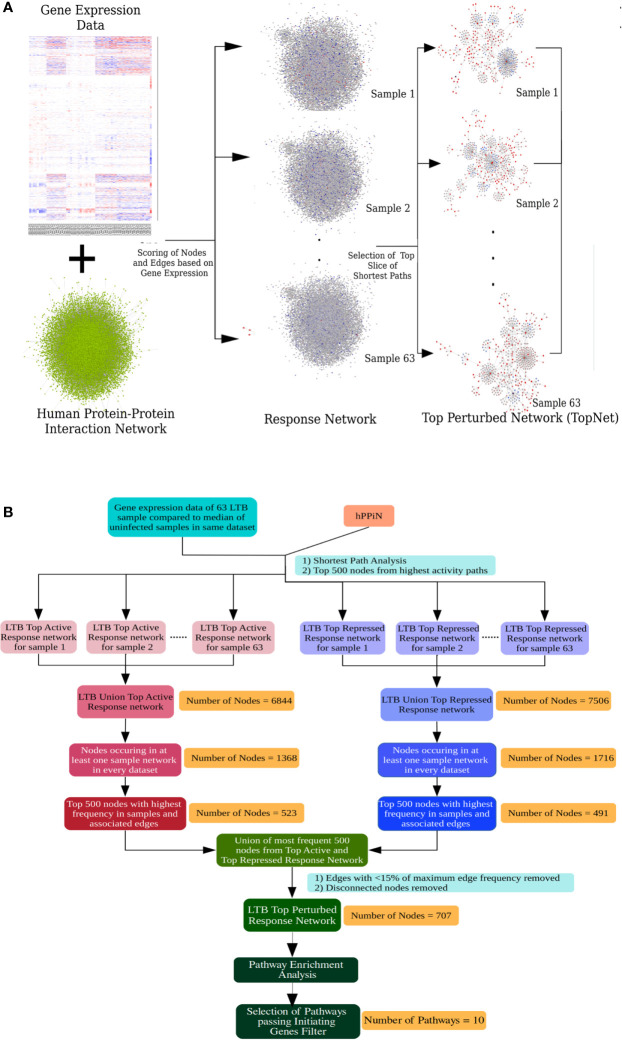
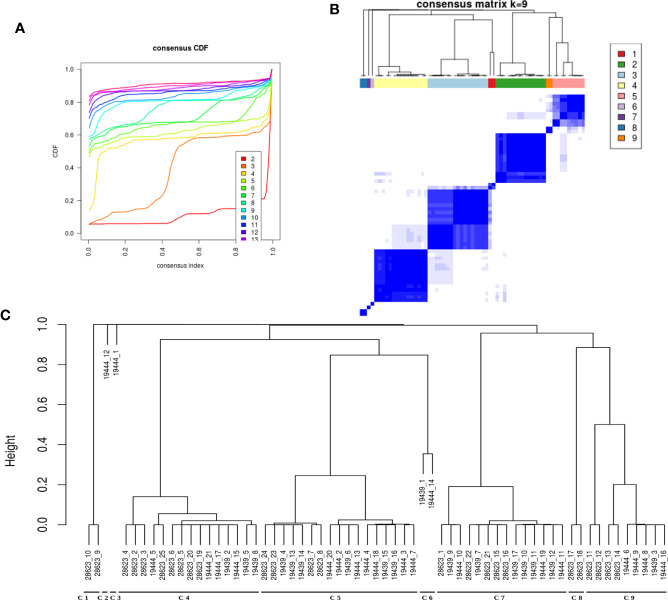
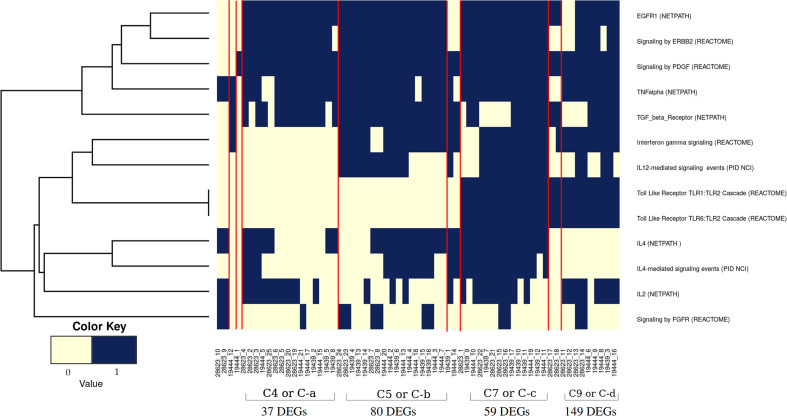
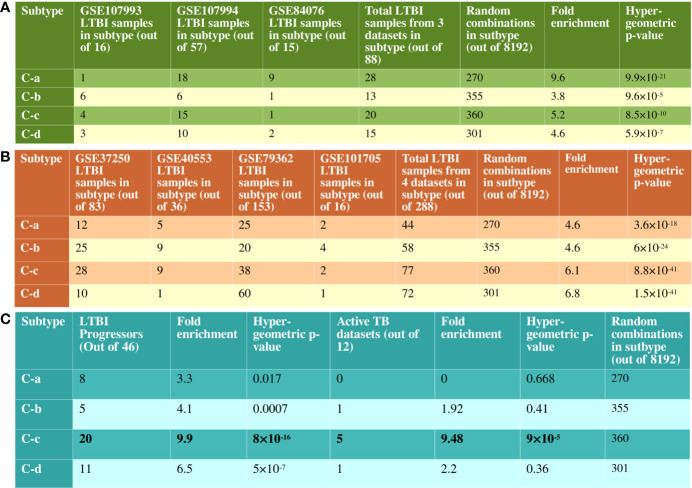
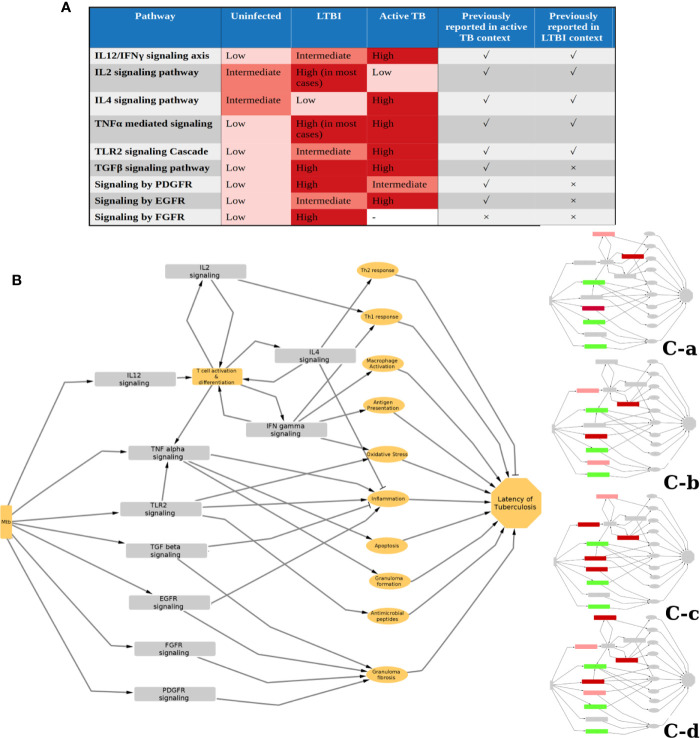
Latent tuberculosis infection (LTBI) poses a major roadblock in the global effort to eradicate tuberculosis (TB). A deep understanding of the host responses involved in establishment and maintenance of TB latency is required to propel the development of sensitive methods to detect and treat LTBI. Given that LTBI individuals are typically asymptomatic, it is challenging to differentiate latently infected from uninfected individuals. A major contributor to this problem is that no clear pattern of host response is linked with LTBI, as molecular correlates of latent infection have been hard to identify. In this study, we have analyzed the global perturbations in host response in LTBI individuals as compared to uninfected individuals and particularly the heterogeneity in such response, across LTBI cohorts. For this, we constructed individualized genome-wide host response networks informed by blood transcriptomes for 136 LTBI cases and have used a sensitive network mining algorithm to identify top-ranked host response subnetworks in each case. Our analysis indicates that despite the high heterogeneity in the gene expression profiles among LTBI samples, clear patterns of perturbation are found in the immune response pathways, leading to grouping LTBI samples into 4 different immune-subtypes. Our results suggest that different subnetworks of molecular perturbations are associated with latent tuberculosis.

Keywords: genome-wide network analysis; heterogeneity; immune subtypes; latent tuberculosis; transcriptomics.


Conflict of interest statement

NC is a co-founder of the companies qBiome Research Pvt Ltd and HealthSeq Precision Medicine Pvt Ltd. They had no role in this manuscript. The remaining authors declare that the research was conducted in the absence of any commercial or financial relationships that could be construed as a potential conflict of interest.

Figures

Figure 1
Figure 1
LTBI patients have a highly heterogeneous gene expression profile. (A) The three selected datasets GSE19439, GSE19444 and GSE28623 showed a significant number of genes to be differentially regulated in active TB condition but very few DEGs in LTBI when compared to uninfected cases with conventional thresholds of FDR ≤0.05 and fold change ≥ ± 1.5 criteria. More number of genes could be considered as DEGs if the criteria are modified to unadjusted p value ≤0.05 and fold change ≥ ± 1.5. However each of these samples contained thousands of genes with ≥ ± 1.5 fold change in gene expression compared to uninfected individuals. (B) Venn diagram shows that there are no common DEGs in LTBI condition (unadjusted p value ≤0.05, fold change ≥ ± 1.5) between all three datasets. The number of common DEGs between any two datasets are also very few. (C) Each LTBI sample contained over 1000 genes with ≥ ± 1.5 fold change, showing a significant difference between the gene expression profile of the individual samples from uninfected cases. (D) Heatmap shows the fold change of expression of the genes in each individual LTBI sample that showed (≥ ± 1.5) fold change in any sample (union of all genes from Figure 1A , column 5). White signifies no significant fold change (≤ ± 1.5), red stands of upregulation in gene expression and blue shows downregulation. It is clear that although all the samples show significant change in the gene expression profiles, it is not consistent across the samples, suggesting a heterogeneous response to LTBI in humans.
Figure 2
Figure 2
Response network analysis workflow. (A) Schematic representation of the individualized protein-protein interaction network analysis workflow used in this work. (B) Workflow to identify the most frequently perturbed immune response pathways in LTBI patients.
Figure 3
Figure 3
LTBI samples can be divided into groups based on pathway perturbation. (A, B) The LTBI samples can be divided into 9 substantially stable clusters based on their pathway perturbation patterns. The cumulative distribution function (CDF) plot shows that CDF reaches an approximate maximum as early as k=9 cluster. The clusters are significantly different from each other. 4 of the clusters contain the majority of the samples, whereas the few other samples show a highly varied pathway profile. (C) The dendrogram shows the samples in each cluster. The clustering was not biased by cohort or dataset as each of the large clusters contains samples from different datasets.
Figure 4
Figure 4
Pathway perturbation pattern in sample clusters. The pattern of the perturbations in each sample arranged according to their clusters (as mentioned in Figure 3C ) is depicted in a binary scoring manner. Blue signifies that the pathway is perturbed in the patient and light yellow signifies no perturbation. Red lines demarcate the clusters.
Figure 5
Figure 5
Validation of clustering pattern with independent RNAseq datasets. (A) There are 8192 possible combinations of binary scoring patterns for the 13 pathways used for clustering analysis. 14 out of 16 samples from GSE107993, 49 out of 57 samples from GSE107994 and 13 out of 15 samples from GSE84076 clustered into one of C-a, C-b, C-c or C-d. This is significantly more enriched than the random possibilities, validating the clustering pattern of pathways. (B) Similarly, in datasets without uninfected samples, 251 out of 288 samples clustered with one of the recognized immune subtypes. Notably, in GSE79362, 153 non-progressors were analyzed and 60 of them clustered with C-d, showing a bias for non-progressor for this subtype. (C) 44 of the 46 LTBI progressor samples from GSE79362 and GSE107994 clustered one of the 4 subtypes, with a clear bias towards C-c. 5 of the 12 active TB datasets also showed immune perturbation patterns similar to the subtype C-c.
Figure 6
Figure 6
Status and function of IPLTB in uninfected (HC), LTBI and active TB patients. (A) The extent of activity of the IPLTB pathways is active TB condition compared to HC and LTBI was analyzed using a similar network analysis method. From this analysis, as well as literature reports, the status of these pathways in the 3 conditions, HC, LTBI and active TB, are summarized in a semiquantitative manner. IL12/IFNγ, TLR2 and EGFR mediated signaling pathways were found to be more active in LTBI compared to HC and further activated in active TB. IL2 and IL4 showed an opposite trend of activity in LTBI and active TB. TGF and TNF were more active in LTBI and active TB compared to uninfected, but the difference between LTBI and active TB cannot be commented upon from our analysis. PDGFR mediated pathway was observed to be more active in both LTBI and active compared to HC, but the extent of activity was higher in LTBI. FGFR mediated signaling was not observed to be one of the top perturbed pathways in active TB condition. The pathways previously reported to have an important function in the context of active and LTBI are marked with a tick, whereas no previous report is marked with a cross. (B) The possible effects of the IPLTB on the host immune system are drawn as a simplified schematic. The pathways can be linked to inflammation, macrophage activation, antimycobacterial effects, granuloma formation and fibrosis, etc., which can finally help in maintaining TB latency. The different clusters use some of the pathways from IPLTB, as shown in insets, to achieve TB latency. Red and green correspond to perturbed activities, in comparison to HC. Green denotes the pathways perturbed in all the clusters, whereas red shows pathways perturbed in different clusters. Dark red signifies that most of the members of the cluster show the perturbation whereas light red signifies about half of the members to show the perturbation.

References

    1. WHO . WHO | Global tuberculosis report 2018. (2018).
    1. Ai JW, Ruan QL, Liu QH, Zhang WH. Updates on the risk factors for latent tuberculosis reactivation and their managements. Emerging Microbes Infections (2016) 5:e10. 10.1038/emi.2016.10 - DOI - PMC - PubMed
    1. Flynn JL, Chan J. Tuberculosis: latency and reactivation. Infection Immun (2001) 69:4195–201. 10.1128/IAI.69.7.4195-4201.2001 - DOI - PMC - PubMed
    1. Drain PK, Bajema KL, Dowdy D, Dheda K, Naidoo K, Schumacher SG, et al. . Incipient and Subclinical Tuberculosis: a Clinical Review of Early Stages and Progression of Infection. Clin Microbiol Rev (2018) 31:1–24. 10.1128/CMR.00021-18 - DOI - PMC - PubMed
    1. Achkar JM, Jenny-Avital ER. Incipient and Subclinical Tuberculosis: Defining Early Disease States in the Context of Host Immune Response. J Infect Dis (2011) 204:S1179–86. 10.1093/infdis/jir451 - DOI - PMC - PubMed

Publication types

MeSH terms