. 2021 Apr 9:12:649634.
doi: 10.3389/fpls.2021.649634. eCollection 2021.

Cotranscriptional and Posttranscriptional Features of the Transcriptome in Soybean Shoot Apex and Leaf

Affiliations

Cotranscriptional and Posttranscriptional Features of the Transcriptome in Soybean Shoot Apex and Leaf

Jiafu Zhu et al. Front Plant Sci. .

Abstract

Transcription is the first step of central dogma, in which the genetic information stored in DNA is copied into RNA. In addition to mature RNA sequencing (RNA-seq), high-throughput nascent RNA assays have been established and applied to provide detailed transcriptional information. Here, we present the profiling of nascent RNA from trifoliate leaves and shoot apices of soybean. In combination with nascent RNA (chromatin-bound RNA, CB RNA) and RNA-seq, we found that introns were largely spliced cotranscriptionally. Although alternative splicing (AS) was mainly determined at nascent RNA biogenesis, differential AS between the leaf and shoot apex at the mature RNA level did not correlate well with cotranscriptional differential AS. Overall, RNA abundance was moderately correlated between nascent RNA and mature RNA within each tissue, but the fold changes between the leaf and shoot apex were highly correlated. Thousands of novel transcripts (mainly non-coding RNA) were detected by CB RNA-seq, including the overlap of natural antisense RNA with two important genes controlling soybean reproductive development, FT2a and Dt1. Taken together, we demonstrated the adoption of CB RNA-seq in soybean, which may shed light on gene expression regulation of important agronomic traits in leguminous crops.

Keywords: chromatin-bound RNA; co-transcriptional splicing; nascent RNA; non-coding RNA; soybean.


Conflict of interest statement

The authors declare that the research was conducted in the absence of any commercial or financial relationships that could be construed as a potential conflict of interest.

Figures

FIGURE 1
FIGURE 1
Overview of the experimental design and features of nascent RNA and mRNA. (A) Scheme of chromatin-bound RNA sequencing (CB RNA-seq) and polyA RNA-seq. (B) Principal component analysis (PCA) of gene expression of biological triplicates from CB RNA-seq and polyA RNA-seq. The triangles and dots represent CB RNA-seq and polyA RNA-seq, respectively. Red, 10-day apex; blue, 15-day apex; green, 15-day leaf. (C) Comparison of the gene intron/exon ratio between CB RNA-seq and polyA RNA-seq (left, 10-day apex; middle, 15-day apex; right, 15-day leaf). ***p < 0.001, Wilcoxon test. (D) Screenshot of IGV showing the read distribution of CB RNA-seq and polyA RNA-seq on the Glyma.02G231800 gene. Blue, CB RNA-seq; red, polyA RNA-seq. (E) Profiles of read density of CB RNA-seq (left) and polyA RNA-seq (right) for the 2-kb up- and downstream transcription start site (TSS) and transcription end site (TES). Lines represent the mean value of read density. Ten-day apex, 15-day apex, and 15-day leaf samples are indicated in red, blue, and green, respectively.
FIGURE 2
FIGURE 2
CB RNA-seq detected cotranscriptional splicing processing. (A) Calculation of percent of intron retention (PIR). 5′SS, 5′ splice site; 3′SS, 3′ splice site. (B) Boxplots of the overall PIR of CB RNA and polyA RNA for 10D_apex (left), 15D_apex (middle), and 15D_leaf (right). ***p < 0.001, Wilcoxon test. (C,D) Boxplots of PIR levels of introns of different sizes (C) and distances from the transcription end site (TES) (D). (E–G) Boxplots of the average PIR from genes with different exon numbers (E), gene lengths (F), and expression levels (G). For (C–G), the Wilcoxon test was used to test the difference in PIRs for adjacent groups. All tests were highly significant (p < 0.001) unless symbols were assigned (*p < 0.05; NS, p > 0.05).
FIGURE 3
FIGURE 3
Cotranscriptional splicing efficiency is correlated with certain histone modifications. Levels (y-axis) of different histone modifications (H3K27me3, H3K4me1, H3K4me3, H3K36me3, H3K56ac, and H2A.Z) along introns and the flanking exons (x-axis). Lines with different colors indicate intron groups divided according to the PIR. The ChIP-seq data of different histone modifications in leaf tissue were adopted from a previous study (Supplementary Table 1; Lu et al., 2019).
FIGURE 4
FIGURE 4
Alternative splicing events are likely determined cotranscriptionally. (A) Diagram showing the different alternative splicing events analyzed. (B) Scatter plots showing the correlation between the percent spliced-in (PSI) values of CB RNA and polyA RNA of different AS events in 15-day apex tissues. Smooth spline curves were fitted (solid red lines), and 95% confidence intervals were plotted (dashed red lines). Spearman’s correlation coefficients are presented in the plots. Insets show boxplots of PSIs for AS events at the CB RNA and polyA RNA levels.
FIGURE 5
FIGURE 5
Differential AS events detected by CB RNA and polyA RNA between the 15-day apex and leaf tissues. (A) Venn diagram illustrating the different AS events analyzed using CB RNA and polyA RNA. (B) Scatter plots show the correlation of ΔPSI of CB RNA (ΔPSICB) and polyA RNA (ΔPSImRNA) for AS events. Spearman correlations are indicated.
FIGURE 6
FIGURE 6
Comparison of the expression levels of CB RNA and polyA RNA. (A) Scatter plot of gene TPM values (in log2) detected by CB RNA-seq and polyA RNA-seq in a 15-day apex. Spearman correlation and linear regression (solid line) equations are shown. Stable and unstable transcripts are represented by red and blue dots, respectively. (B) Gene Ontology (GO) enrichment of genes with unstable (upper) and stable RNA (bottom). (C) Venn diagrams show the number of genes with higher expression levels in 15-day apexes (left) and 15-day leaves (right) at the CB RNA and polyA RNA levels. These genes were detected by comparing DEGs between 15-day apex and 15-day leaf tissues (| fold change| > 2, q-value < 0.05). (D) Scatter plot of fold change of gene expression (15-day apex vs. 15-day leaf) detected by CB RNA-seq and polyA RNA-seq. The Spearman correlation value is presented.
FIGURE 7
FIGURE 7
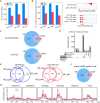
CB RNA-seq detected more ncRNA transcripts than polyA RNA-seq. (A) Number of active ncRNAs detected by CB RNA-seq and polyA RNA-seq. (B) Number of active antisense transcription signals detected by CB RNA-seq and polyA RNA-seq (left). Two examples of ncRNAs are shown in the IGV screenshot (right). (C) Venn diagrams show the novel transcripts (upper) or the related loci (bottom) detected by CB RNA-seq and polyA RNA-seq. (D) UpSet plot shows the number of ncRNAs defined by CNCI and FEELnc in CB RNA and polyA RNA. (E) Venn diagrams show the overlapping ncRNA genes of the shoot apex and leaf tissues at the CB RNA (left) and polyA RNA levels (right). (F) Venn diagram showing three types of active ncRNAs in the leaves. Group I, only detected by CB RNA; group II, detected by both; group III, only detected by polyA RNA. (G) The average distribution of different histone modifications in each ncRNA group.

Similar articles

Cited by

References

    1. Aebi M., Hornig H., Padgett R. A., Reiser J., Weissmann C. (1986). Sequence requirements for splicing of higher eukaryotic nuclear pre-mRNA. Cell 47 555–565. 10.1016/0092-8674(86)90620-3 - DOI - PubMed
    1. Arabidopsis Genome Initiative (2000). Analysis of the genome sequence of the flowering plant Arabidopsis thaliana. Nature 408 796–815. 10.1038/35048692 - DOI - PubMed
    1. Aslanzadeh V., Huang Y., Sanguinetti G., Beggs J. D. (2018). Transcription rate strongly affects splicing fidelity and cotranscriptionality in budding yeast. Genome Res. 28 203–213. 10.1101/gr.225615.117 - DOI - PMC - PubMed
    1. Baralle F. E., Giudice J. (2017). Alternative splicing as a regulator of development and tissue identity. Nat. Rev. Mol. Cell Biol. 18 437–451. 10.1038/nrm.2017.27 - DOI - PMC - PubMed
    1. Baurén G., Wieslander L. (1994). Splicing of Balbiani ring 1 gene pre-mRNA occurs simultaneously with transcription. Cell 76 183–192. 10.1016/0092-8674(94)90182-1 - DOI - PubMed