

doi: 10.3389/fgene.2021.619056.
eCollection 2021.
Dynamic Transcriptome Sequencing of Bovine Alphaherpesvirus Type 1 and Host Cells Carried Out by a Multi-Technique Approach
Affiliations
- PMID: 33897757
- PMCID: PMC8059770
- DOI: 10.3389/fgene.2021.619056
Item in Clipboard
Dynamic Transcriptome Sequencing of Bovine Alphaherpesvirus Type 1 and Host Cells Carried Out by a Multi-Technique Approach
Front Genet.
.
No abstract available
Keywords: bovine herpesvirus; herpesviruses; long-read sequencing technology; nanopore sequencing technology; synthetic long-read sequencing; transcriptomics.
Conflict of interest statement
The authors declare that the research was conducted in the absence of any commercial or financial relationships that could be construed as a potential conflict of interest.
Figures
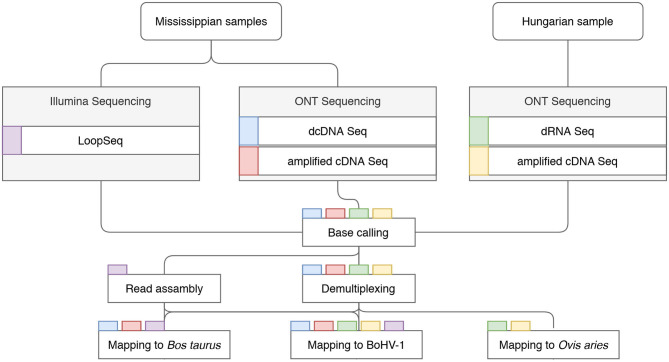
Detailed workflow of the project. Data flow chart shows the overview of the study design. Colored rectangles represent the sequencing libraries. Steps of data analysis are shown in rectangles, with the libraries undergoing the given step indicated by the tab color.

Summary statistics of the dataset. This figure shows the statistics of sequencing reads, including the virus:host read ratios (A), the proportion between the total viral reads (B1) generated by various sequencing techniques, and the ratios of reads obtained from non-time-varying (“static”) samples (B2) and time-varying (“dynamic”) samples (B3–6), which were generated by nanopore sequencing (B2, B4, B5, B6) or by LoopSeq (B3) (C) Read length distribution in the various samples. (A) Virus:host ratio of transcription reads. This study yielded altogether 3,463,245 viral and 22,337,732 host transcript reads. The first six samples were prepared by mixing RNAs isolated from time-varying samples before library preparation using equal volumes of RNA solution taken at each time point (1, 2, 4, 6, 8, and 12 h post infection; “mixed time points” in the gray chart). “A-B-C” in the gray chart include those 1 and 2 h samples, which contain combined data of the three biological replicates. The rest of the bars depict the virus:host ratio of time-course data obtained from three sample series (A–C, each representing a biological replicate) which were generated using nanopore sequencing (samples from time points 1, 2, 4, 6, 8, and 12 h), or via LoopSeq (samples from time points 2 and 12 h). Reverse transcription was carried out using oligo(dT) oligonucleotide primers in each case, except in two samples where random oligonucleotide primers were used (labeled as “random”). Some of the cDNA libraries were generated using PCR amplification (labeled as “acDNA,” where “a” stands for “amplified”), the rest of the cDNA samples were non-amplified (labeled as “dcDNA,” where “d” stands for “direct”). “Hu-Mi” refers to the mixed time points from the Hungarian and Mississippian samples, which were sequenced using barcode labeling. A small ratio of the barcode sequences had lower sequencing quality. These reads were not excluded because they can be used for further analysis of the virus. LRS: long-read sequencing. (B) Viral read ratios in the different samples. The first pie chart diagram (B1) shows the relative proportion of the total viral reads generated by the various sequencing approaches. More than half of the viral reads were produced by direct cDNA (dcDNA) sequencing technique, whereas 0.4% of the total reads were generated by the LoopSeq technique. The second pie chart diagram (B2) illustrates the proportions of non-time-varying (“static”) transcript reads obtained by nanopore sequencing. Charts B3–B6 represent the relative proportions of time-varying (“dynamic”) reads generated by LoopSeq (B3) or nanopore dcDNA sequencing (B4–6) at different time points. The ratios of the three biological replicates (samples A–C) of the LoopSeq data (2 and 12 h samples) are depicted in a single chart, while the nanopore data (1, 2, 4, 6, 8, and 12 h samples) were illustrated in three charts, each representing one of the three biological replicates. (C) Length distribution of sequencing reads aligned to the BoHV-1 genome. The shortest reads were generated by direct RNA sequencing (dRNA-Seq; mean of viral reads: 970 bp), whereas the dcDNA technique yielded the longest reads (ranging between 1,202 and 1,846 bp in the different samples).
References
LinkOut - more resources
Full Text Sources
Other Literature Sources