Comprehensive RNA-Seq Profiling Reveals Temporal and Tissue-Specific Changes in Gene Expression in Sprague-Dawley Rats as Response to Heat Stress Challenges
- PMID: 33897767
- PMCID: PMC8063118
- DOI: 10.3389/fgene.2021.651979
Comprehensive RNA-Seq Profiling Reveals Temporal and Tissue-Specific Changes in Gene Expression in Sprague-Dawley Rats as Response to Heat Stress Challenges
Abstract
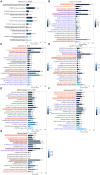
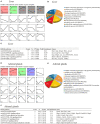
Understanding heat stress physiology and identifying reliable biomarkers are paramount for developing effective management and mitigation strategies. However, little is known about the molecular mechanisms underlying thermal tolerance in animals. In an experimental model of Sprague-Dawley rats subjected to temperatures of 22 ± 1°C (control group; CT) and 42°C for 30 min (H30), 60 min (H60), and 120 min (H120), RNA-sequencing (RNA-Seq) assays were performed for blood (CT and H120), liver (CT, H30, H60, and H120), and adrenal glands (CT, H30, H60, and H120). A total of 53, 1,310, and 1,501 differentially expressed genes (DEGs) were significantly identified in the blood (P < 0.05 and |fold change (FC)| >2), liver (P < 0.01, false discovery rate (FDR)-adjusted P = 0.05 and |FC| >2) and adrenal glands (P < 0.01, FDR-adjusted P = 0.05 and |FC| >2), respectively. Of these, four DEGs, namely Junb, P4ha1, Chordc1, and RT1-Bb, were shared among the three tissues in CT vs. H120 comparison. Functional enrichment analyses of the DEGs identified in the blood (CT vs. H120) revealed 12 biological processes (BPs) and 25 metabolic pathways significantly enriched (FDR = 0.05). In the liver, 133 BPs and three metabolic pathways were significantly detected by comparing CT vs. H30, H60, and H120. Furthermore, 237 BPs were significantly (FDR = 0.05) enriched in the adrenal glands, and no shared metabolic pathways were detected among the different heat-stressed groups of rats. Five and four expression patterns (P < 0.05) were uncovered by 73 and 91 shared DEGs in the liver and adrenal glands, respectively, over the different comparisons. Among these, 69 and 73 genes, respectively, were proposed as candidates for regulating heat stress response in rats. Finally, together with genome-wide association study (GWAS) results in cattle and phenome-wide association studies (PheWAS) analysis in humans, five genes (Slco1b2, Clu, Arntl, Fads1, and Npas2) were considered as being associated with heat stress response across mammal species. The datasets and findings of this study will contribute to a better understanding of heat stress response in mammals and to the development of effective approaches to mitigate heat stress response in livestock through breeding.
Keywords: RNA-sequencing; heat stress response; mammals; rats' transcriptome; thermal tolerance.
Copyright © 2021 Dou, Cánovas, Brito, Yu, Schenkel and Wang.
Conflict of interest statement
The authors declare that the research was conducted in the absence of any commercial or financial relationships that could be construed as a potential conflict of interest.
Figures


Similar articles
-
Identification of Novel mRNA Isoforms Associated with Acute Heat Stress Response Using RNA Sequencing Data in Sprague Dawley Rats.Biology (Basel). 2022 Nov 29;11(12):1740. doi: 10.3390/biology11121740. Biology (Basel). 2022. PMID: 36552250 Free PMC article.
-
Genome-wide identification and functional prediction of long non-coding RNAs in Sprague-Dawley rats during heat stress.BMC Genomics. 2021 Feb 17;22(1):122. doi: 10.1186/s12864-021-07421-8. BMC Genomics. 2021. PMID: 33596828 Free PMC article.
-
Corticosterone tissue-specific response in Sprague Dawley rats under acute heat stress.J Therm Biol. 2019 Apr;81:12-19. doi: 10.1016/j.jtherbio.2019.02.004. Epub 2019 Feb 2. J Therm Biol. 2019. PMID: 30975409
-
Heat Stress Impairs the Physiological Responses and Regulates Genes Coding for Extracellular Exosomal Proteins in Rat.Genes (Basel). 2020 Mar 13;11(3):306. doi: 10.3390/genes11030306. Genes (Basel). 2020. PMID: 32183190 Free PMC article.
-
Applications of Next-Generation Sequencing Technologies and Statistical Tools in Identifying Pathways and Biomarkers for Heat Tolerance in Livestock.Vet Sci. 2024 Dec 2;11(12):616. doi: 10.3390/vetsci11120616. Vet Sci. 2024. PMID: 39728955 Free PMC article. Review.
Cited by
-
Ramping up the Heat: Induction of Systemic and Pulmonary Immune Responses and Metabolic Adaptations in Mice.bioRxiv [Preprint]. 2025 Aug 2:2025.08.01.667768. doi: 10.1101/2025.08.01.667768. bioRxiv. 2025. PMID: 40766621 Free PMC article. Preprint.
-
Genome-Wide DNA Methylation and Transcriptome Integration Associates DNA Methylation Changes with Bovine Subclinical Mastitis Caused by Staphylococcus chromogenes.Int J Mol Sci. 2023 Jun 20;24(12):10369. doi: 10.3390/ijms241210369. Int J Mol Sci. 2023. PMID: 37373515 Free PMC article.
-
Cooling lactating sows exposed to early summer heat wave alters circadian patterns of behavior and rhythms of respiration, rectal temperature, and saliva melatonin.PLoS One. 2024 Oct 31;19(10):e0310787. doi: 10.1371/journal.pone.0310787. eCollection 2024. PLoS One. 2024. PMID: 39480888 Free PMC article.
-
Analysis of Genomic Alternative Splicing Patterns in Rat under Heat Stress Based on RNA-Seq Data.Genes (Basel). 2022 Feb 16;13(2):358. doi: 10.3390/genes13020358. Genes (Basel). 2022. PMID: 35205403 Free PMC article.
-
Characterizing the postnatal hypothalamic-pituitary-adrenal axis response of in utero heat stressed pigs at 10 and 15 weeks of age.Sci Rep. 2021 Nov 18;11(1):22527. doi: 10.1038/s41598-021-01889-w. Sci Rep. 2021. PMID: 34795321 Free PMC article.
References
LinkOut - more resources
Full Text Sources
Other Literature Sources
Research Materials
Miscellaneous

