

miR-375 Promotes Pancreatic Differentiation In Vitro by Affecting Different Target Genes at Different Stages
- PMID: 33897780
- PMCID: PMC8052179
- DOI: 10.1155/2021/6642983
miR-375 Promotes Pancreatic Differentiation In Vitro by Affecting Different Target Genes at Different Stages
Abstract
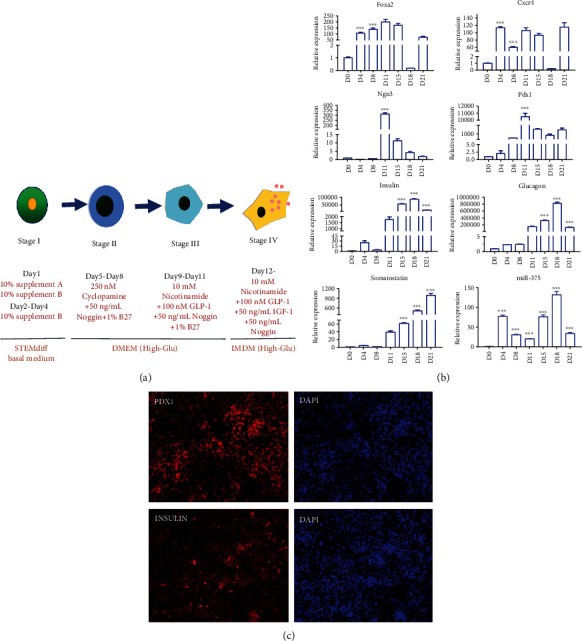
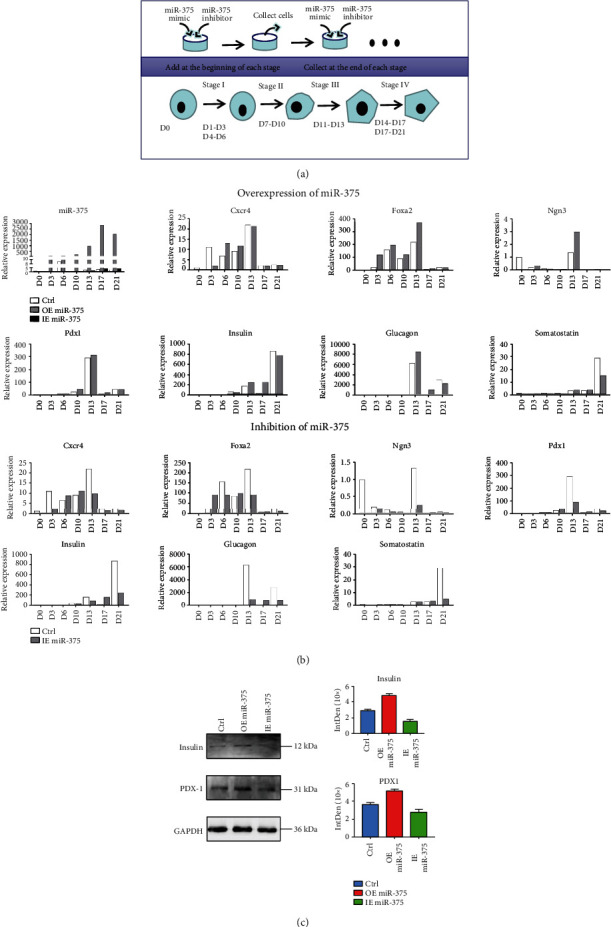
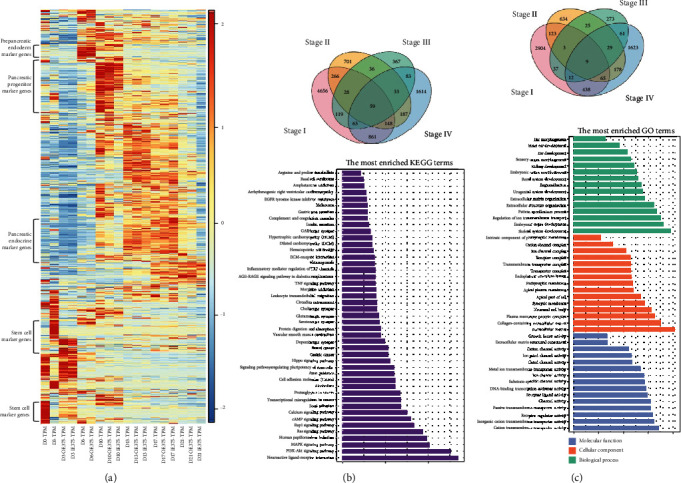
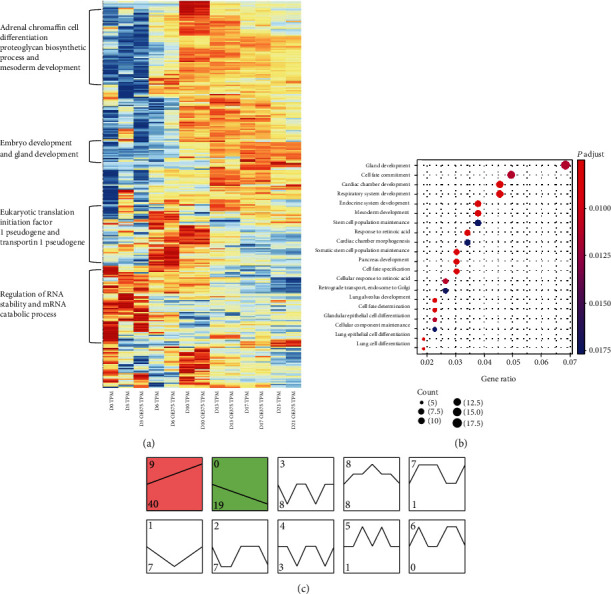
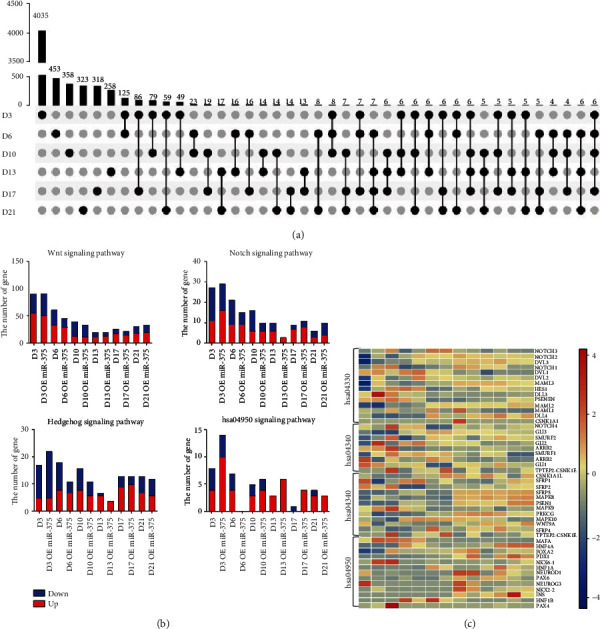
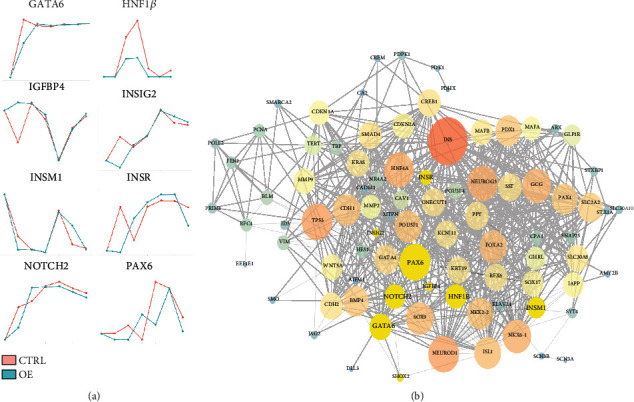
Human embryonic stem cells (hESCs) possess the ability to differentiate into insulin-producing cells (IPCs), which can be used to treat type I diabetes. miR-375 is an essential transcriptional regulator in the development and maturation of the pancreas. In this study, we optimized a protocol to differentiate hESCs into IPCs and successfully obtained IPCs. Then, we performed overexpression and inhibition experiments of miR-375 on cells at different stages of differentiation and performed RNA-seq. The results showed that the expression of miR-375 fluctuated during hESC differentiation and was affected by miR-375 mimics and inhibitors. miR-375 influences global gene expression and the target genes of miR-375. The overexpression of miR-375 can cause changes in multiple signaling pathways during pancreatic development. miR-375 is a major participant in the differentiation of pancreatic β-cells through different target genes at different stages. This study provides new ideas for further investigation of how microRNAs affect cell fate and gene transcription.
Copyright © 2021 Zhenyu Lu et al.
Conflict of interest statement
The authors declare that they have no conflicts of interest.
Figures
Similar articles
-
microRNA-690 regulates induced pluripotent stem cells (iPSCs) differentiation into insulin-producing cells by targeting Sox9.Stem Cell Res Ther. 2019 Feb 15;10(1):59. doi: 10.1186/s13287-019-1154-8. Stem Cell Res Ther. 2019. PMID: 30767782 Free PMC article.
-
Dynamic expression of microRNAs during the differentiation of human embryonic stem cells into insulin-producing cells.Gene. 2013 Apr 15;518(2):246-55. doi: 10.1016/j.gene.2013.01.038. Epub 2013 Jan 29. Gene. 2013. PMID: 23370336
-
FoxO1 inhibition promotes differentiation of human embryonic stem cells into insulin producing cells.Exp Cell Res. 2018 Jan 1;362(1):227-234. doi: 10.1016/j.yexcr.2017.11.022. Epub 2017 Nov 20. Exp Cell Res. 2018. PMID: 29157981
-
MiR-375, a microRNA related to diabetes.Gene. 2014 Jan 1;533(1):1-4. doi: 10.1016/j.gene.2013.09.105. Epub 2013 Oct 10. Gene. 2014. PMID: 24120394 Review.
-
The role of microRNAs in islet β-cell development.Cell Biol Int. 2016 Dec;40(12):1248-1255. doi: 10.1002/cbin.10691. Epub 2016 Nov 2. Cell Biol Int. 2016. PMID: 27743454 Review.
Cited by
-
MicroRNA-375: potential cancer suppressor and therapeutic drug.Biosci Rep. 2021 Sep 30;41(9):BSR20211494. doi: 10.1042/BSR20211494. Biosci Rep. 2021. PMID: 34494089 Free PMC article. Review.
-
Significant expansion of the donor pool achieved by utilizing islets of variable quality in the production of allogeneic "Neo-Islets", 3-D organoids of Mesenchymal Stromal and islet cells, a novel immune-isolating biotherapy for Type I Diabetes.PLoS One. 2023 Aug 24;18(8):e0290460. doi: 10.1371/journal.pone.0290460. eCollection 2023. PLoS One. 2023. PMID: 37616230 Free PMC article.
-
Differentially expressed microRNAs during the differentiation of muscle-derived stem cells into insulin-producing cells, a promoting role of microRNA-708-5p/STK4 axis.PLoS One. 2022 Apr 8;17(4):e0266609. doi: 10.1371/journal.pone.0266609. eCollection 2022. PLoS One. 2022. PMID: 35395037 Free PMC article.
-
Immunomodulatory Properties of Human Breast Milk: MicroRNA Contents and Potential Epigenetic Effects.Biomedicines. 2022 May 24;10(6):1219. doi: 10.3390/biomedicines10061219. Biomedicines. 2022. PMID: 35740242 Free PMC article. Review.
-
Clinical significance of circulating long non-coding RNA SNHG1 in type 2 diabetes mellitus and its association with cell proliferation of pancreatic β-cell.BMC Endocr Disord. 2024 Oct 25;24(1):225. doi: 10.1186/s12902-024-01755-6. BMC Endocr Disord. 2024. PMID: 39455977 Free PMC article.
References
LinkOut - more resources
Full Text Sources
Other Literature Sources
