

ZEB1 enhances Warburg effect to facilitate tumorigenesis and metastasis of HCC by transcriptionally activating PFKM
- PMID: 33897890
- PMCID: PMC8058737
- DOI: 10.7150/thno.56490
ZEB1 enhances Warburg effect to facilitate tumorigenesis and metastasis of HCC by transcriptionally activating PFKM
Abstract
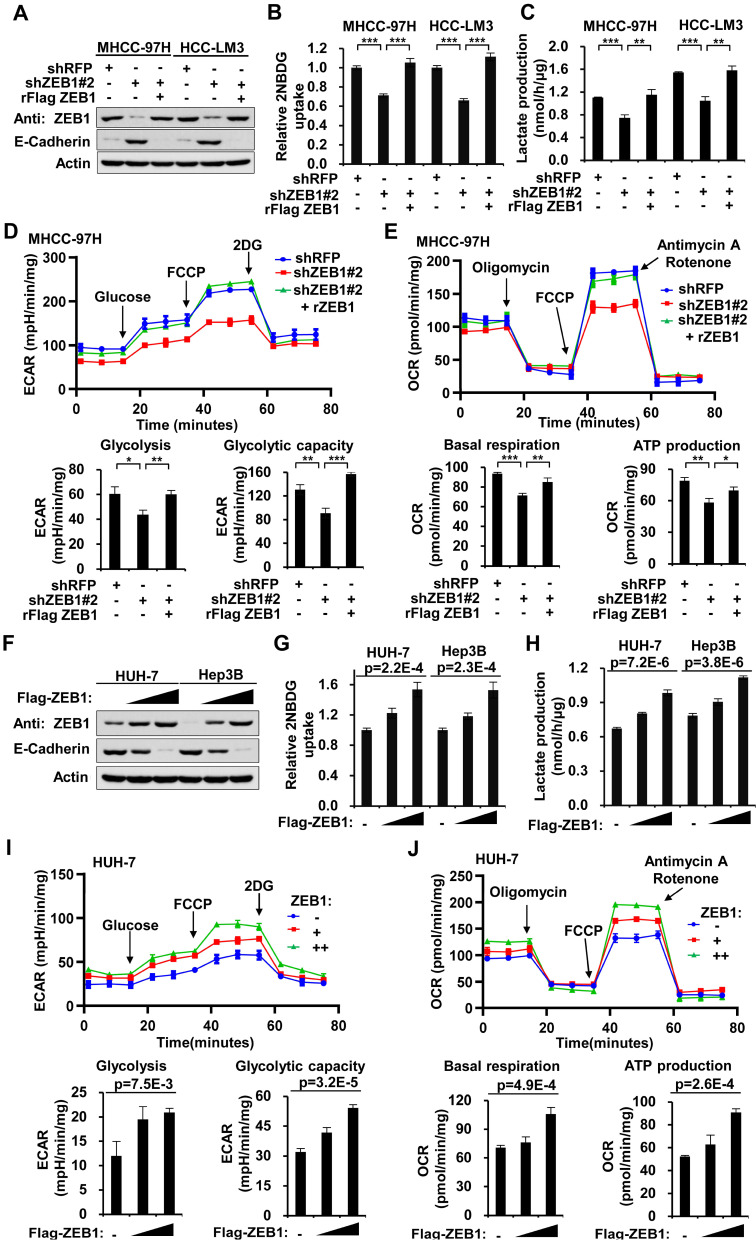
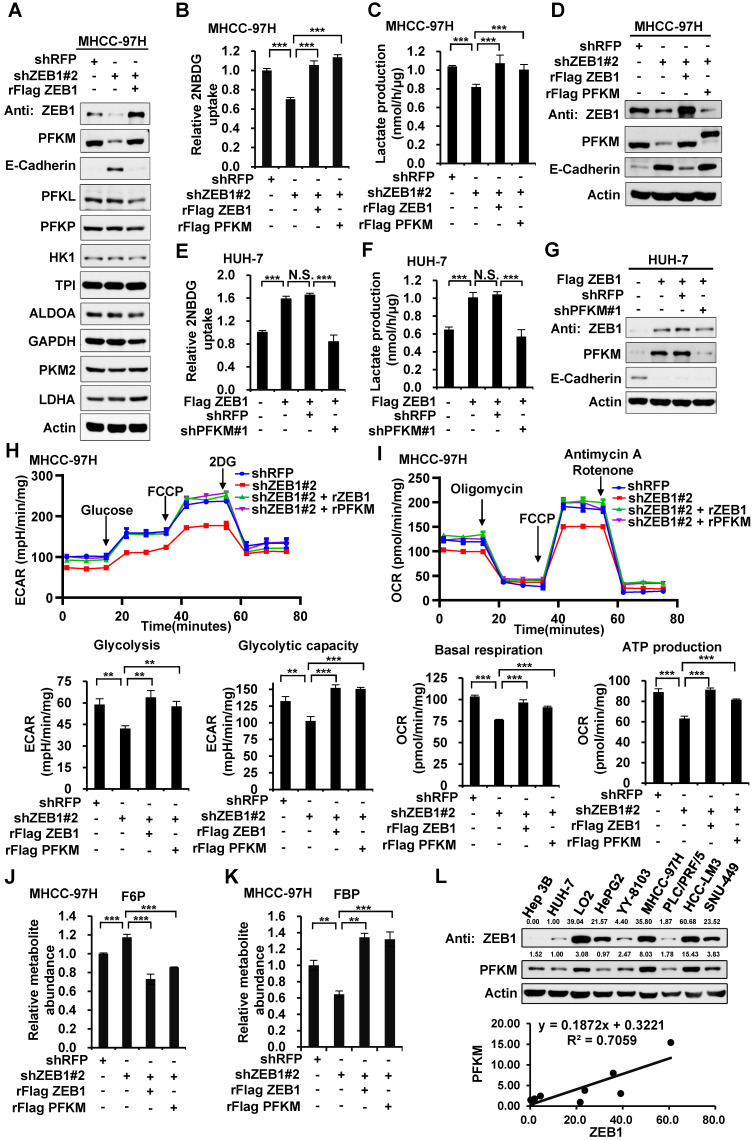
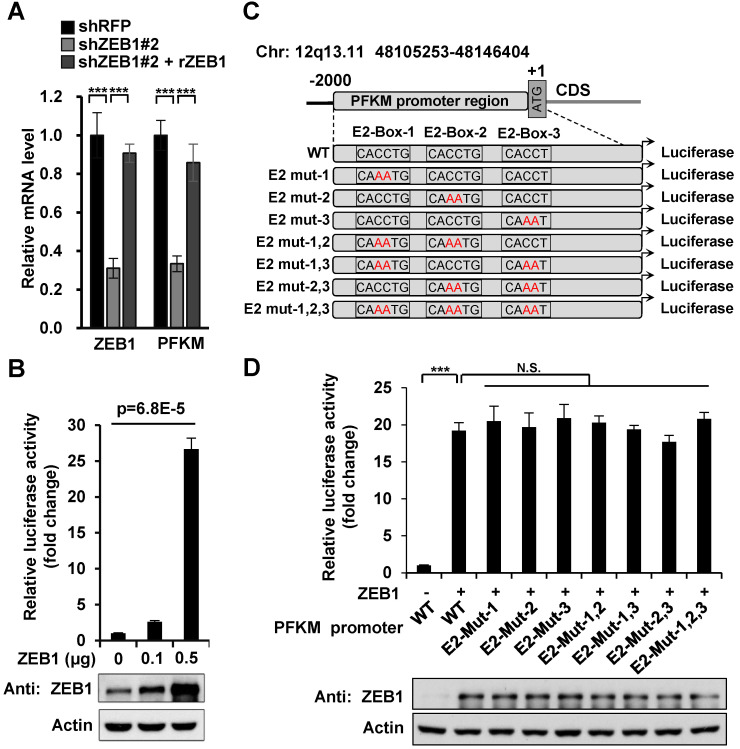
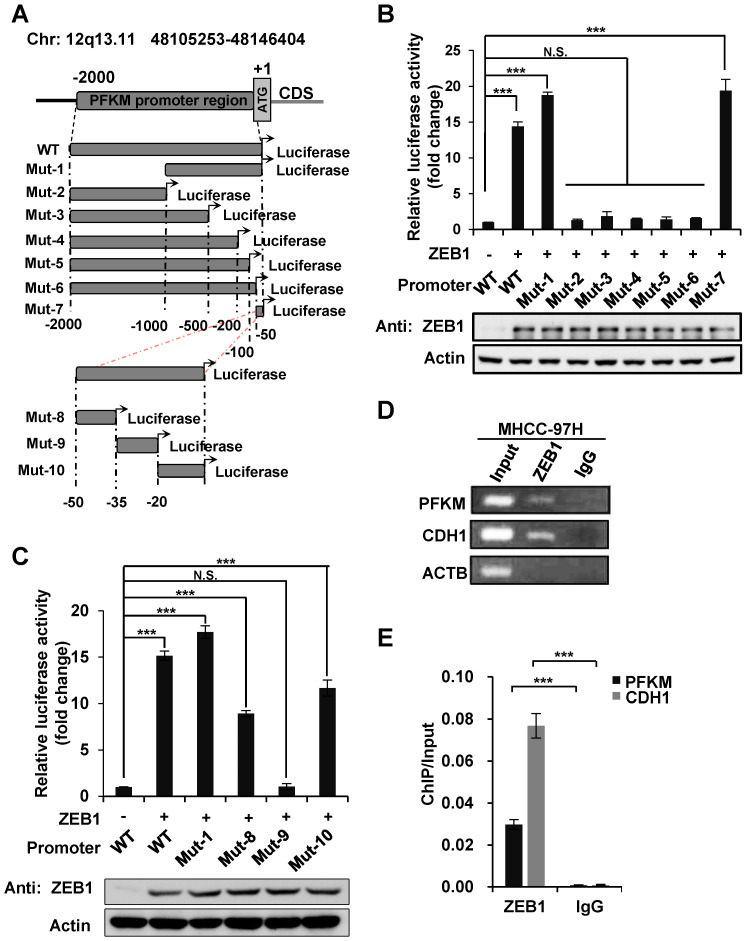
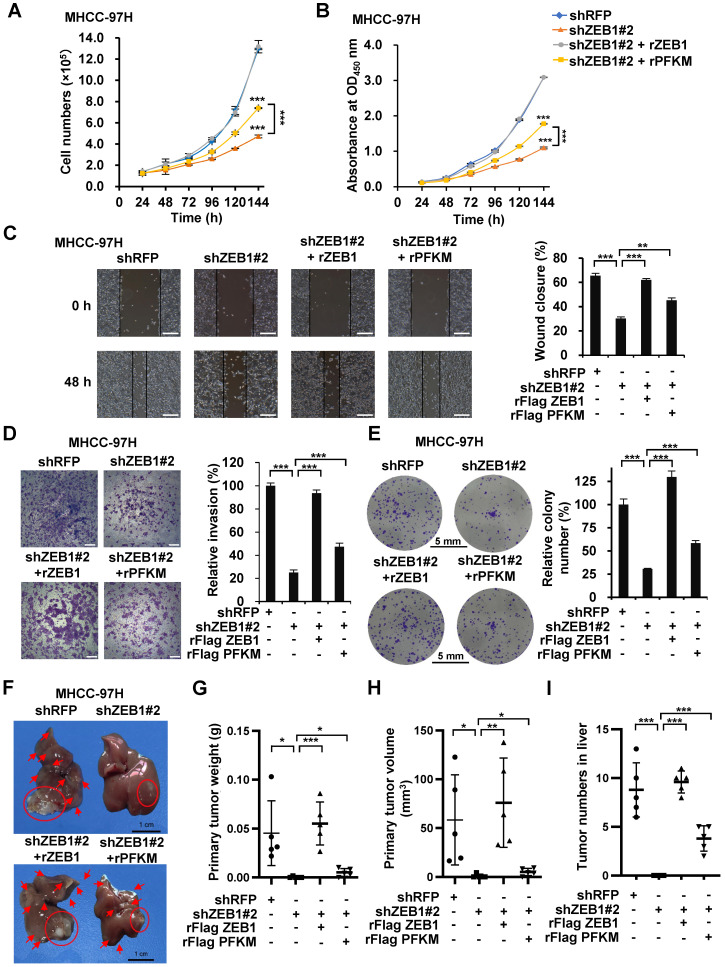
Metabolic reprogramming, especially Warburg effect, is a key event in tumor initiation and progression. ZEB1 plays a vital role in metastasis of various cancers. We previously found that ZEB1 was excessively expressed in hepatocellular carcinoma (HCC) and its high expression was closely correlated with metastasis and recurrence of HCC. We want to know whether glycolytic enzymes are regulated by ZEB1 and contribute to carcinogenesis and metastasis of HCC. Methods: To explore whether ZEB1 could enhance glycolysis in HCC, we knocked down ZEB1 by short hairpin RNA (shRNA) in MHCC-97H and HCC-LM3 cells and performed glucose uptake, lactate production, ECAR and OCR assays. To investigate how ZEB1 enhances glycolysis, the protein levels of glycolytic enzymes were detected in the same cell lines using Western blot. The regulatory effect of ZEB1 on PFKM mRNA level was confirmed by RT-qPCR, luciferase report assay and ChIP assay. In order to assess the role of ZEB1-PFKM axis in cell proliferation, cell counting and CCK-8 assays were performed in MHCC-97H and HCC-LM3 cell lines knocked down for ZEB1 and further re-expressed for either ZEB1 or PFKM or not. To explored whether the ZEB1-PFKM axis also functions in HCC cell migration, invasion and metastasis, the same MHCC-97H and HCC-LM3 cell lines were performed for wound healing assays, transwell assays and colony formation assays, meanwhile, MHCC-97H cell lines were performed for orthotopic liver transplantation assays. Finally, the expression of ZEB1 and PFKM were examined in human liver cancer specimens and non-tumorous liver tissues using immunohistochemical and Western blot. Results: We found that ZEB1 transcriptionally upregulates the expression of the muscle isoform of phosphofructokinase-1 (PFKM), a rate-limiting enzyme in glycolysis. Intriguingly, a non-classic ZEB1-binding sequence in the promoter region of PFKM was identified through which ZEB1 directly activates the transcription of PFKM. Silencing of ZEB1 in MHCC-97H and HCC-LM3 cell leads to impaired PFKM expression, glycolysis, proliferation and invasion, and such impairments are rescued by exogenous expression of PFKM. Importantly, in-situ HCC xenograft assays and studies from TCGA database demonstrate that ZEB1-PFKM axis is crucial for carcinogenesis and metastasis of HCC. Conclusions: Our study reveals a novel mechanism of ZEB1 in promoting HCC by activating the transcription of PFKM, establishing the direct link of ZEB1 to the promotion of glycolysis and Warburg effect and suggesting that inhibition of ZEB1 transcriptional activity toward PFKM may be a potential therapeutic strategy for HCC.
Keywords: PFKM; ZEB1; glycolysis; intrahepatic metastasis; non-classic binding.
© The author(s).
Conflict of interest statement
Competing Interests: The authors have declared that no competing interest exists.
Figures

Similar articles
-
ZEB1 Transcriptionally Activates PHGDH to Facilitate Carcinogenesis and Progression of HCC.Cell Mol Gastroenterol Hepatol. 2023;16(4):541-556. doi: 10.1016/j.jcmgh.2023.06.006. Epub 2023 Jun 17. Cell Mol Gastroenterol Hepatol. 2023. PMID: 37331567 Free PMC article.
-
Clinicopathological significance of ZEB1 protein in patients with hepatocellular carcinoma.Ann Surg Oncol. 2012 May;19(5):1700-6. doi: 10.1245/s10434-011-1772-6. Epub 2011 May 17. Ann Surg Oncol. 2012. PMID: 21584833
-
TRIM52 up-regulation in hepatocellular carcinoma cells promotes proliferation, migration and invasion through the ubiquitination of PPM1A.J Exp Clin Cancer Res. 2018 Jun 13;37(1):116. doi: 10.1186/s13046-018-0780-9. J Exp Clin Cancer Res. 2018. PMID: 29898761 Free PMC article.
-
Involvement of lncRNAs in the regulation of aerobic glycolysis in hepatocellular carcinoma: Main functions, regulatory mechanisms and potential therapeutic implications (Review).Oncol Rep. 2024 Jun;51(6):84. doi: 10.3892/or.2024.8743. Epub 2024 Apr 26. Oncol Rep. 2024. PMID: 38666534 Free PMC article. Review.
-
Dysregulated cholesterol regulatory genes in hepatocellular carcinoma.Eur J Med Res. 2023 Dec 9;28(1):580. doi: 10.1186/s40001-023-01547-z. Eur J Med Res. 2023. PMID: 38071335 Free PMC article. Review.
Cited by
-
Identification of a seven-gene signature predicting clinical outcome of liver cancer based on tumor mutational burden.Hum Cell. 2022 Jul;35(4):1192-1206. doi: 10.1007/s13577-022-00708-2. Epub 2022 May 27. Hum Cell. 2022. PMID: 35622212
-
Tripartite motif-containing protein 26 promotes colorectal cancer growth by inactivating p53.Cell Death Differ. 2025 Jun;32(6):1142-1152. doi: 10.1038/s41418-025-01463-1. Epub 2025 Feb 24. Cell Death Differ. 2025. PMID: 39994352 Free PMC article.
-
MRTO4 Enhances Glycolysis to Facilitate HCC Progression by Inhibiting ALDOB.Med Sci Monit. 2024 May 23;30:e944685. doi: 10.12659/MSM.944685. Med Sci Monit. 2024. PMID: 38778508 Free PMC article.
-
Characterization of an Activated Metabolic Transcriptional Program in Hepatoblastoma Tumor Cells Using scRNA-seq.Int J Mol Sci. 2024 Dec 4;25(23):13044. doi: 10.3390/ijms252313044. Int J Mol Sci. 2024. PMID: 39684755 Free PMC article.
-
Cuproplasia and cuproptosis in hepatocellular carcinoma: mechanisms, relationship and potential role in tumor microenvironment and treatment.Cancer Cell Int. 2025 Apr 9;25(1):137. doi: 10.1186/s12935-025-03683-4. Cancer Cell Int. 2025. PMID: 40205387 Free PMC article. Review.
References
-
- counting the toll of cancer. Lancet. 2018;392:985. - PubMed
-
- Ferlay J, Soerjomataram I, Dikshit R, Eser S, Mathers C, Rebelo M. et al. Cancer incidence and mortality worldwide: sources, methods and major patterns in GLOBOCAN 2012. Int J Cancer. 2015;136:E359–86. - PubMed
-
- Forner A, Llovet JM, Bruix J. Hepatocellular carcinoma. Lancet. 2012;379:1245–55. - PubMed
Publication types
MeSH terms
Substances
LinkOut - more resources
Full Text Sources
Other Literature Sources
Medical
