. 2021 Apr 21:1-16.
doi: 10.1007/s12559-020-09812-7. Online ahead of print.

An Early Warning Tool for Predicting Mortality Risk of COVID-19 Patients Using Machine Learning

Affiliations

An Early Warning Tool for Predicting Mortality Risk of COVID-19 Patients Using Machine Learning

Muhammad E H Chowdhury et al. Cognit Comput. .

Abstract

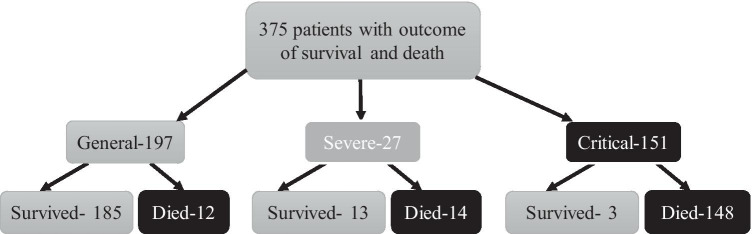
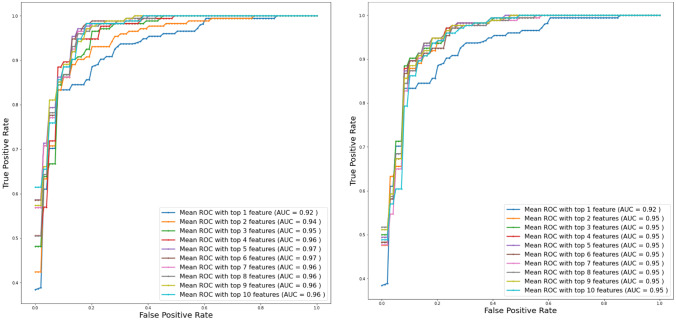
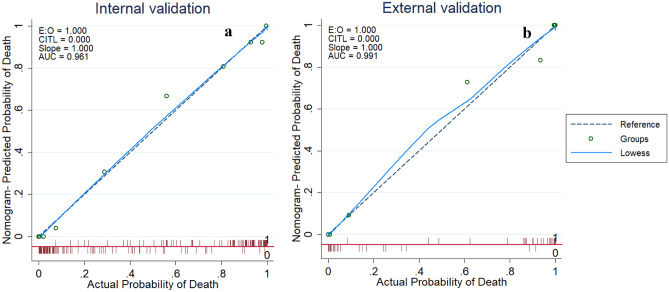
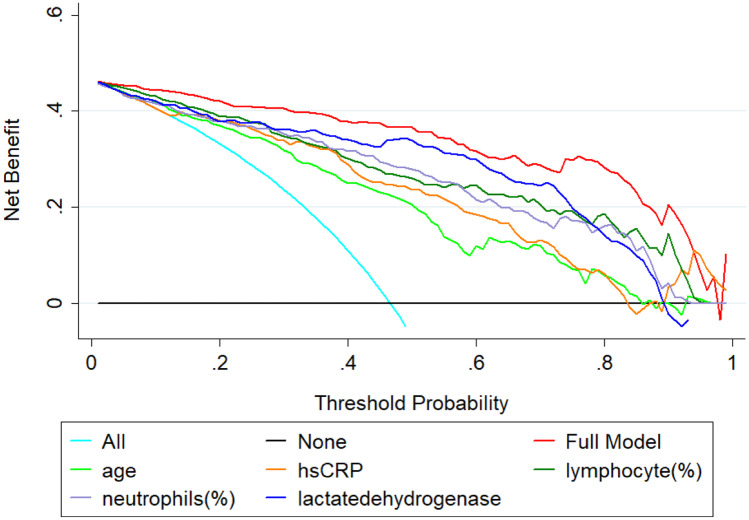
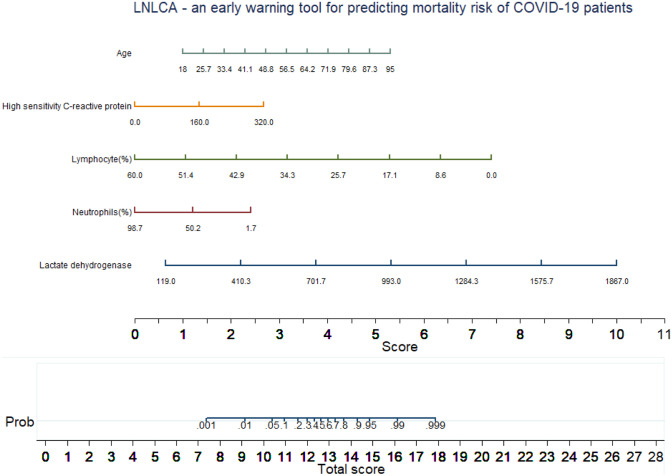
COVID-19 pandemic has created an extreme pressure on the global healthcare services. Fast, reliable, and early clinical assessment of the severity of the disease can help in allocating and prioritizing resources to reduce mortality. In order to study the important blood biomarkers for predicting disease mortality, a retrospective study was conducted on a dataset made public by Yan et al. in [1] of 375 COVID-19 positive patients admitted to Tongji Hospital (China) from January 10 to February 18, 2020. Demographic and clinical characteristics and patient outcomes were investigated using machine learning tools to identify key biomarkers to predict the mortality of individual patient. A nomogram was developed for predicting the mortality risk among COVID-19 patients. Lactate dehydrogenase, neutrophils (%), lymphocyte (%), high-sensitivity C-reactive protein, and age (LNLCA)-acquired at hospital admission-were identified as key predictors of death by multi-tree XGBoost model. The area under curve (AUC) of the nomogram for the derivation and validation cohort were 0.961 and 0.991, respectively. An integrated score (LNLCA) was calculated with the corresponding death probability. COVID-19 patients were divided into three subgroups: low-, moderate-, and high-risk groups using LNLCA cutoff values of 10.4 and 12.65 with the death probability less than 5%, 5-50%, and above 50%, respectively. The prognostic model, nomogram, and LNLCA score can help in early detection of high mortality risk of COVID-19 patients, which will help doctors to improve the management of patient stratification.

Keywords: COVID-19; Early warning tool; Machine learning; Predicting mortality risk; Prognostic model.


Conflict of interest statement

Conflict of InterestThe authors declare that they have no conflict of interest.

Figures

Fig. 1
Fig. 1
Patients’ outcome tree with the initial condition of the patients in admission
Fig. 2
Fig. 2
Comparison of the top-ranked 10 features identified using Multi-Tree XGBoost algorithm from data imputed using MICE (top) and (− 1) (bottom)
Fig. 3
Fig. 3
Comparison of the receive operating characteristic (ROC) plots for top-ranked 1 up to 10 features using the data imputation using MICE (left) and (− 1) (right) while feature selection and classification techniques were same
Fig. 4
Fig. 4
Calibration plot comparing predicted and actual death probability of patients with COVID-19. a Internal validation. b External validation
Fig. 5
Fig. 5
Decision curves analysis comparing different models to predict the death probability of patients with COVID-19. The net benefit balances the mortality risk and potential harm from unnecessary over-intervention for patients with COVID-19
Fig. 6
Fig. 6
Multivariate logistic regression-based nomogram to predict the probability of death. Nomogram for prediction of death was created using the following five predictors: lactate dehydrogenase, neutrophils (%), lymphocytes (%), high-sensitivity C-reactive protein, and age
Fig. 7
Fig. 7
An example nomogram-based score to predict the probability of death of a COVID-19 patient from test set (9 days before the actual outcome)
Fig. 8
Fig. 8
Estimation of the prediction of the patients’ outcome for 52 test patients with death outcome. The model was trained on the data present at admission, and multiple samples from a patient were used to predict the patient to be in high-risk group in the earliest time after admission. Note: “0” denotes the death outcome event for each patient, and vertical lines represent the time of admission with respect to death. Solid red line starts from the earliest prediction time point of death prediction, and the dotted line represents the delay between admission and death prediction by the model using the LNLCA model

Similar articles

Cited by

References

    1. Yan L, Zhang HT, Goncalves J, Xiao Y, Wang M, Guo Y, et al. "An interpretable mortality prediction model for COVID-19 patients. Nat Mach Intell. 2020: 1–6.
    1. Huang C, Wang Y, Li X, Ren L, Zhao J, Hu Y, et al. Clinical features of patients infected with 2019 novel coronavirus in Wuhan, China. The lancet. 2020;395(10223):497–506. doi: 10.1016/S0140-6736(20)30183-5. - DOI - PMC - PubMed
    1. Guan W-J, Ni ZY, Hu Y, Liang WH, Ou CQ, He JX, et al. Clinical characteristics of coronavirus disease 2019 in China. N Engl J Med. 2020;382(18):1708. doi: 10.1056/NEJMoa2002032. - DOI - PMC - PubMed
    1. Wang D, Hu B, Hu C, Zhu F, Liu X, Zhang J, et al. Clinical characteristics of 138 hospitalized patients with 2019 novel coronavirus–infected pneumonia in Wuhan, China. JAMA. 2020;323(11):1061–1069. doi: 10.1001/jama.2020.1585. - DOI - PMC - PubMed
    1. Wu Z, McGoogan JM. Characteristics of and important lessons from the coronavirus disease 2019 (COVID-19) outbreak in China: summary of a report of 72 314 cases from the Chinese Center for Disease Control and Prevention. JAMA. 2020;323(13):1239–1242. doi: 10.1001/jama.2020.2648. - DOI - PubMed

LinkOut - more resources