. 2021 Apr 16;11(8):4920-4928.
doi: 10.1021/acscatal.1c00415. Epub 2021 Apr 7.

True Nature of the Transition-Metal Carbide/Liquid Interface Determines Its Reactivity

Affiliations

True Nature of the Transition-Metal Carbide/Liquid Interface Determines Its Reactivity

Christoph Griesser et al. ACS Catal. .

Abstract

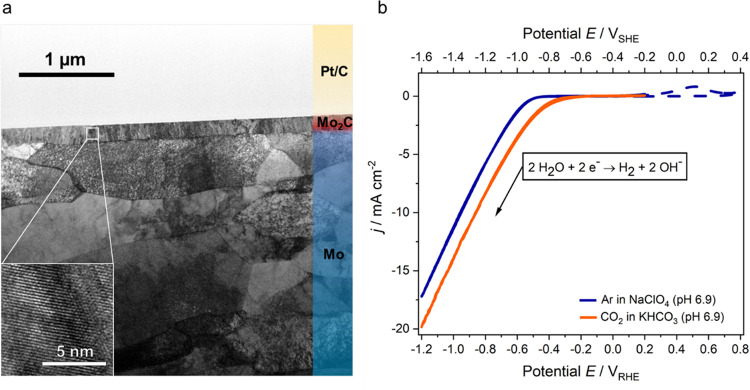
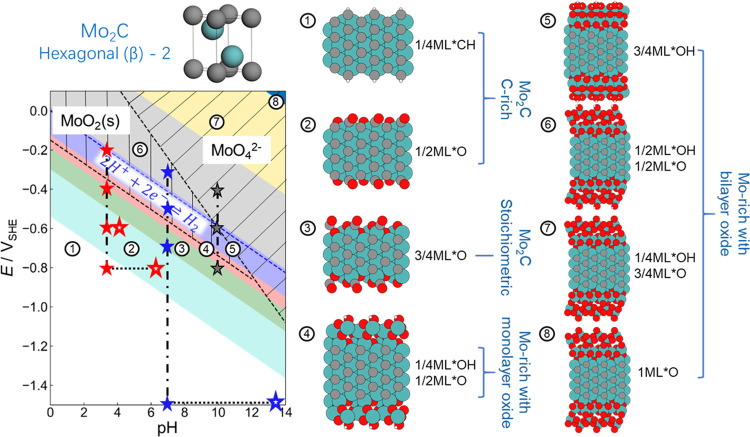
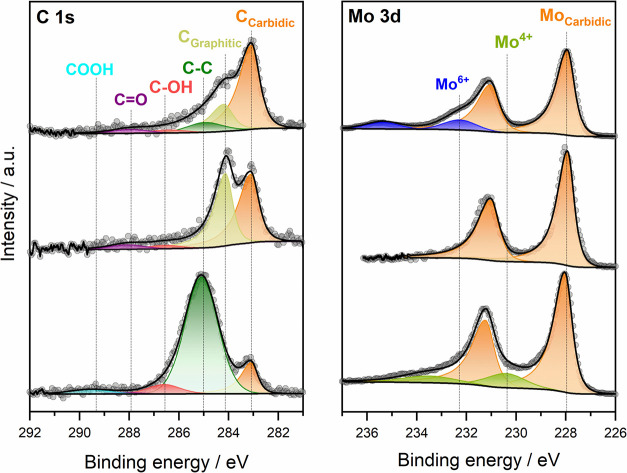
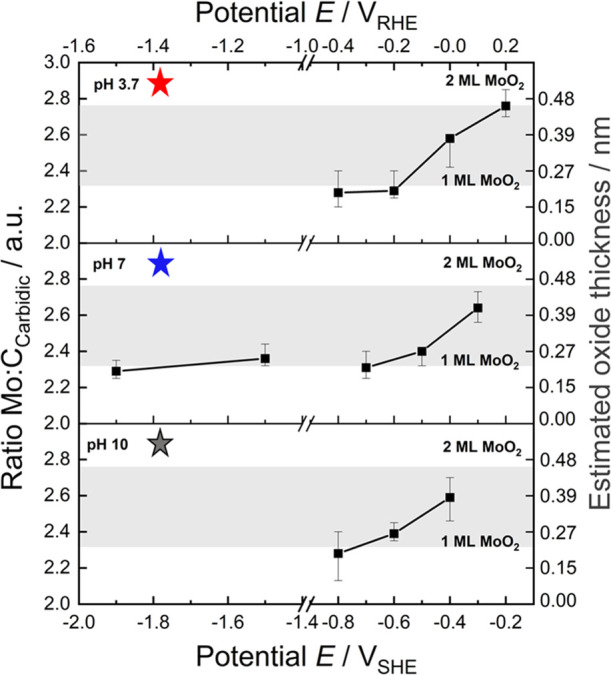
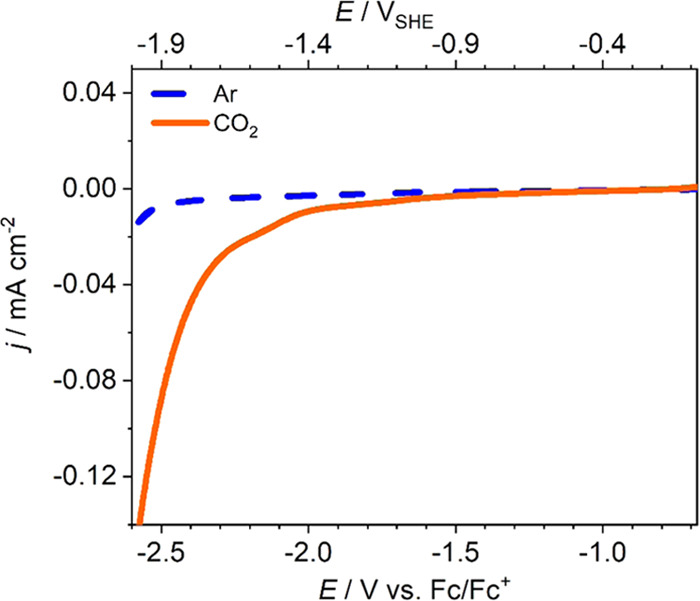
Compound materials, such as transition-metal (TM) carbides, are anticipated to be effective electrocatalysts for the carbon dioxide reduction reaction (CO2RR) to useful chemicals. This expectation is nurtured by density functional theory (DFT) predictions of a break of key adsorption energy scaling relations that limit CO2RR at parent TMs. Here, we evaluate these prospects for hexagonal Mo2C in aqueous electrolytes in a multimethod experiment and theory approach. We find that surface oxide formation completely suppresses the CO2 activation. The oxides are stable down to potentials as low as -1.9 V versus the standard hydrogen electrode, and solely the hydrogen evolution reaction (HER) is found to be active. This generally points to the absolute imperative of recognizing the true interface establishing under operando conditions in computational screening of catalyst materials. When protected from ambient air and used in nonaqueous electrolyte, Mo2C indeed shows CO2RR activity.


Conflict of interest statement

The authors declare no competing financial interest.

Figures

Figure 1
Figure 1
Mo2C film cross section and structure, and its cathodic water reduction activity. (a) Bright-field (BF) TEM image of the Mo2C film in a focused ion beam (FIB) lamella embedded between the polycrystalline Mo substrate and a Pt/C protection layer, and HRTEM image of the Mo2C film (inset). (b) Cathodic scans of Mo2C recorded at 20 mV s–1 in 0.1 M CO2-saturated KHCO3 (orange line) and Ar-saturated 0.1 M NaClO4 (blue line), both at pH 6.9. The dashed blue line shows an independently recorded cyclic voltammogram (CV) featuring anodic oxidation (see text); j is the current density, and E is the electrode potential versus the standard hydrogen electrode (SHE, upper axis) or the reversible hydrogen electrode (RHE, lower axis).
Figure 2
Figure 2
Ab initio thermodynamics surface Pourbaix (E/pH) diagram for Mo2C(110) and possible MoO2(100) surface oxide formation. The data here are for the more stable hexagonal (β)-2 bulk phase, while analogue results for the (β)-1 phase are given in Figure S6. The generic stability ranges of bulk MoO2 and dissolved MoO42–, as calculated for the parent metal, are indicated by black hatched areas. Side views of the stable surface phases ①–⑧ are shown on the right (Mo, C, O, and H atoms are depicted as green, gray, red, and white spheres, respectively). The surface terminations in terms of fractions of monolayers (ML) defined with respect to MoO2(100)-(1 × 1) are also provided. The blue dashed line indicates the thermodynamic onset potential of the hydrogen evolution reaction. Experimentally tested conditions are marked by stars, solid stars for nominal pH conditions, and hollow stars after considering surface pH changes (see text and Figure 4).
Figure 3
Figure 3
Surface chemistry of Mo2C showing MoO3 after air exposure and MoO2 after electrolyte contact at reductive potentials. Deconvoluted X-ray photoelectron C 1s (left) and Mo 3d (right) high-resolution spectra of the freshly synthesized film (top) with native MoO3 after short (15 min) air contact, (middle) without oxide due to handling under hydrogen and in an Ar-filled glovebox at all times, and (bottom) with MoO2 after immersion of oxide-free Mo2C into 0.1 M NaClO4 (pH 3.7) at −0.2 VSHE for 15 min. The fit components are directly given in the figure; the takeoff angle is 0° in all cases.
Figure 4
Figure 4
Experimental Pourbaix diagram confirming surface oxide formation under all relevant CO2RR conditions. The correlation between the Mo/Ccarbidic ratio and the estimated oxide layer thickness is given in Figure S19. For the calculation of the error bars, we refer to Supporting Information Note 4. The shaded regions indicate the thickness expected for one or two monolayers (ML) MoO2(100). The probed reaction conditions are indicated by correspondingly colored stars in the theoretical surface Pourbaix diagram in Figure 2.
Figure 5
Figure 5
CO2 electroreduction at Mo2C in nonaqueous electrolyte. CVs of Mo2C without (blue) and with (orange) CO2 in acetonitrile with 0.1 M tetrabutylammonium hexafluorophosphate (TBAPF6). Scan rate: 20 mV s–1.

References

    1. Nørskov J. K.; Bligaard T.; Rossmeisl J.; Christensen C. H. Towards the Computational Design of Solid Catalysts. Nat. Chem. 2009, 1, 37–46. 10.1038/nchem.121. - DOI - PubMed
    1. Greeley J. Theoretical Heterogeneous Catalysis: Scaling Relationships and Computational Catalyst Design. Annu. Rev. Chem. Biomol. Eng. 2016, 7, 605–635. 10.1146/annurev-chembioeng-080615-034413. - DOI - PubMed
    1. Zhao Z.-J.; Liu S.; Zha S.; Cheng D.; Studt F.; Henkelman G.; Gong J. Theory-Guided Design of Catalytic Materials Using Scaling Relationships and Reactivity Descriptors. Nat. Rev. Mater. 2019, 4, 792–804. 10.1038/s41578-019-0152-x. - DOI
    1. Védrine J. Heterogeneous Catalysis on Metal Oxides. Catalysts 2017, 7, 34110.3390/catal7110341. - DOI
    1. Li Z.; Wu Y. 2D Early Transition Metal Carbides (MXenes) for Catalysis. Small 2019, 15, 180473610.1002/smll.201804736. - DOI - PubMed

LinkOut - more resources