. 2021 Feb 5;8(8):2004033.
doi: 10.1002/advs.202004033. eCollection 2021 Apr.

Stretchable, Fully Polymeric Electrode Arrays for Peripheral Nerve Stimulation

Affiliations

Stretchable, Fully Polymeric Electrode Arrays for Peripheral Nerve Stimulation

Estelle A Cuttaz et al. Adv Sci (Weinh). .

Abstract

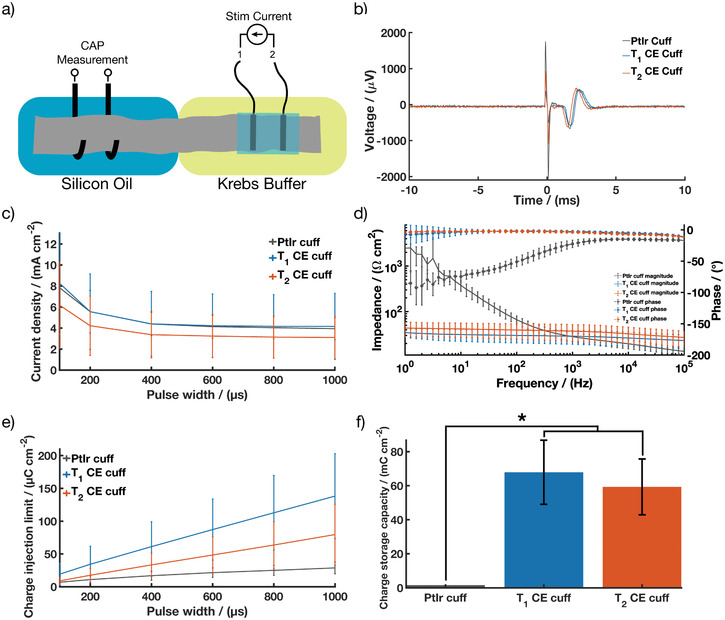
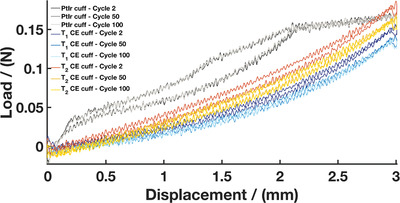
There is a critical need to transition research level flexible polymer bioelectronics toward the clinic by demonstrating both reliability in fabrication and stable device performance. Conductive elastomers (CEs) are composites of conductive polymers in elastomeric matrices that provide both flexibility and enhanced electrochemical properties compared to conventional metallic electrodes. This work focuses on the development of nerve cuff devices and the assessment of the device functionality at each development stage, from CE material to fully polymeric electrode arrays. Two device types are fabricated by laser machining of a thick and thin CE sheet variant on an insulative polydimethylsiloxane substrate and lamination into tubing to produce pre-curled cuffs. Device performance and stability following sterilization and mechanical loading are compared to a state-of-the-art stretchable metallic nerve cuff. The CE cuffs are found to be electrically and mechanically stable with improved charge transfer properties compared to the commercial cuff. All devices are applied to an ex vivo whole sciatic nerve and shown to be functional, with the CE cuffs demonstrating superior charge transfer and electrochemical safety in the biological environment.

Keywords: conductive elastomer; conductive polymer; electrode characterization; flexible bioelectronics; laser manufacturing; peripheral nerve cuff.


Conflict of interest statement

The authors declare no conflict of interest.

Figures

Figure 1
Figure 1
CE sheet performance across three thickness variants (T 1, T 2, and T3) showing a) thickness; b) conductivity; c) impedance magnitude and phase angle of EIS; and d) CSC compared to platinum. Results are reported as mean ± standard deviation (n = 5). * Significant difference at p < 0.05.
Figure 2
Figure 2
a) Schematic of the nerve cuff device fabrication process. Briefly, a first layer of PDMS was spin‐coated onto a PSS sacrificial layer. CE sheets were laser cut into tracks and were then deposited on the tacky PDMS to ensure proper adhesion between the two layers. A second layer of PDMS was applied to insulate the CE tracks. Finally, the CE active electrodes were exposed to obtain bipolar electrode arrays. b) Stereoscope image of the CE‐based electrode arrays in a flat configuration, showing the electrodes’ active sites. c) SEM image of the electrodes’ active sites i) top‐down view of CE electrode in PDMS insulation, ii) magnified electrode‐insulation interface, iii) cross‐section of CE in PDMS insulation, iv) magnified cross section.
Figure 3
Figure 3
T 1 and T 2 CE flat arrays performance showing a) impedance magnitude and phase angle of EIS and b) CSC plot comparing T 1 and T 2 CE in bulk sheet configuration and in flat array configuration (average across three different batches, n = 5 for both T 1 and T 2 CE in bulk sheet; n = 14 for T 1 CE flat arrays; n = 17 for T2 CE flat arrays); Stereoscope images showing a top view of c) a CE cuff array and d) a PtIr cuff array; e) Cross sectional SEM images of T 1 (left) and T 2 (right) CE cuff arrays; T 1 and T 2 CE cuff arrays performance showing; f) impedance magnitude and phase angle of EIS compared to PtIr cuff arrays; g) CSC and h) CIL compared to PtIr cuff arrays. Results are reported as mean ± standard deviation (N = 12 for T 1 CE cuff, N = 15 for T 2 CE cuff). * Significant difference at p < 0.05.
Figure 4
Figure 4
Stereoscopic images showing a top view of T 1 and T 2 CE cuff arrays pre‐and post autoclave.
Figure 5
Figure 5
CIL of T 1 (solid blue line + blue dotted line) and T 2 CE cuff arrays pre (solid blue line and solid orange line) and post‐autoclave (dashed blue line and dashed orange line) sterilization. Results are reported as mean ± standard deviation (N = 12 for T 1 CE cuffs, N = 15 for T 2 CE cuffs).
Figure 6
Figure 6
T1 and T2 CE cuff arrays performance during ex vivo showing; a) Schematic of the ex vivo set up; b) Representative compound action potentials recorded during ex vivo following stimulation by PtIr cuff arrays, T 1 and T 2 CE cuff arrays; c) A‐fiber activation threshold compared to PtIr cuff arrays; d) impedance magnitude and phase angle of EIS compared to PtIr cuff arrays; e) CIL and f) CSC compared to PtIr cuff arrays. Results are reported as mean ± standard deviation (N = 11 for T 1 CE cuff, N = 15 for T 2 CE cuff). * Significant difference at p < 0.05.
Figure 7
Figure 7
Representative load–displacement curves during cyclic tensile testing for the T 1 CE cuff, T 2 CE cuff, and PtIr cuff (N = 5 for T 1 CE cuffs, N = 5 for T2 CE cuffs, N = 2 for PtIr cuffs)

References

    1. Waltz E., Nat. Biotechnol. 2016, 34, 582. - PubMed
    1. Silverman H. A., Stiegler A., Tsaava T., Newman J., Steinberg B. E., Masi E. B., Robbiati S., Bouton C., Huerta P. T., Chavan S. S., Tracey K. J., Bioelectronics Med. 2018, 4, 3. - PMC - PubMed
    1. Green R., Bioelectronics Med. 2018, 1, 171.
    1. Famm K., Litt B., Tracey K. J., Boyden E. S., Slaoui M., Nature 2013, 496, 159. - PMC - PubMed
    1. Jeong J. W., Shin G., Il Park S., Yu K. J., Xu L., Rogers J. A., Neuron 2015, 86, 175. - PubMed

LinkOut - more resources