

Phenotypically Anchored mRNA and miRNA Expression Profiling in Zebrafish Reveals Flame Retardant Chemical Toxicity Networks
- PMID: 33898466
- PMCID: PMC8063052
- DOI: 10.3389/fcell.2021.663032
Phenotypically Anchored mRNA and miRNA Expression Profiling in Zebrafish Reveals Flame Retardant Chemical Toxicity Networks
Abstract
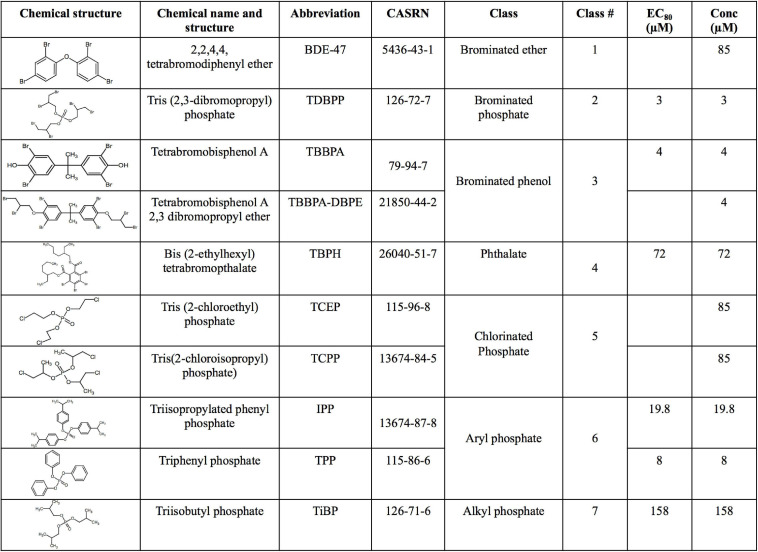
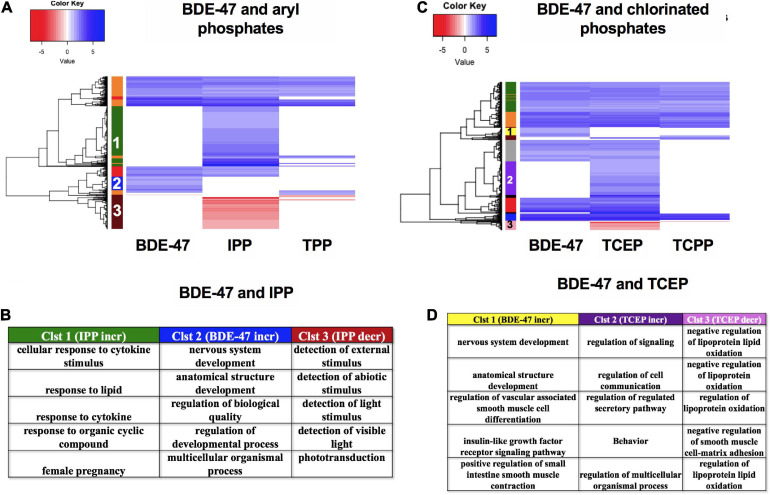
The ubiquitous use of flame retardant chemicals (FRCs) in the manufacture of many consumer products leads to inevitable environmental releases and human exposures. Studying toxic effects of FRCs as a group is challenging since they widely differ in physicochemical properties. We previously used zebrafish as a model to screen 61 representative FRCs and showed that many induced behavioral and teratogenic effects, with aryl phosphates identified as the most active. In this study, we selected 10 FRCs belonging to diverse physicochemical classes and zebrafish toxicity profiles to identify the gene expression responses following exposures. For each FRC, we executed paired mRNA-micro-RNA (miR) sequencing, which enabled us to study mRNA expression patterns and investigate the role of miRs as posttranscriptional regulators of gene expression. We found widespread disruption of mRNA and miR expression across several FRCs. Neurodevelopment was a key disrupted biological process across multiple FRCs and was corroborated by behavioral deficits. Several mRNAs (e.g., osbpl2a) and miRs (e.g., mir-125b-5p), showed differential expression common to multiple FRCs (10 and 7 respectively). These common miRs were also predicted to regulate a network of differentially expressed genes with diverse functions, including apoptosis, neurodevelopment, lipid regulation and inflammation. Commonly disrupted transcription factors (TFs) such as retinoic acid receptor, retinoid X receptor, and vitamin D regulator were predicted to regulate a wide network of differentially expressed mRNAs across a majority of the FRCs. Many of the differential mRNA-TF and mRNA-miR pairs were predicted to play important roles in development as well as cancer signaling. Specific comparisons between TBBPA and its derivative TBBPA-DBPE showed contrasting gene expression patterns that corroborated with their phenotypic profiles. The newer generation FRCs such as IPP and TCEP produced distinct gene expression changes compared to the legacy FRC BDE-47. Our study is the first to establish a mRNA-miR-TF regulatory network across a large group of structurally diverse FRCs and diverse phenotypic responses. The purpose was to discover common and unique biological targets that will help us understand mechanisms of action for these important chemicals and establish this approach as an important tool for better understanding toxic effects of environmental contaminants.
Keywords: flame retardants (additives, reactives); gene expression; mRNA; micro-RNA (miRNA); network analysis; neurodevelopment; transcription factors (TFs); zebrafish.
Copyright © 2021 Dasgupta, Dunham, Truong, Simonich, Sullivan and Tanguay.
Conflict of interest statement
The authors declare that the research was conducted in the absence of any commercial or financial relationships that could be construed as a potential conflict of interest.
Figures
 only behavior response;
  morphology + behavior response;
  only morphology response and
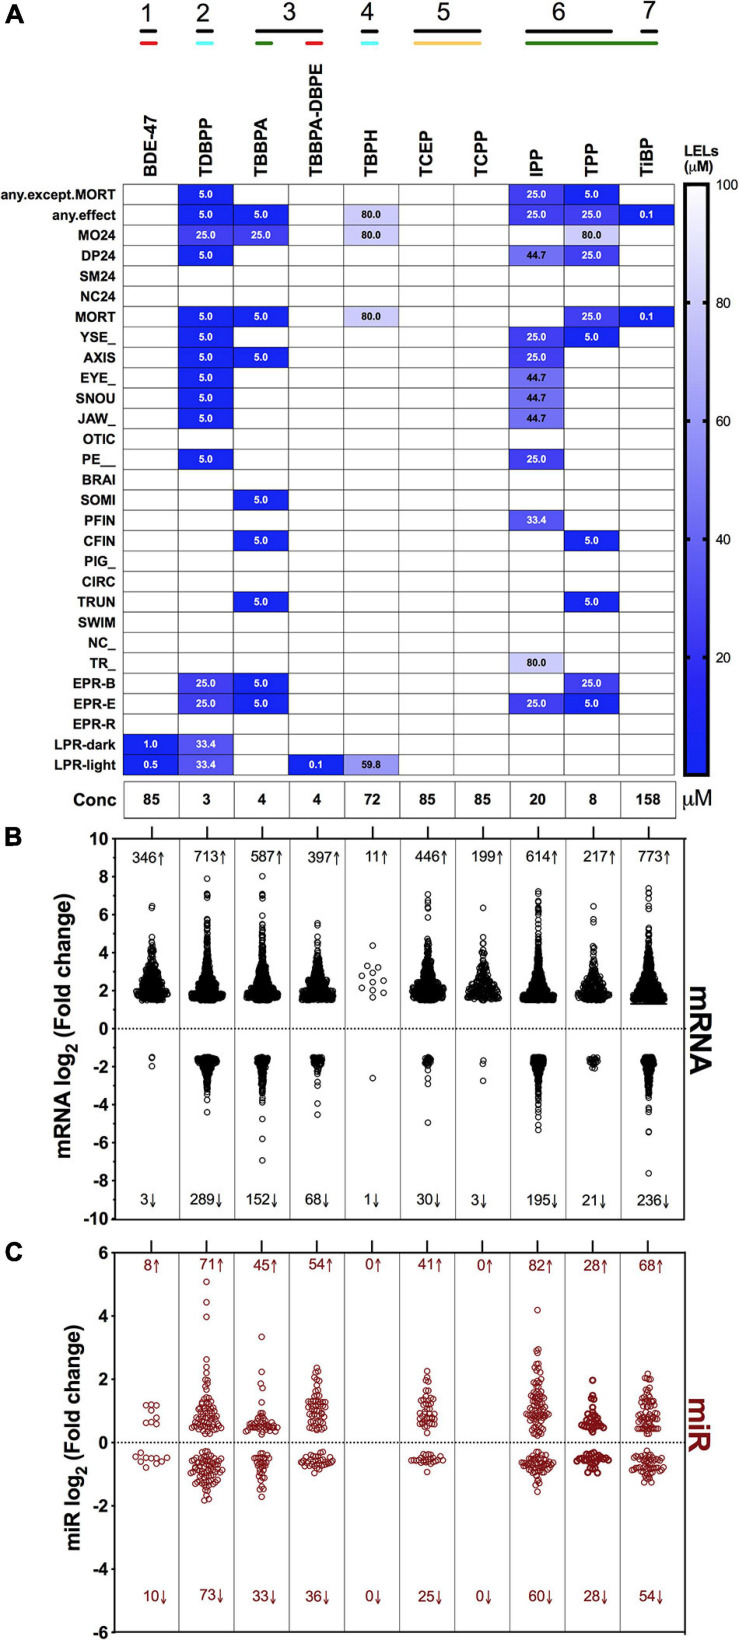
  no response. Embryonic photomotor response is included within morphology response and behavior response indicates only larval photomotor response. Numbers within cells represent LELs for each FRC/endpoint combination. (B) Log2 fold changes of all increased and decreased differentially expressed mRNAs across FRCs. Cutoff was log2 fold change ≥1.5 and p ≤ 0.05. Numbers represent number of genes with increased (↑) or decreased (↓) mRNA levels. (C) Log2 fold changes of increased and decreased miR levels across different FRCs. Cutoff was p ≤ 0.05. Numbers represent number of miRs with increased (↑) or decreased (↓) levels.
 FRCs,
FRCs,  miRs,
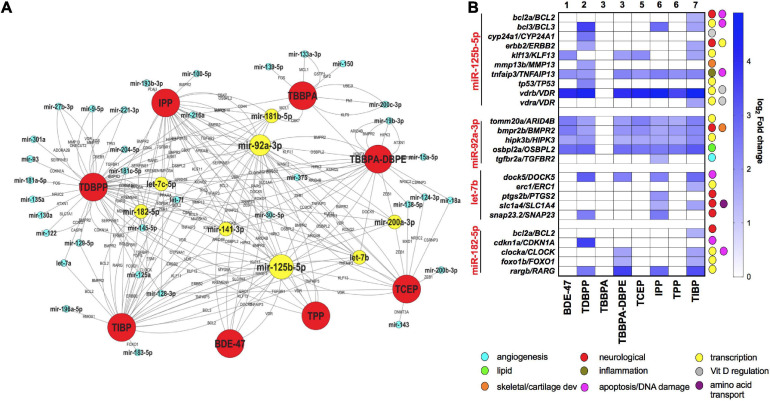
miRs,  miRs that were differentially expressed across 4 or more FRCs, with larger nodes denoting higher number of FRCs. mRNAs are represented within the connected lines. (B) Selected miRs that were decreased across multiple FRCs, with fold changes and major functions (based on GO analysis) of their anti-correlated mRNA targets in specific FRCs. Numbers represent FRC classes based on Figure 1. TBPH and TCPP not represented since there were no miR disruptions.
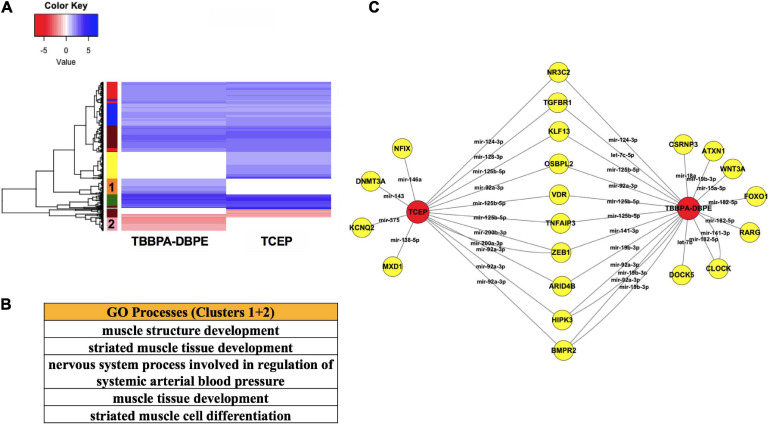
 FRC,
FRC,  genes. miRs are represented within connected lines.
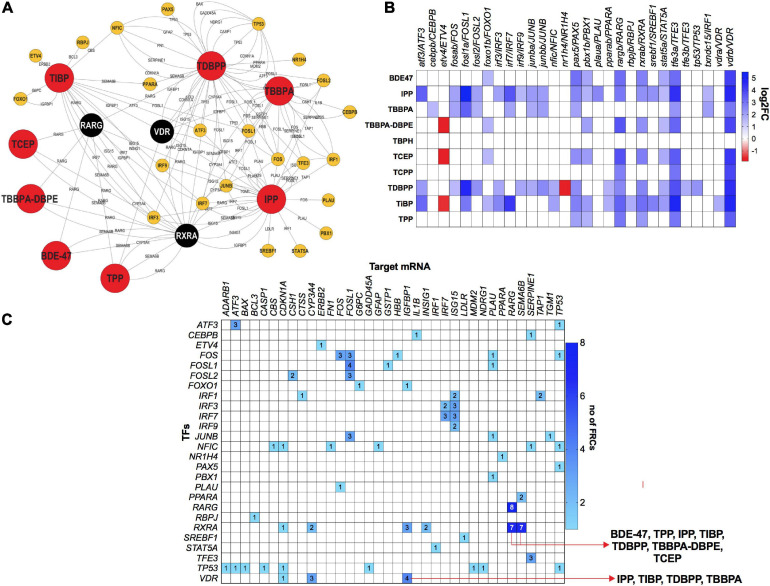 FRCs, TFs.
  (black nodes with white text)-TFs that were differentially expressed across 5 or more FRCs, with larger nodes denoting higher number of FRCs. (B) Heatmap representing fold changes of selected TFs across all FRCs. Both zebrafish and human orthologs are provided. (C) Heatmap representing mRNA-TF combinations that were co-altered across multiple FRCs. Numbers within cells represent number of FRCs that a specific pair was altered in. Red arrows represent the FRCs for specific pairs that are discussed in the manuscript. All data based on TFmiR experimentally validated predictions.
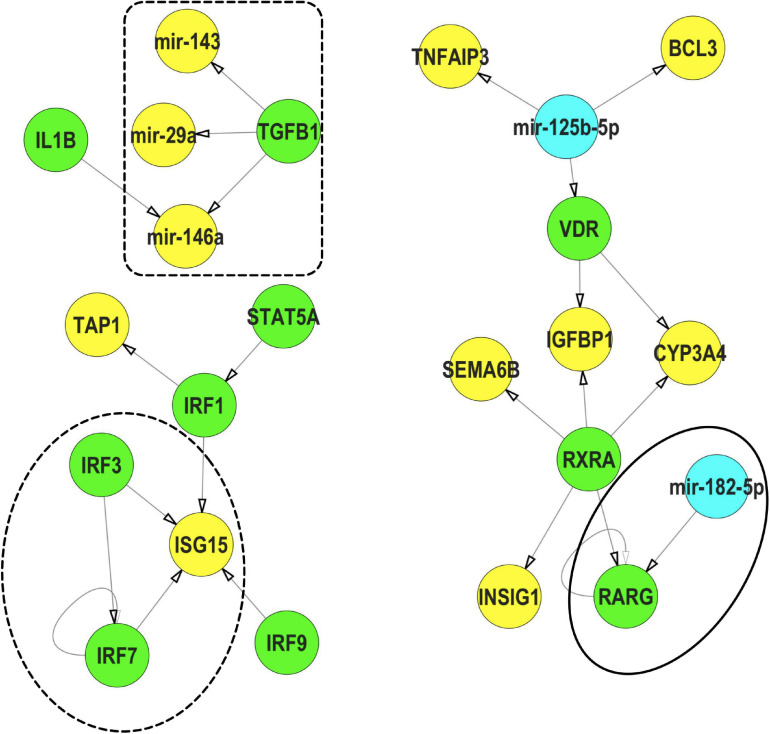
 TFs,
TFs,  miRs,
miRs,  mRNA. These interactions were selected from the mRNA-miR-TF co-regulatory network for IPP. All interaction data based on TFmiR experimentally validated predictions.
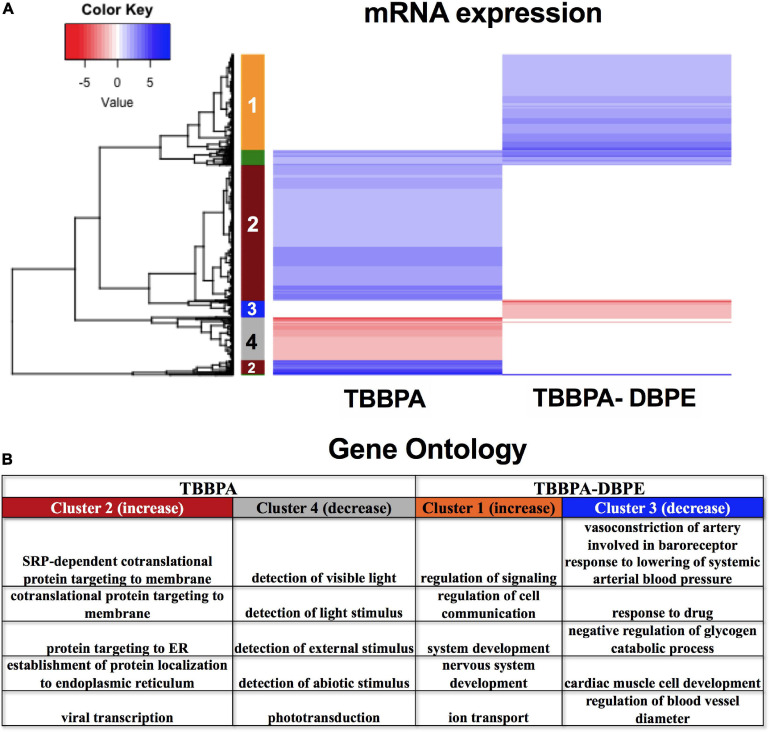
References
-
- Alzualde A., Behl M., Sipes N. S., Hsieh J. H., Alday A., Tice R. R., et al. (2018). Toxicity profiling of flame retardants in zebrafish embryos using a battery of assays for developmental toxicity, neurotoxicity, cardiotoxicity and hepatotoxicity toward human relevance. Neurotoxicol Teratol 70 40–50. 10.1016/j.ntt.2018.10.002 - DOI - PubMed
-
- Andrews S. (2015). “FastQC: A quality Control Tool for High Throughput Sequence Data”. Version 0.11, 3 Edn. Cambridge: Babraham Bioinformatics.
Grants and funding
LinkOut - more resources
Full Text Sources
Other Literature Sources
Molecular Biology Databases
Miscellaneous