Antiretroviral Drugs Regulate Epigenetic Modification of Cardiac Cells Through Modulation of H3K9 and H3K27 Acetylation
- PMID: 33898535
- PMCID: PMC8062764
- DOI: 10.3389/fcvm.2021.634774
Antiretroviral Drugs Regulate Epigenetic Modification of Cardiac Cells Through Modulation of H3K9 and H3K27 Acetylation
Abstract
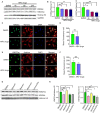
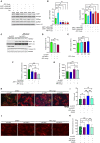
Antiretroviral therapy (ART) has significantly reduced the rate of mortality in HIV infected population, but people living with HIV (PLWH) show higher rates of cardiovascular disease (CVD). However, the effect of antiretroviral (ARV) drug treatment on cardiac cells is not clear. In this study, we explored the effect of ARV drugs in cardiomyocyte epigenetic remodeling. Primary cardiomyocytes were treated with a combination of four ARV drugs (ritonavir, abacavir, atazanavir, and lamivudine), and epigenetic changes were examined. Our data suggest that ARV drugs treatment significantly reduces acetylation at H3K9 and H3K27 and promotes methylation at H3K9 and H3K27, which are histone marks for gene expression activation and gene repression, respectively. Besides, ARV drugs treatment causes pathological changes in the cell through increased production of reactive oxygen species (ROS) and cellular hypertrophy. Further, the expression of chromatin remodeling enzymes was monitored in cardiomyocytes treated with ARV drugs using PCR array. The PCR array data indicated that the expression of epigenetic enzymes was differentially regulated in the ARV drugs treated cardiomyocytes. Consistent with the PCR array result, SIRT1, SUV39H1, and EZH2 protein expression was significantly upregulated in ARV drugs treated cardiomyocytes. Furthermore, gene expression analysis of the heart tissue from HIV+ patients showed that the expression of SIRT1, SUV39H1, and EZH2 was up-regulated in patients with a history of ART. Additionally, we found that expression of SIRT1 can protect cardiomyocytes in presence of ARV drugs through reduction of cellular ROS and cellular hypertrophy. Our results reveal that ARV drugs modulate the epigenetic histone markers involved in gene expression, and play a critical role in histone deacetylation at H3K9 and H3K27 during cellular stress. This study may lead to development of novel therapeutic strategies for the treatment of CVD in PLWH.
Keywords: ROS; SIRT1; antiretroviral therapy; cardiovascular disease; cellular hypertrophy; histone deacetylase; human immunodeficiency virus; methyltransferase.
Copyright © 2021 Kashyap, Mukker, Gupta, Datta, Rappaport, Jacobson, Ebert and Gupta.
Conflict of interest statement
The authors declare that the research was conducted in the absence of any commercial or financial relationships that could be construed as a potential conflict of interest.
Figures


Similar articles
-
HOPX Plays a Critical Role in Antiretroviral Drugs Induced Epigenetic Modification and Cardiac Hypertrophy.Cells. 2021 Dec 8;10(12):3458. doi: 10.3390/cells10123458. Cells. 2021. PMID: 34943964 Free PMC article.
-
Eugenol attenuates ischemia-mediated oxidative stress in cardiomyocytes via acetylation of histone at H3K27.Free Radic Biol Med. 2023 Jan;194:326-336. doi: 10.1016/j.freeradbiomed.2022.12.007. Epub 2022 Dec 13. Free Radic Biol Med. 2023. PMID: 36526244 Free PMC article.
-
Oxidative stress and chromatin remodeling in chronic obstructive pulmonary disease and smoking-related diseases.Antioxid Redox Signal. 2013 May 20;18(15):1956-71. doi: 10.1089/ars.2012.4863. Epub 2012 Nov 6. Antioxid Redox Signal. 2013. PMID: 22978694 Free PMC article. Review.
-
SIRT1-dependent modulation of methylation and acetylation of histone H3 on lysine 9 (H3K9) in the zygotic pronuclei improves porcine embryo development.J Anim Sci Biotechnol. 2017 Nov 1;8:83. doi: 10.1186/s40104-017-0214-0. eCollection 2017. J Anim Sci Biotechnol. 2017. PMID: 29118980 Free PMC article.
-
Chromatin modifications remodel cardiac gene expression.Cardiovasc Res. 2014 Jul 1;103(1):7-16. doi: 10.1093/cvr/cvu122. Epub 2014 May 8. Cardiovasc Res. 2014. PMID: 24812277 Review.
Cited by
-
HIV Protein Nef Induces Cardiomyopathy Through Induction of Bcl2 and p21.Int J Mol Sci. 2024 Oct 23;25(21):11401. doi: 10.3390/ijms252111401. Int J Mol Sci. 2024. PMID: 39518954 Free PMC article.
-
Development of innate immune memory by non-immune cells during Staphylococcus aureus infection depends on reactive oxygen species.Front Immunol. 2023 May 31;14:1138539. doi: 10.3389/fimmu.2023.1138539. eCollection 2023. Front Immunol. 2023. PMID: 37325649 Free PMC article.
-
Roles of histone acetylation sites in cardiac hypertrophy and heart failure.Front Cardiovasc Med. 2023 Mar 15;10:1133611. doi: 10.3389/fcvm.2023.1133611. eCollection 2023. Front Cardiovasc Med. 2023. PMID: 37008337 Free PMC article. Review.
-
Direct and indirect cardiovascular and cardiometabolic sequelae of the combined anti-retroviral therapy on people living with HIV.Front Physiol. 2023 Mar 27;14:1118653. doi: 10.3389/fphys.2023.1118653. eCollection 2023. Front Physiol. 2023. PMID: 37078025 Free PMC article. Review.
-
HOPX Plays a Critical Role in Antiretroviral Drugs Induced Epigenetic Modification and Cardiac Hypertrophy.Cells. 2021 Dec 8;10(12):3458. doi: 10.3390/cells10123458. Cells. 2021. PMID: 34943964 Free PMC article.
References
-
- (UNAIDS) J.U.N.P.o.H.A. Fact Sheet: World AIDS Day 2019—Global HIV Statistics. Geneva: (2019).
Grants and funding
LinkOut - more resources
Full Text Sources
Other Literature Sources

