Case Reports
. 2021 Apr 7:8:636718.
doi: 10.3389/fcvm.2021.636718. eCollection 2021.

Clinical Utility of Fluid Volume Assessment in Heart Failure Patients Using Bioimpedance Spectroscopy

Affiliations
Case Reports

Clinical Utility of Fluid Volume Assessment in Heart Failure Patients Using Bioimpedance Spectroscopy

Andrew J Accardi et al. Front Cardiovasc Med. .

Abstract

Background: Bioimpedance spectroscopy (BIS) is a non-invasive method used to measure fluid volumes. In this report, we compare BIS measurements from patients with heart failure (HF) to those from healthy adults, and describe how these point-of-care fluid volume assessments may be applied to HF management. Methods and results: Fluid volumes were measured in 64 patients with NYHA class II or III HF and 69 healthy control subjects. BIS parameters including extracellular fluid (ECF), intracellular fluid (ICF), total body water (TBW), and ECF as a percentage of TBW (ECF%TBW) were analyzed. ECF%TBW values for the HF and control populations differed significantly (49.2 ± 3.2% vs. 45.2 ± 2.1%, respectively; p < 0.001); both distributions satisfied criteria for normality. Interquartile ranges did not overlap (46.7-51.0% vs. 43.8-46.4%, respectively; p < 0.001). Subgroup analyses of HF patients who underwent transthoracic echocardiography showed that impedance measurements correlated with inferior vena cava size (Pearson correlation -0.73, p < 0.0001). A case study is presented for illustrative purposes. Conclusions: BIS-measured ECF%TBW values were significantly higher in HF patients as compared to adults without HF. We describe three strata of ECF%TBW (normal, elevated, fluid overload) that may aid in clinical risk stratification and fluid volume monitoring of HF patients. Clinical Trial Registration: COMPARE - www.ClinicalTrials.gov; IMPEL - www.ClinicalTrials.gov; Heart Failure at Home - www.ClinicalTrials.gov, identifier: NCT02939053; NCT02857231; NCT04013373.

Keywords: bioimpedance spectroscopy; case study; extracellular fluid; heart failure; total body water.


Conflict of interest statement

AA, AD-B, and JH provide consultancy services to ImpediMed. BM and RG are employees of ImpediMed. As funder of this clinical research, ImpediMed provided no-cost access to bioimpedance spectroscopy devices for use in accordance with clinical trial protocols. ImpediMed also provided funding for clinical trial-related costs and third-party data management and biostatistical support.

Figures
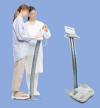
Figure 1
Figure 1
SOZO device. As shown, the device is configured to perform bioimpedance spectroscopy (BIS) measurements with the subject in a standing position. Bare hands and feet must be in direct contact with the electrodes (i.e., no shoes, socks, stockings, or gloves), and metallic/electronic items should be removed. BIS measurement and fluid status reporting takes ~30 s.
Figure 2
Figure 2
Extracellular fluid percentage of total body water; histogram (A), cumulative frequency curves (B). Extracellular fluid percentage of total body water (ECF%TBW) for Healthy Control Subjects (CON-pop, N = 69, shown in gray) and Heart Failure Patients (HF-pop, N = 64, shown in blue); histogram (A), and cumulative frequency curves (B).
Figure 3
Figure 3
Extracellular fluid percentage of total body water; box-and-whisker plots (A), and clinical strata (B). (A) box-and-whisker plots for bioimpedance spectroscopy-derived extracellular fluid percentage of total body water (ECF%TBW) for Healthy Control Subjects (CON-pop, gray plot) and Heart Failure Patients (HF-pop, blue plot). (B) Normal, bottom three CON-pop quartiles; Elevated, bound by CON-pop 3rd quartile and HF-pop 3rd quartile; Fluid Overload, highest HF-pop quartile.
Figure 4
Figure 4
Lower extremity R0 impedance measurements vs. inferior vena cava (IVC) size; left leg (A), right leg (B). Left leg (A) and right leg (B) scatter plots for R0 impedance vs. inferior vena cava (IVC) size for the subgroup of 12 heart failure patients enrolled in the IMPEL clinical study (ClinicalTrials.gov identifier NCT02857231). Right atrial pressure (RAP) categories: RAP1 in gray (<8 mmHg), RAP2 in orange (8–14.99 mmHg), and in blue RAP3 (15 mmHg). R0 impedance is inversely related to extracellular fluid volume. Hence, in both legs, lower impedance values are associated with larger IVC size and higher right atrial pressures. R0, resistance at zero Hertz; IVC, inferior vena cava; RAP, right atrial pressure; cm, centimeter.
Figure 5
Figure 5
Case Study: 87 year-old man with two heart failure readmissions. ECF, extracellular fluid; ICF, intracellular fluid; TBW, total body water; ECF%TBW, extracellular fluid as a percentage of total body water; mg, milligram; po, oral; qd, daily; L, liters; kg, kilograms; BIS, bioimpedance spectroscopy; SNF, skilled nursing facility. The red line at 51% ECF%TBW indicates the transition from elevated fluid volume to fluid overload.

Similar articles

Cited by

References

    1. Savarese G, Lund LH. Global public health burden of heart failure. Cardiac Failure Rev. (2017) 3:7–11. 10.15420/cfr.2016:25:2 - DOI - PMC - PubMed
    1. Benjamin EJ, Muntner P, Alonso A, Bittencourt MS, Callaway CW, Carson AP, et al. . Heart disease and stroke statistics-2019 update: a report from the American Heart Association. Circulation. (2019) 139:e56–528. 10.1161/CIR.0000000000000659 - DOI - PubMed
    1. Anand I. Stable but progressive nature of heart failure: considerations for primary care physicians. Am J Cardiovasc Drugs. (2018) 18:333–45. 10.1007/s40256-018-0277-0 - DOI - PMC - PubMed
    1. Dharmarajan K, Hsieh AF, Lin Z, Bueno H, Ross JS, Horwitz LI, et al. . Diagnoses and timing of 30-day readmissions after hospitalization for heart failure, acute myocardial infarction, or pneumonia. Jama. (2013) 309:355–63. 10.1001/jama.2012.216476 - DOI - PMC - PubMed
    1. Desai AS, Stevenson LW. Rehospitalization for heart failure: predict or prevent? Circulation. (2012) 126:501–6. 10.1161/CIRCULATIONAHA.112.125435 - DOI - PubMed

Publication types

Associated data