. 2021 Jun:14:100799.
doi: 10.1016/j.ssmph.2021.100799. Epub 2021 Apr 21.

Linking excess mortality to mobility data during the first wave of COVID-19 in England and Wales

Affiliations

Linking excess mortality to mobility data during the first wave of COVID-19 in England and Wales

Ugofilippo Basellini et al. SSM Popul Health. 2021 Jun.

Abstract

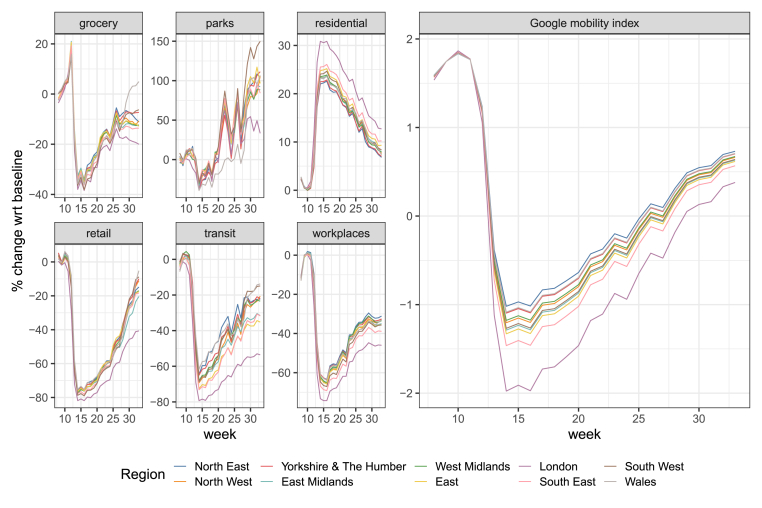
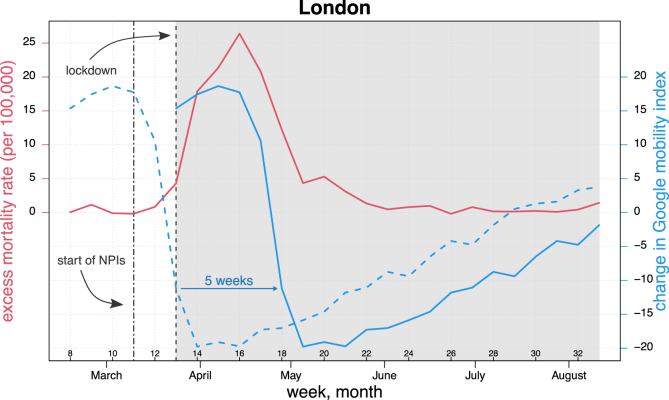
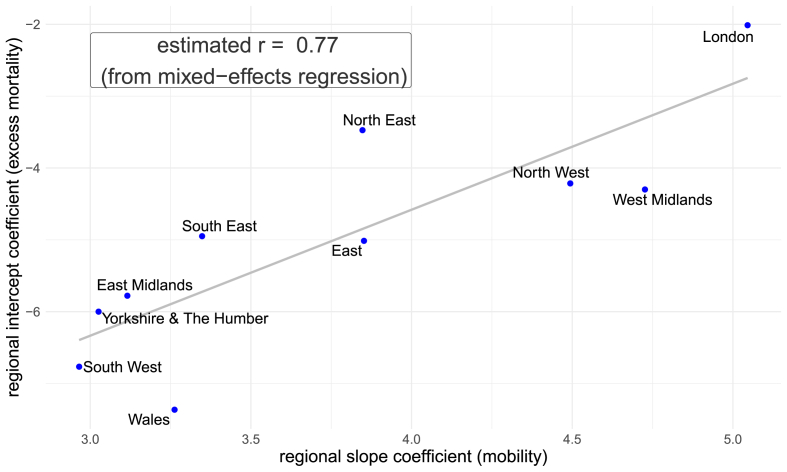
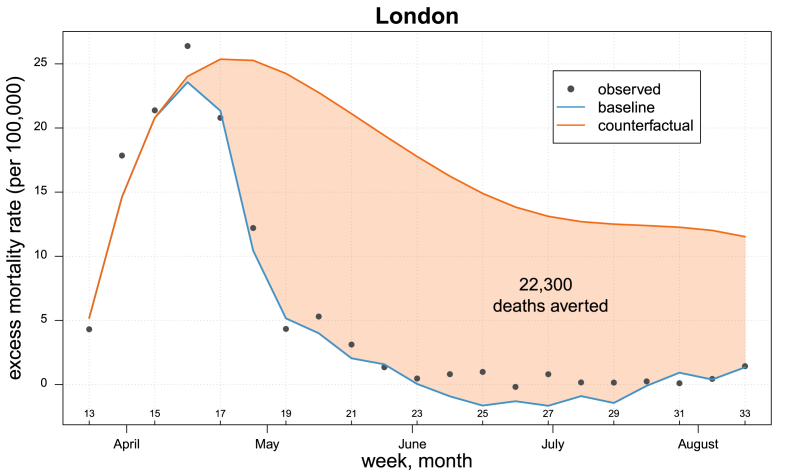
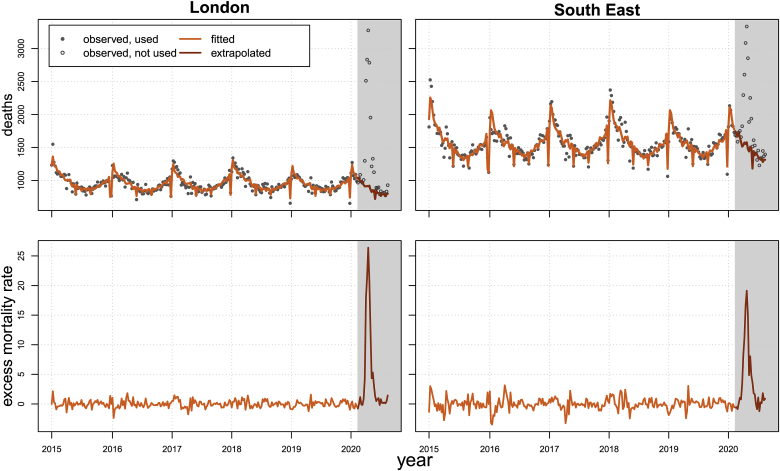
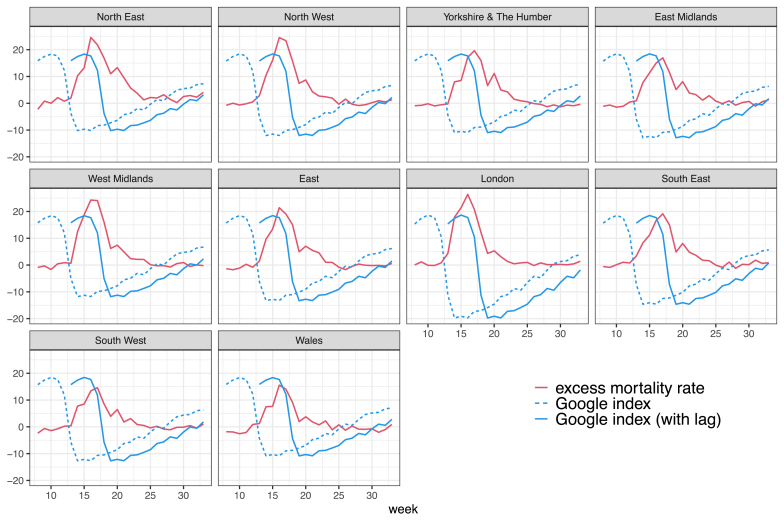
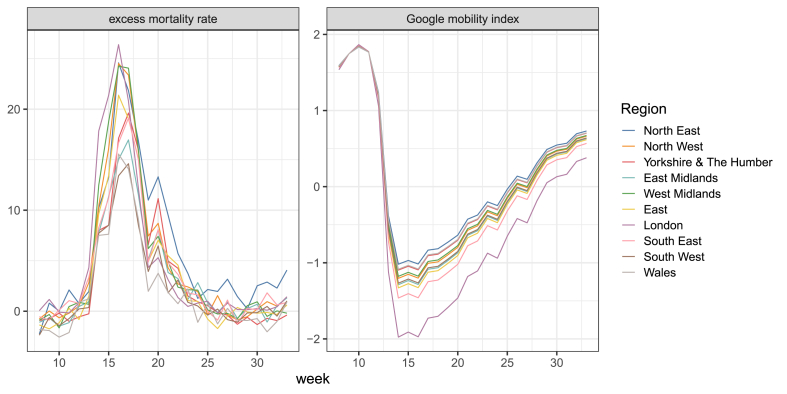
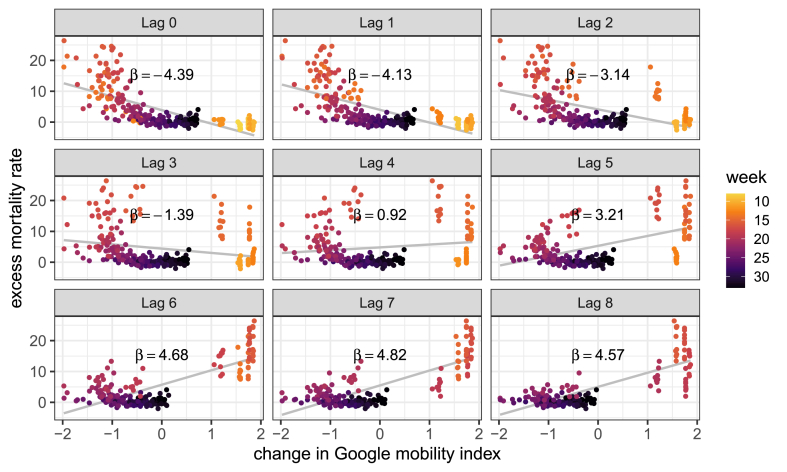
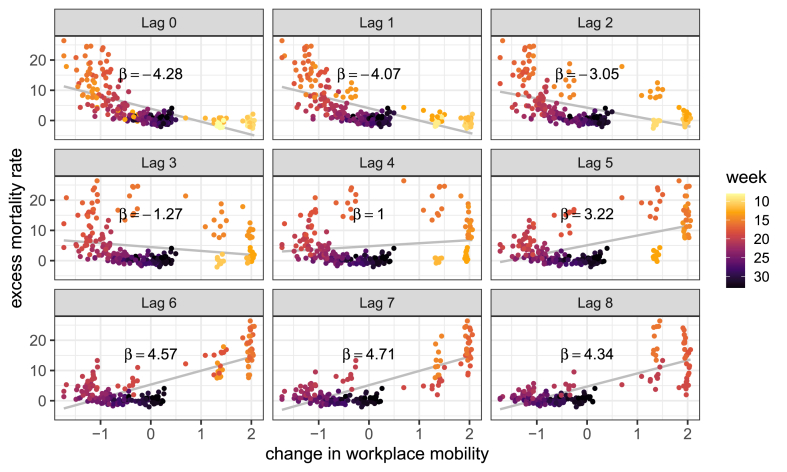
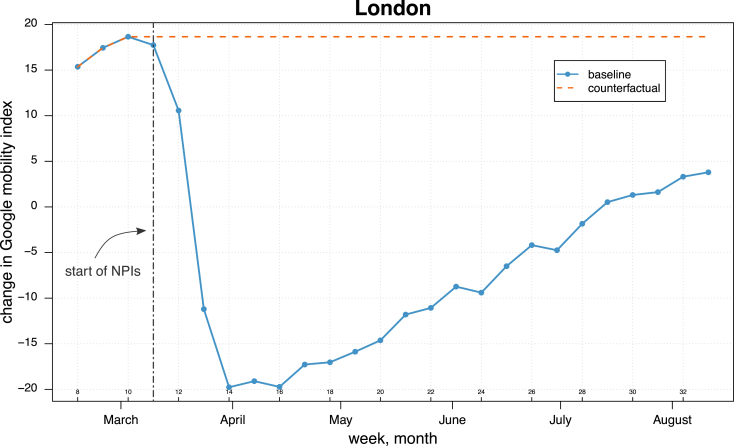
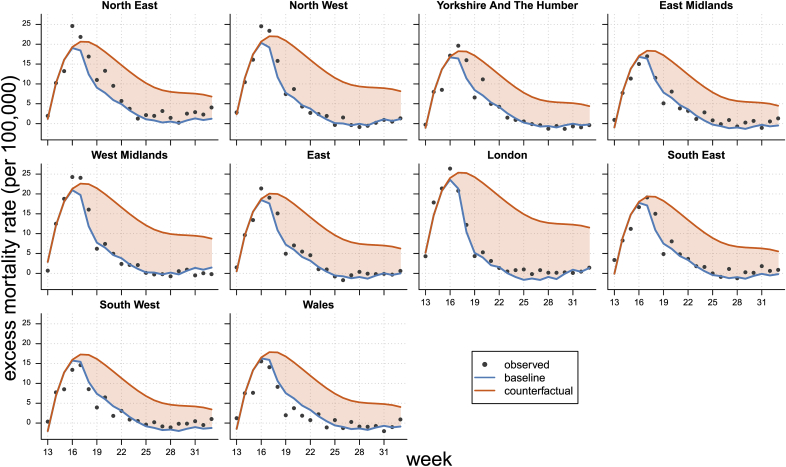
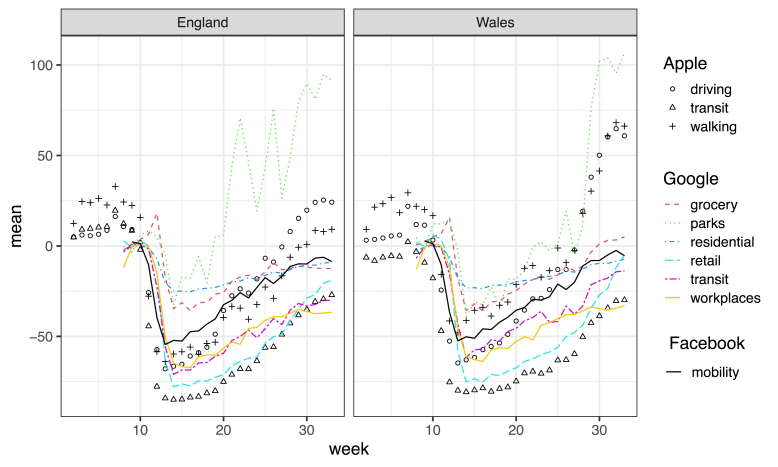
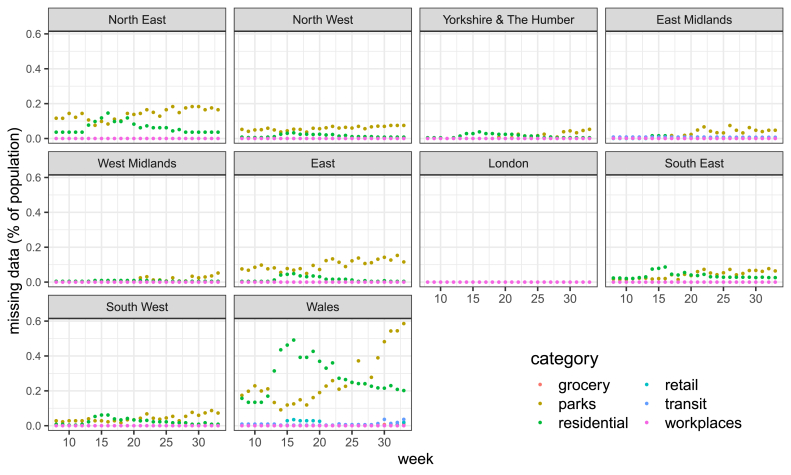
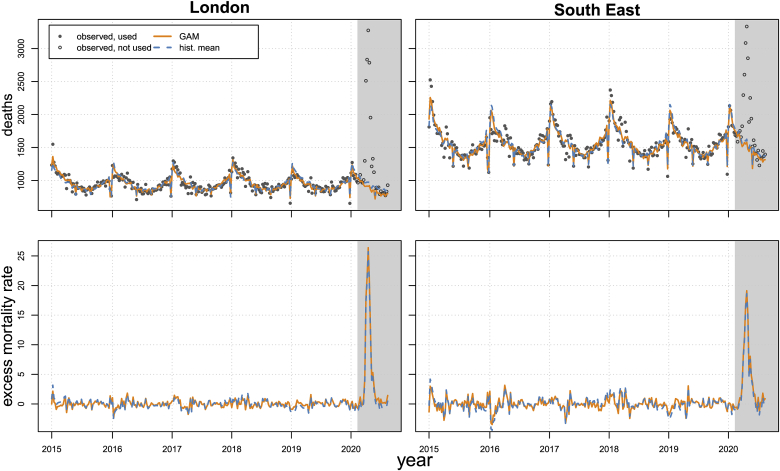
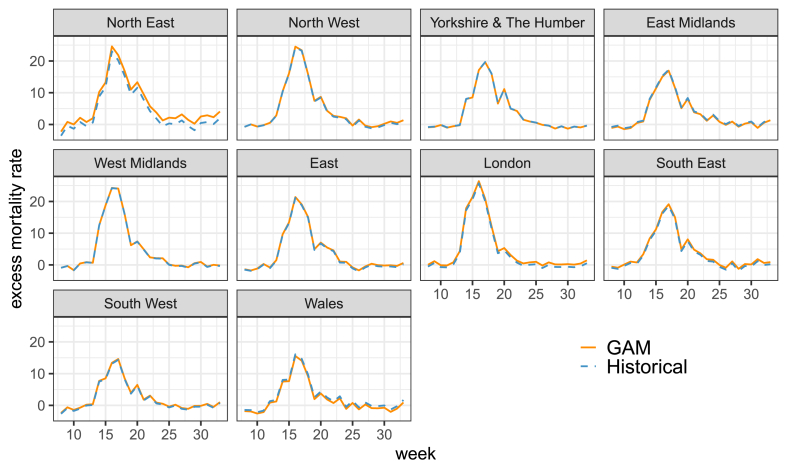
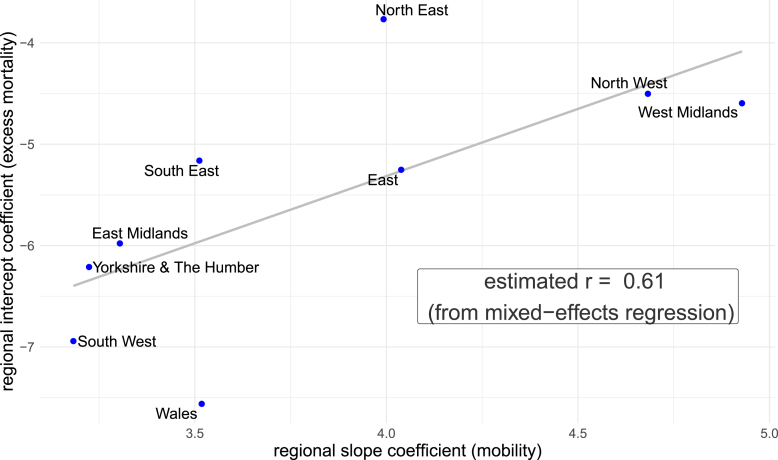
Non-pharmaceutical interventions have been implemented worldwide to curb the spread of COVID-19. However, the effectiveness of such governmental measures in reducing the mortality burden remains a key question of scientific interest and public debate. In this study, we leverage digital mobility data to assess the effects of reduced human mobility on excess mortality, focusing on regional data in England and Wales between February and August 2020. We estimate a robust association between mobility reductions and lower excess mortality, after adjusting for time trends and regional differences in a mixed-effects regression framework and considering a five-week lag between the two measures. We predict that, in the absence of mobility reductions, the number of excess deaths could have more than doubled in England and Wales during this period, especially in the London area. The study is one of the first attempts to quantify the effects of mobility reductions on excess mortality during the COVID-19 pandemic.

Keywords: Digital trace data; Human mobility; Non-pharmaceutical interventions; SARS-CoV-2.


Conflict of interest statement

The authors declare no competing interests.

Figures

Fig. 1
Fig. 1
Six categories of the GCMR and their combination into the Google mobility index in England and Wales by region during weeks 8–33 of 2020. Source: Authors' own elaboration based on data from Google LLC (2021).
Fig. 2
Fig. 2
Time series of excess mortality rate per 100,000 individuals (red line) and change in Google mobility index at week t (dashed blue line) and with a five-week forward shift (solid blue line) in the region of London during weeks 8–33 of 2020. Solid lines in the grey shaded area correspond to values analysed as described in the “Statistical analysis” section. Vertical lines indicate the start of NPIs on March 12 (week 11) and the lockdown ordered on March 24 (week 13), respectively. The Google index was multiplied by 10 for illustration purposes. Source: Authors' own elaboration based on data from Office for National Statistics (2021, and Google LLC (2021). (For interpretation of the references to colour in this figure legend, the reader is referred to the Web version of this article.)
Fig. 3
Fig. 3
Estimated region-specific intercepts and mobility slopes, as well as their estimated correlation r from the mixed-effects regression in England and Wales by region during weeks 13–33 of 2020. Source: Authors' own elaboration based on data from Office for National Statistics (2021, and Google LLC (2021).
Fig. 4
Fig. 4
Observed and estimated excess mortality rate (per 100,000 individuals) from the mixed-effects model in the baseline and counterfactual scenarios for the region of London during weeks 13–33 of 2020. Source: Authors' own elaboration based on data from Office for National Statistics (2021, and Google LLC (2021).
Figure A.1
Figure A.1
Observed (dots) and fitted (lines) weekly number of deaths (upper panels) and excess mortality rate (per 100,000 individuals, lower panels) in the regions of London and South East for the years 2015–2020. The grey shaded area corresponds to the COVID-19 period analysed in the paper. Source: Authors' own elaboration based on data from Office for National Statistics (2021, .
Figure A.2
Figure A.2
Time series of excess mortality rate per 100,000 individuals (red lines) and change in Google mobility index in week t (dashed blue lines) and with a five-week forward shift (solid blue lines) in England and Wales by region during weeks 8–33 of 2020. The Google index was multiplied by 10 for illustration purposes. Source: Authors' own elaboration based on data from Office for National Statistics (2021, and Google LLC (2021).
Figure A.3
Figure A.3
Time series of excess mortality rate per 100,000 individuals and change in Google mobility index in England and Wales by region during weeks 8–33 of 2020. Source: Authors' own elaboration based on data from Office for National Statistics (2021, and Google LLC (2021).
Figure A.4
Figure A.4
Linear relationship (with slope equal to β) between excess mortality rate (per 100,000 individuals) and change in the Google mobility index in ten regions of England and Wales during weeks 8–33 of 2020, considering different lags of time for mobility data. Source: Authors' own elaboration based on data from Office for National Statistics (2021, and Google LLC (2021).
Figure A.5
Figure A.5
Linear relationship (with slope equal to β) between excess mortality rate (per 100,000 individuals) and (scaled) change in workplace mobility in ten regions of England and Wales during weeks 8–33 of 2020, considering different time lags for mobility data. Source: Authors' own elaboration based on data from Office for National Statistics (2021, and Google LLC (2021).
Figure A.6
Figure A.6
Changes in the Google mobility index in the baseline and counterfactual scenarios for the region of London during weeks 8–33 of 2020. Source: Authors' own elaboration based on data from Google LLC (2021).
Figure A.7
Figure A.7
Observed and estimated excess mortality rate (per 100,000 individuals) from the mixed-effects model in the baseline and counterfactual scenarios for the ten regions in England and Wales during weeks 13–33 of 2020. Source: Authors' own elaboration based on data from Office for National Statistics (2021, and Google LLC (2021).
Figure A.8
Figure A.8
Comparison of mobility indicators provided by Apple (categories driving, transit and walking), Facebook (category mobility) and Google (categories residential, workplaces, grocery, transit, retail and parks) for England and Wales in weeks 1–33 of 2020. Note: the sign of the residential category of Google is reversed for illustrative purposes. Source: Authors' own elaboration based on data from Apple (2020), Google LLC (2021) and Facebook (2020).
Figure A.9
Figure A.9
Share of missing population in the GCMR by region, week and category (residential, workplaces, grocery, transit, retail and parks) for ten regions in England and Wales in weeks 8–33 of 2020. Source: Authors' own elaboration based on data from Google LLC (2021).
Figure B.1
Figure B.1
Observed (dots) and fitted (lines) weekly number of deaths (upper panels) and excess mortality rate (per 100,000 individuals, lower panels) using two different approaches (GAM in orange, weekly historical mean in blue) in the regions of London and South East for the years 2015–2020. Source: Authors' own elaboration based on data from Office for National Statistics (2021, .
Figure B.2
Figure B.2
Excess mortality rate (per 100,000 individuals) computed with two different approaches (GAM in orange, weekly historical mean in blue) in the ten regions of England and Wales during the weeks 8–33 of 2020. Source: Authors' own elaboration based on data from Office for National Statistics (2021, .
Fig. B.3
Fig. B.3
Estimated region-specific intercepts and mobility coefficients, as well as their estimated correlation r from the mixed-effects regression in nine regions of England and Wales (excluding London) during weeks 13–33 of 2020. Source: Authors' own elaboration based on data from Office for National Statistics (2021, and Google LLC (2021).

References

    1. Aburto J.M., Kashyap R., Schöley J., Angus C., Ermisch J., Mills M.C., Dowd J.B. Estimating the burden of the COVID-19 pandemic on mortality, life expectancy and lifespan inequality in england and Wales: A population-level analysis. Journal of Epidemiology & Community Health. 2021 doi: 10.1136/jech-2020-215505. - DOI - PMC - PubMed
    1. Apple COVID-19 - mobility trends reports. 2020. https://covid19.apple.com/mobility Available at:
    1. Badr H.S., Du H., Marshall M., Dong E., Squire M.M., Gardner L.M. Association between mobility patterns and COVID-19 transmission in the USA: A mathematical modelling study. The Lancet Infectious Diseases. 2020;20(11):1247–1254. doi: 10.1016/S1473-3099(20)30553-3. - DOI - PMC - PubMed
    1. Bates D., Mächler M., Bolker B., Walker S. Fitting linear mixed-effects models using lme4. Journal of Statistical Software. 2015;67(1):1–48.
    1. Brauner J.M., Mindermann S., Sharma M., Johnston D., Salvatier J., Gavenčiak T.…Kulveit J. Inferring the effectiveness of government interventions against COVID-19. Science. 2020;371(6531) doi: 10.1126/science.abd9338. - DOI - PMC - PubMed

LinkOut - more resources