. 2021 Mar 23;24(4):102354.
doi: 10.1016/j.isci.2021.102354. eCollection 2021 Apr 23.

Analysis of biological noise in the flagellar length control system

Affiliations

Analysis of biological noise in the flagellar length control system

David Bauer et al. iScience. .

Abstract

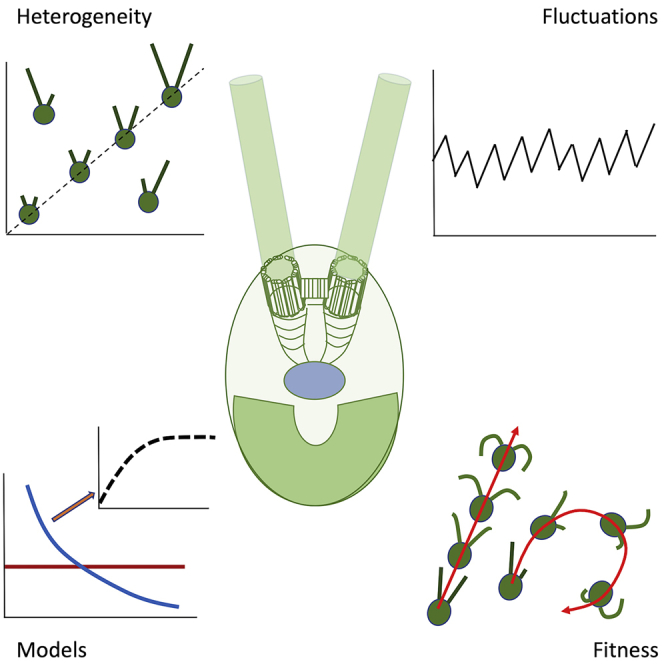
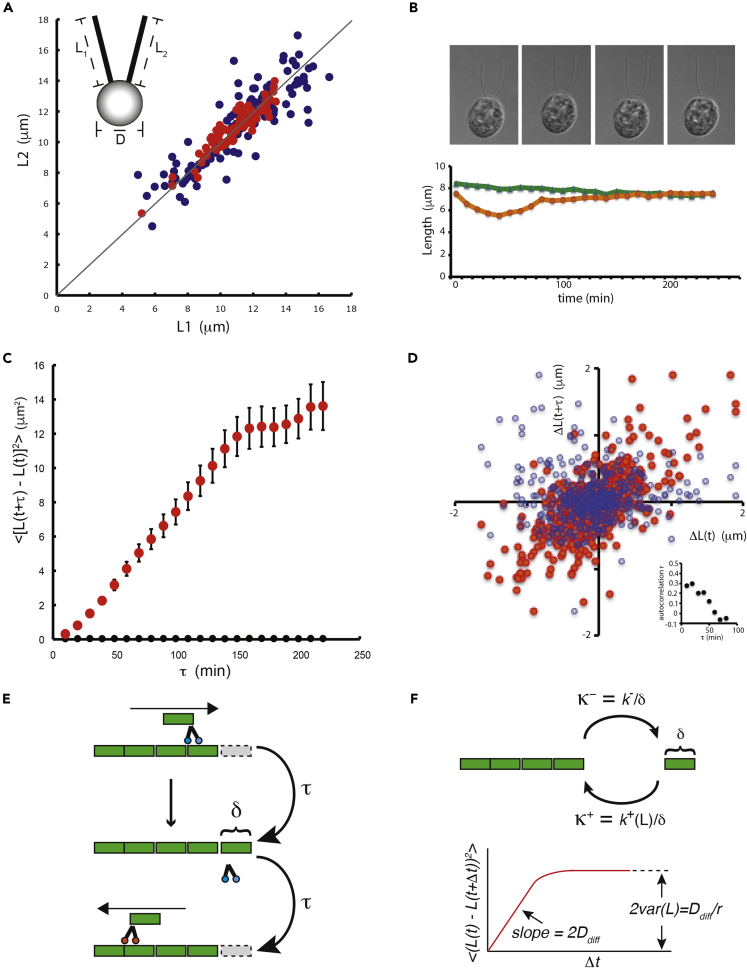
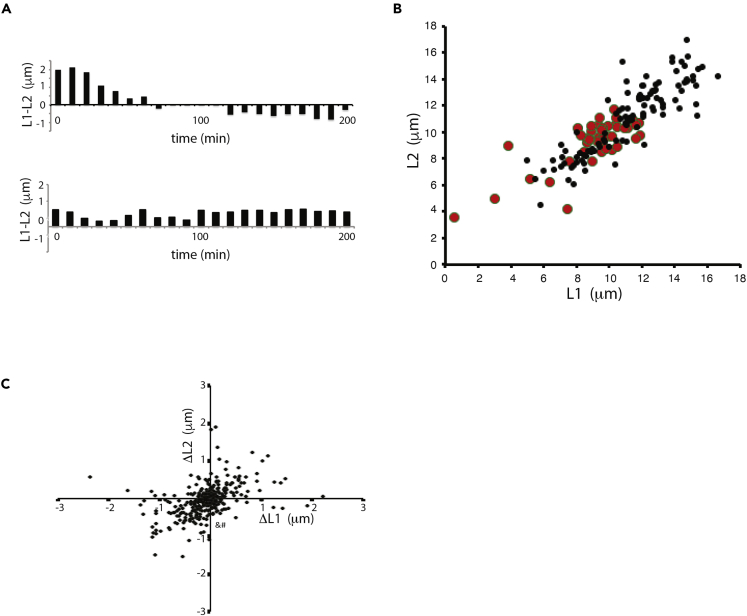
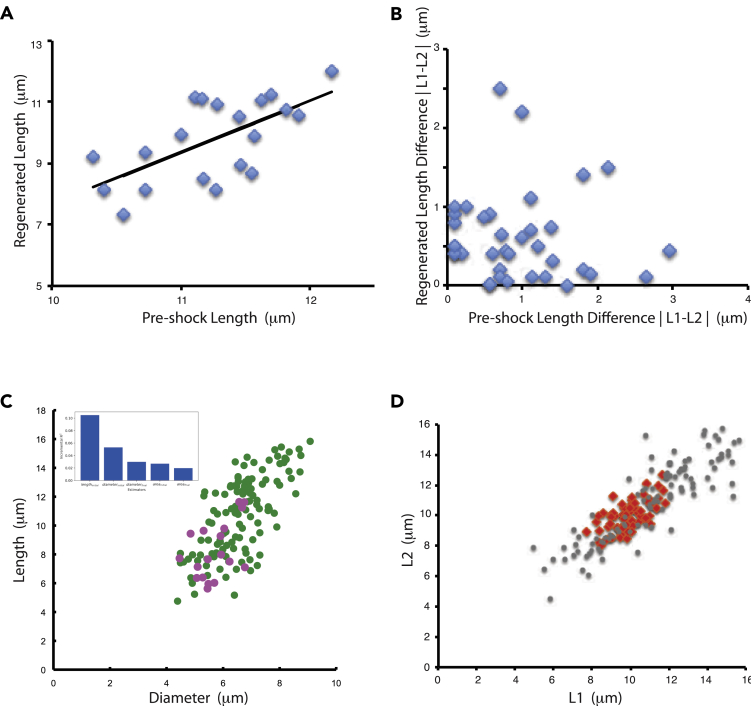
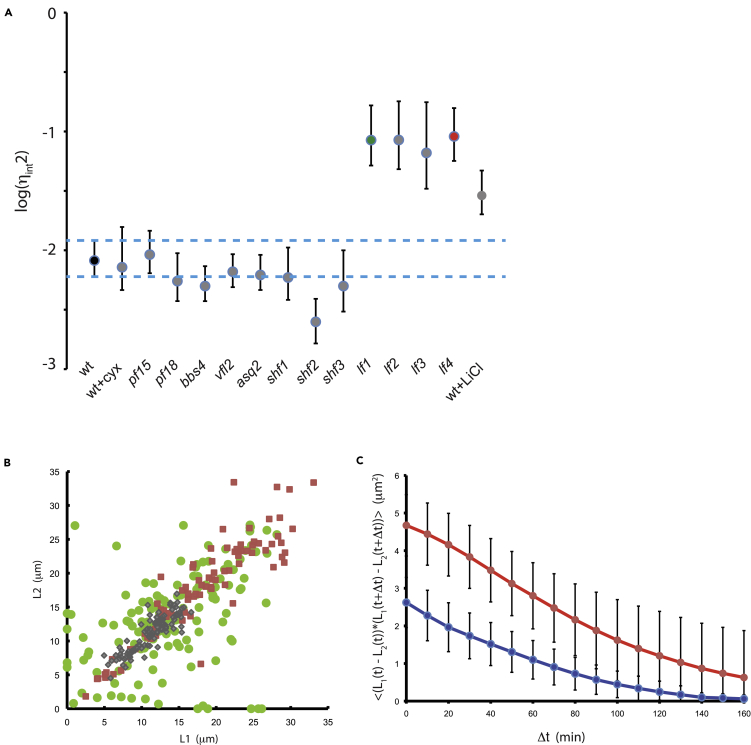
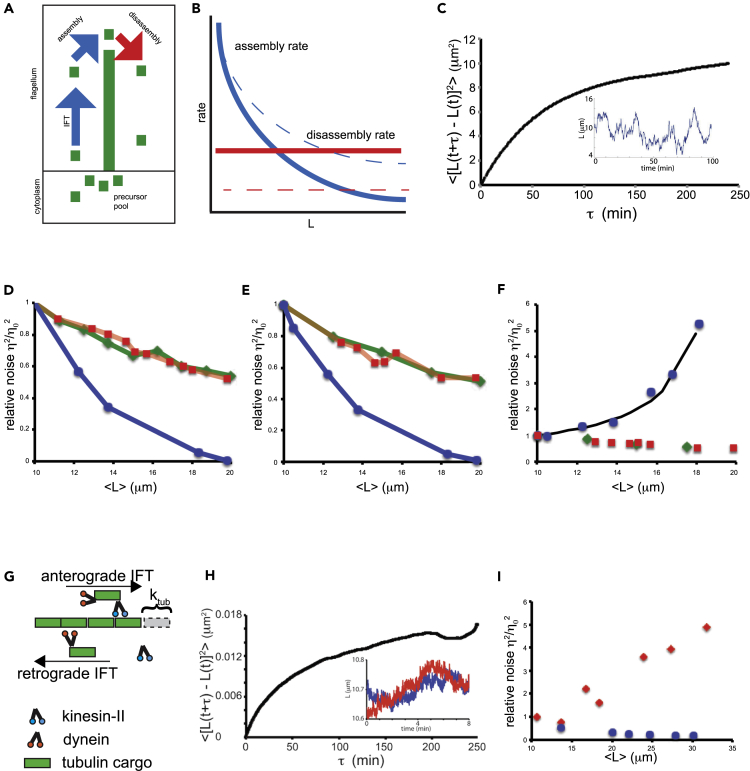
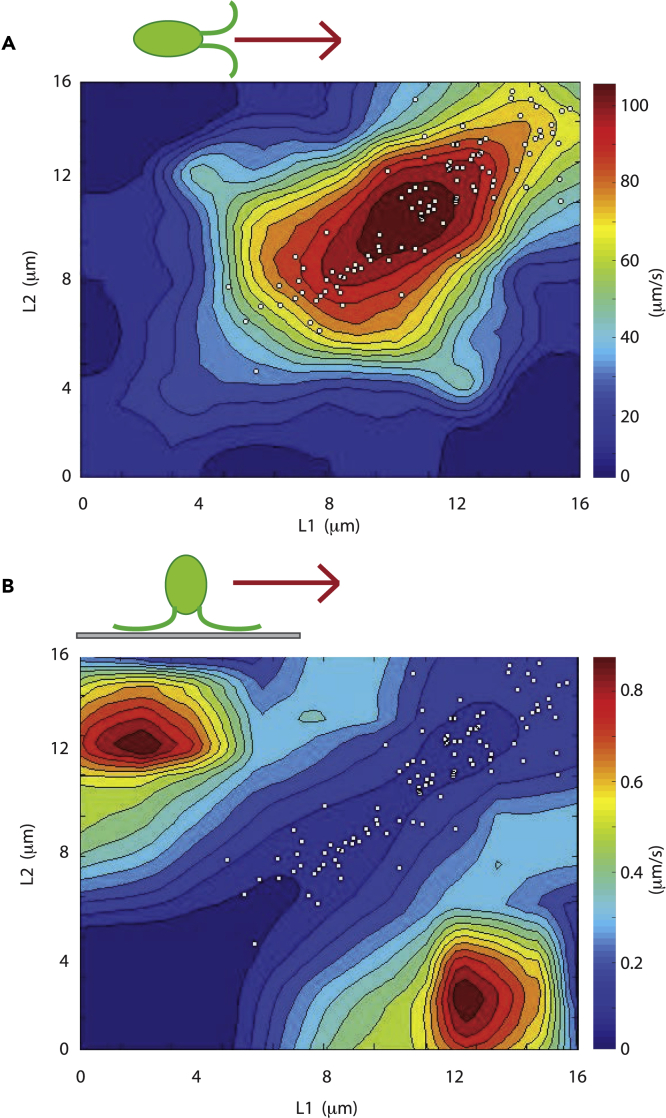
Any proposed mechanism for organelle size control should be able to account not only for average size but also for the variation in size. We analyzed cell-to-cell variation and within-cell variation of length for the two flagella in Chlamydomonas, finding that cell-to-cell variation is dominated by cell size, whereas within-cell variation results from dynamic fluctuations. Fluctuation analysis suggests tubulin assembly is not directly coupled with intraflagellar transport (IFT) and that the observed length fluctuations reflect tubulin assembly and disassembly events involving large numbers of tubulin dimers. Length variation is increased in long-flagella mutants, an effect consistent with theoretical models for flagellar length regulation. Cells with unequal flagellar lengths show impaired swimming but improved gliding, raising the possibility that cells have evolved mechanisms to tune biological noise in flagellar length. Analysis of noise at the level of organelle size provides a way to probe the mechanisms determining cell geometry.

Keywords: Biological Sciences; Biophysics; Cell Biology; Mathematical Biosciences; Molecular Biology.


Conflict of interest statement

The authors declare no competing interests.

Figures

None
Graphical abstract
Figure 1
Figure 1
Measuring correlated and uncorrelated noise in flagellar length control system (A) Correlated and uncorrelated components of variation can be visualized in measurements of flagellar length in fixed Chlamydomonas cells with two equivalent flagella. The lengths of the two flagella in a cell are denoted L1 and L2 as illustrated in the diagram, where L1 is whichever flagellum happens to be to the left of the other in the field of view of the microscope. Graph plots length of one flagellum versus length of the other flagellum. Correlated variation is reflected by scatter along the diagonal L1 = L2 (gray line). Uncorrelated variation is reflected by scatter perpendicular to this axis. (Blue) Wild-type asynchronous culture; (red) wild-type gametes. (Inset) Diagram of a Chlamydomonas cell showing the three measurements reported in this paper. (B) Dynamic changes in flagellar length. Image shows four successive time points, taken 10 min apart, of a 3D time series of a single living cell embedded in agarose and imaged with DIC microscopy. Graph below plots sample traces showing the length of two flagella within one cell versus time. (C) Quantifying fluctuations in length observed in living cells. (Red) Mean-squared change in length plotted versus time, showing constrained diffusion-like behavior. Error bars signify standard error of the mean. (Black) Mean-squared change in length in glutaraldehyde-fixed cells as an indicator of measurement error. (D) Correlation between length changes in successive 10-min intervals (red markers, r = 0.28) compared with length changes during 10-min intervals separated by 60 min (blue markers, r = 0.015). Inset gives autocorrelation of length changes (specified by the Pearson coefficient r, which is unitless) versus time lag. (E) IFT-coupled model for length fluctuations. Tubulin subunits (green) are brought to the end of the flagellum by anterograde IFT particles (blue) and deposited onto the tip, elongating the flagellum. Tubulin subunits disassembling from the tip are immediately brought back to the cell body by retrograde IFT particles (orange), shortening the flagellum. At steady state, elongation and shortening events occur at the same average rate, but stochastic differences in the quantity of tubulin added or removed results in a net change in length of δ at a rate comparable to the frequency 1/τ of IFT trains arriving at or departing from the tip. (F) IFT-uncoupled model for length fluctuations. IFT maintains a pool of tubulin monomers near the tip, which undergo association or dissociation events at rates Κ+ and Κ, respectively. Assembly rate Κ+ is length dependent, creating an effective restoring force. The resulting Ornstein-Uhlenbeck process, which describes diffusion of flagellar length constrained by the presence of a restoring force, defines the slope and asymptote of the mean-squared length change versus time plot, as indicated by the diagram. This theoretical prediction can be directly compared with Figure 1C.
Figure 2
Figure 2
Locked-in versus dynamic length variation (A) Sign change test for locked-in flagellar length differences. Each plot shows the length difference between two flagella in one cell, plotted for successive time points. Top example is of a cell showing signal reversal, indicating that neither flagellum is consistently longer than the other. (B) Genetic test for locked-in flagellar differences using ptx1 mutant that eliminates functional asymmetry between flagella. (Red) ptx1 mutant cells (black); wild type. Average length in ptx1 mutants is reduced compared with wild type, but uncorrelated variation is larger than in wild type (η2int = 0.013 [95% confidence interval 0.007–0.02] for ptx1 versus η2int = 0.007 [95% confidence interval 0.005–0.01] for wt), indicating the PTX1-dependent biochemical asymmetry in the two flagella is not a substantial source of uncorrelated variation. (C) Correlated variation has a dynamic component. Scatterplot shows fluctuations in the lengths of both flagella in a cell during a 10-min time-step. Each point represents data from one cell at one time interval. ΔL1 and ΔL2 indicate the change in length of the two flagella in a cell during a single 10-min time interval, plotted one against the other.
Figure 3
Figure 3
Contribution of cell body to length variation (A) Testing for cell-body-specific differences in flagellar length. Plot shows flagellar length before and after regeneration induced by pH shock on cells trapped in a microfluidic device. Each marker is one flagellum. Line indicates best fit to data. (B) Testing for cell-body retention of flagellar length differences. Plot shows the difference in length between the two flagella of a cell before and after regeneration induced by pH shock. (C) Contribution to correlated length variation from cell size variation measured by correlation between average length of the two flagella with the cell diameter in asynchronous cultures. (Green) Wild-type cells. (Pink) mat3 mutant cells having smaller average size than wild type (Umen and Goodenough, 2001). Correlation coefficients were 0.61 for wild-type cells alone and 0.70 for the combination of wild-type cells plus mat3 cells. Inset gives result of dominance analysis of flagellar length after regeneration (based on data in Figure S1E in terms of length prior to regeneration and different measures of cell size). Plot shows the incremental r2 contribution of each predictor in the model. (D) Flagellar length variation is reduced in cells arrested in the cell cycle by growth in the dark. (Red) Growth-arrested cells. (Gray) Vegetatively growing cells.
Figure 4
Figure 4
Identification of genes that affect flagellar length noise (A) Analysis of candidate genes for effect on noise. Points represent median calculated value of uncorrelated variation. Error bars are 95% confidence intervals for each strain. Dotted blue lines show the 95% confidence interval for uncorrelated variation in wild-type cells. Green and red data markers indicate lf1 and lf4 mutants. All measurements were made using 2D image data to allow a large number of different strains to be measured more rapidly. The uncorrelated variation plotted on the Y axis is a unit-less quantity. (B) Increased correlated and uncorrelated variation in long flagella mutants. (Green circles) lf1, (red squares) lf4, (gray diamonds) wild type. All data shown are from 3D measurements of flagellar length in cells from asynchronous cultures. (C) Autocovariance of lf1 (red) and wild type (blue) based on measurements of length fluctuations in living cells, showing higher mean-squared fluctuations (judged by the autocovariance at zero lag) and slower decay for lf mutants. Error bars signify standard error of the mean.
Figure 5
Figure 5
Model predictions for noise versus length (A) Schematic of balance-point mode for flagellar length control. Flagellar microtubules undergo constant disassembly (red arrow) at a length-independent rate D. This disassembly is balanced by assembly, which occurs at a rate limited by the rate of IFT (blue arrow). The rate of IFT entry is proportional to 1/L based on experimental measurements (Engel et al., 2009). Precursor protein from the cytoplasm binds with first-order binding. The available free precursor pool is the total pool P minus the quantity of precursor already incorporated into the two flagella. Hence the net assembly rate is given by A(P-2L)/L. (B) Steady-state length is determined by the balance point between length-independent disassembly (red line) and length-dependent assembly (blue line). Mutations can increase flagellar length either by increasing assembly (blue dotted line) or by decreasing disassembly (red dotted line). (C) Simulation results for the balance point model in which a Gaussian perturbation is added to the net rate of assembly (see methods). The resulting plot of mean-squared change in length versus time interval has a similar form to experimental observations. Inset shows a typical simulation trace of length versus time. (D) Results of applying fluctuations to the disassembly rate D. Graph shows three curves, each representing a parameter change that increases the average length. For each curve, one parameter (A, D, or P) was varied, the average length determined, and then the uncorrelated variation computed by stochastic simulations in which a Gaussian perturbation was applied to the assembly parameter D. The Y axis of the graph plots the uncorrelated length variation (here denoted η2) normalized by the uncorrelated variation denoted obtained in simulations using the wild-type values of the three parameters (denoted η02). This normalized noise is unitless. Parameter values for the wild-type case are those previously derived from experimental measurements (Marshall and Rosenbaum, 2001). (Blue circles—length increased by decreasing D; red squares—length increase by increasing A; green diamonds—length increase by increasing P). (E) Results of applying fluctuations to the assembly coefficient A. Again the three curves show the normalized uncorrelated variation as a function of flagellar length as each of the three parameters is changed so as to cause an increased length. (Blue—length increased by decreasing D; red—length increase by increasing A; green—length increase by increasing P). (F) Results of stochastic simulation of the balance point model in which the three parameters A, D, and P are held constant, but noise is applied to the net rate of assembly obtained from the balance point model at each time point. As with panels D and E, the three model parameters were changed to increase average length and the normalized uncorrelated variation plotted. (Blue—length increased by decreasing D; red—length increase by increasing A; green—length increase by increasing P). The black line included in this plot shows the analytical prediction of a small signal noise analysis assuming an intrinsic noise source acting within one flagellum, given in the text as Equation 5. (G) A length control model based on diffusive return of IFT kinesin (Hendel et al., 2018). (H) Stochastic simulation of the diffusion-based model showing that the diffusion model recapitulates a mean-squared change in length versus time lag curve that resembles a constrained random walk-like behavior. Inset shows sample traces of two flagella simulated in a cell. (I) Uncorrelated variation as a function of average length in the diffusion model. As with panels D–F, uncorrelated variation is normalized by the value seen with parameters giving wild-type length. (Blue) Variation of the build-size parameter reflecting the length increment per arrival of cargo. (Red) variation of the disassembly rate parameter reflecting the steady-state rate of tubulin removal from the tip.
Figure 6
Figure 6
Noise affects fitness as judged by flagella-driven motility (A) Contour plot of swimming speed (red fastest, blue slowest) versus the lengths of the two flagella. White dots signify lengths of flagella in wild-type cells superimposed on swimming speed distribution. Cells with the least uncorrelated variation (closest to diagonal) swim fastest in any given length range. (B) Contour plot of gliding speed (red fastest, blue slowest) versus the lengths of the two flagella. Cells with the most uncorrelated variation (farthest from diagonal) glide fastest in any given length range.

Similar articles

Cited by

References

    1. Adams G.M., Wright R.L., Jarvik J.W. Defective temporal and spatial control of flagellar assembly in a mutant of Chlamydomonas reinhardtii with variable flagellar number. J. Cell Biol. 1985;100:955–964. - PMC - PubMed
    1. Amir A., Balaban N. Learning from Noise: How Observing Stochasticity May Aid Microbiology. Trends Microbiol. 2018;26:376–385. - PubMed
    1. Amiri K.P., Kalish A., Mukherji S. Robust organelle size control via bursty growth. bioRxiv. 2020 doi: 10.1101/789453. - DOI
    1. Banerjee D.S., Banerjee S. Size regulation of multiple organelles competing for a shared subunit pool. bioRxiv. 2020 2020.01.11.902783. - PMC - PubMed
    1. Barsel S.E., Wexler D.E., Lefebvre P.A. Genetic analysis of long-flagella mutants of Chlamydomonas reinhardtii. Genetics. 1988;118:637–648. - PMC - PubMed