. 2021 Apr;2(4):444-456.
doi: 10.1038/s43018-021-00185-w. Epub 2021 Mar 22.

EZH2 inhibition activates a dsRNA-STING-interferon stress axis that potentiates response to PD-1 checkpoint blockade in prostate cancer

Affiliations

EZH2 inhibition activates a dsRNA-STING-interferon stress axis that potentiates response to PD-1 checkpoint blockade in prostate cancer

Katherine L Morel et al. Nat Cancer. 2021 Apr.

Abstract

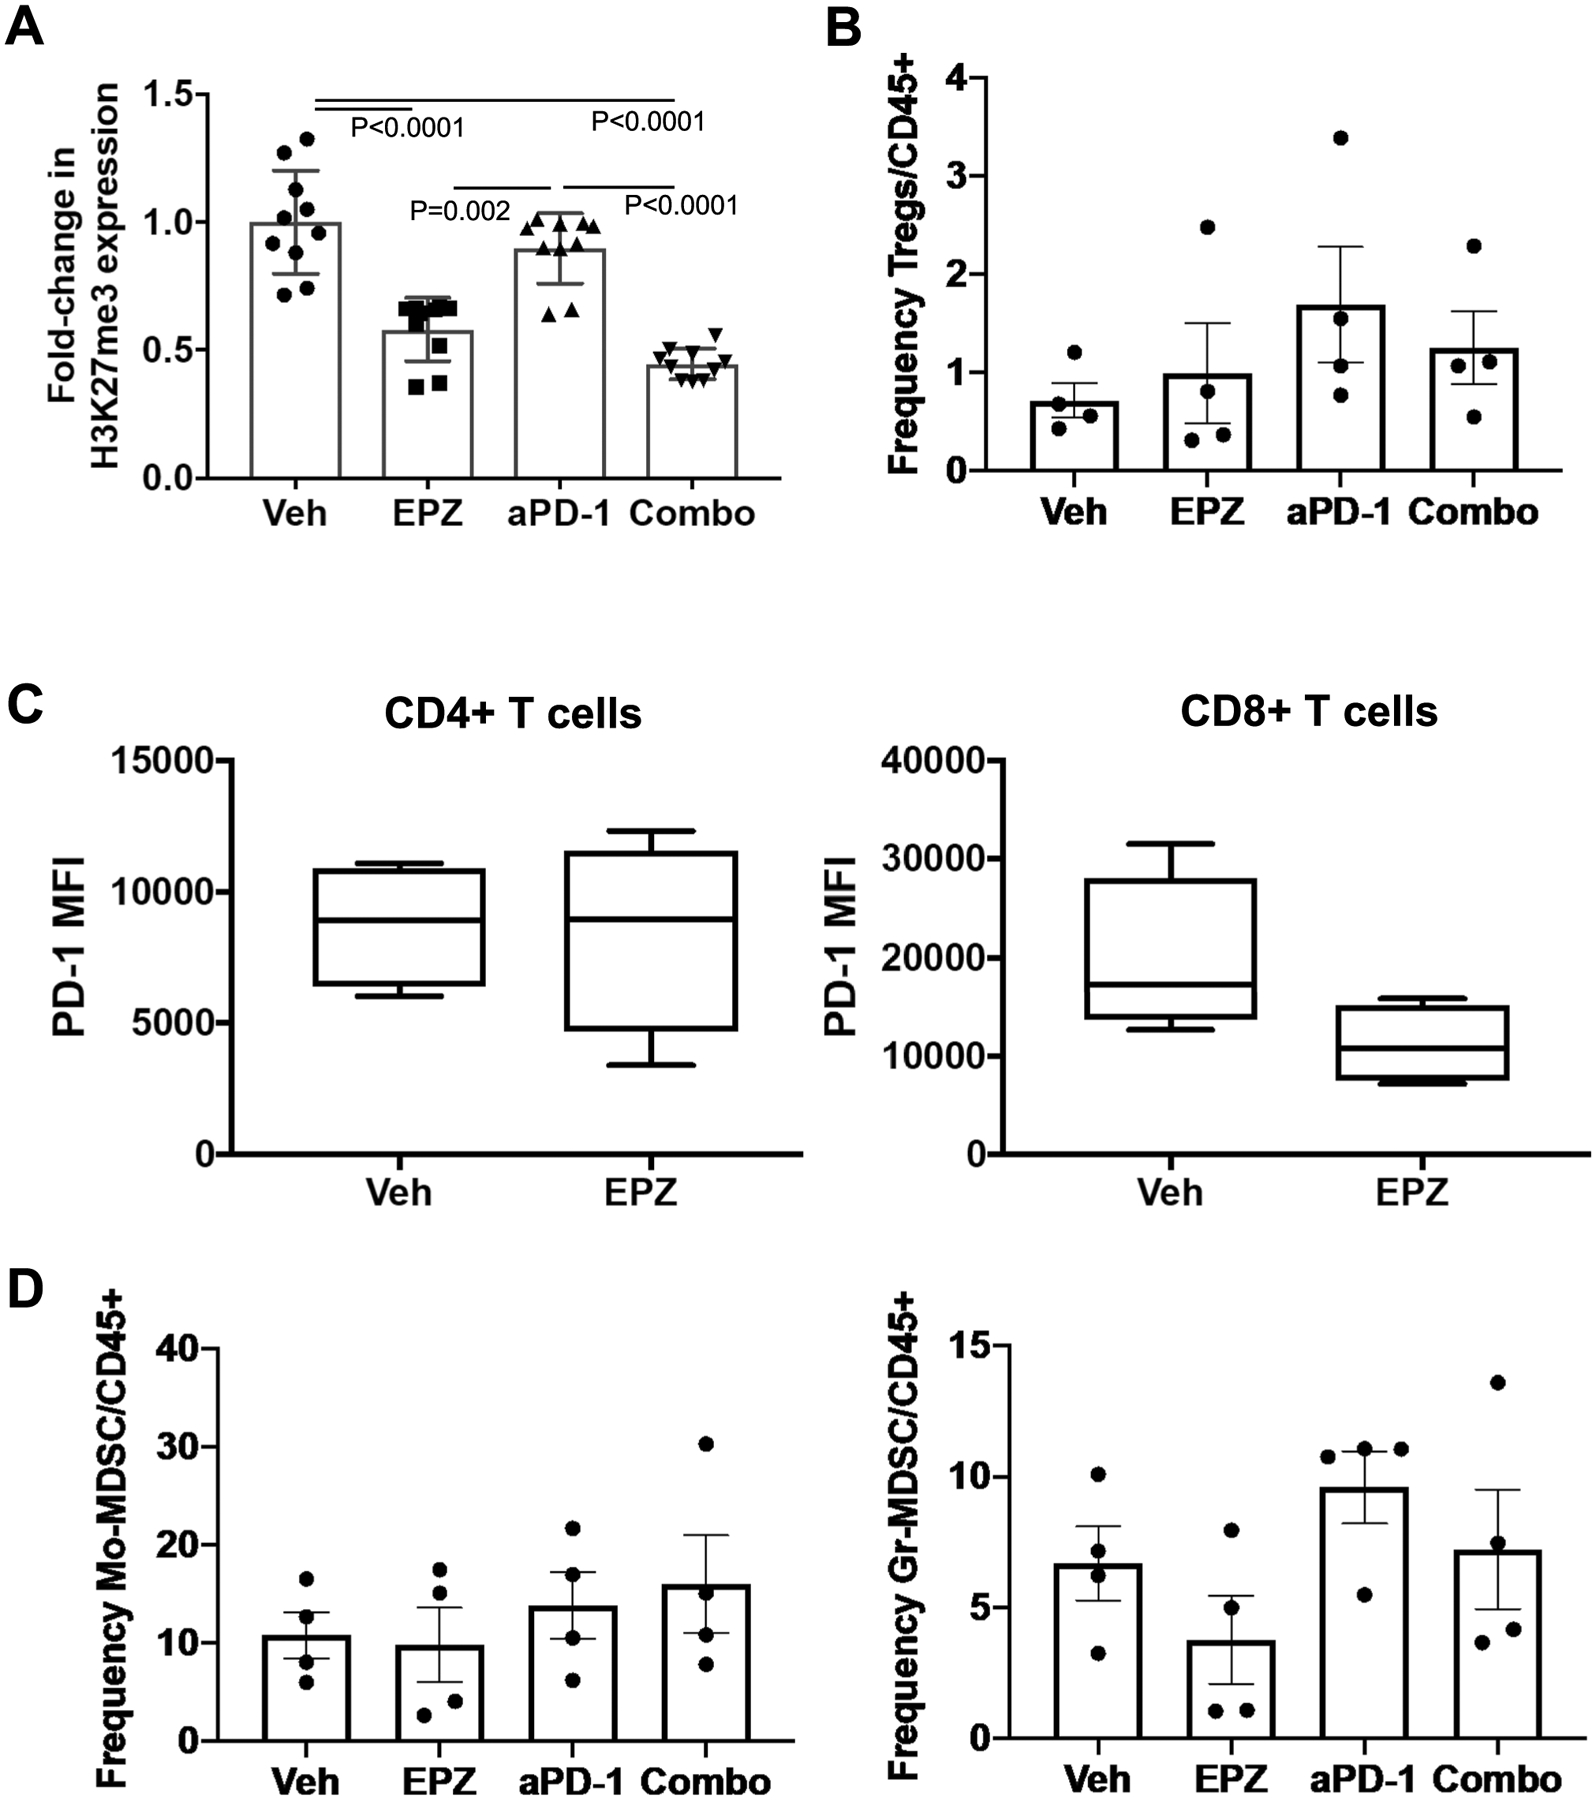
Prostate cancers are considered to be immunologically 'cold' tumors given the very few patients who respond to checkpoint inhibitor (CPI) therapy. Recently, enrichment of interferon-stimulated genes (ISGs) predicted a favorable response to CPI across various disease sites. The enhancer of zeste homolog-2 (EZH2) is overexpressed in prostate cancer and known to negatively regulate ISGs. In the present study, we demonstrate that EZH2 inhibition in prostate cancer models activates a double-stranded RNA-STING-ISG stress response upregulating genes involved in antigen presentation, Th1 chemokine signaling and interferon response, including programmed cell death protein 1 (PD-L1) that is dependent on STING activation. EZH2 inhibition substantially increased intratumoral trafficking of activated CD8+ T cells and increased M1 tumor-associated macrophages, overall reversing resistance to PD-1 CPI. Our study identifies EZH2 as a potent inhibitor of antitumor immunity and responsiveness to CPI. These data suggest EZH2 inhibition as a therapeutic direction to enhance prostate cancer response to PD-1 CPI.


Conflict of interest statement

Competing interests The authors declare no competing interests.

Figures

Extended Data Fig. 1 |
Extended Data Fig. 1 |. Generation of an EZH2 Activity Gene Signature.
(a) Three-dimensional PCa organoids generated from EM mice (without PSACreERT2) alleles. When treated with tamoxifen, no loss of H3K27me3 or EDU staining is indicated - demonstrating specificity of tamoxifen-PSACreERT2 mediated deletion of the Ezh2 set domain in Fig. 1. P-values were generated using a two-tailed unpaired T-test with Welch’s correction. Data was generated from three (n = 3) independent experiments and displayed as mean ±SEM (b) Principal component analysis (PCA) following chemical (n = 3 independent organoid cultures per treatment group) and genetic (n = 2 independent organoid cultures per treatment group) inhibition of Ezh2 catalytic function results in significant changes in gene expression. (c) A 29-gene signature derived from Fig. 1c (DZNep data) was used to generate signature scores for each patient within four independent human prostate cancer RNA-seq datasets. Patients were ranked highest score to lowest score and subject to quartile separation. First (blue) and fourth (red) quartiles were analyzed by supervised clustering to demonstrate expression differences within patients with lowest EZH2 activity and highest EZH2 activity. Sample numbers used for TCGA (n = 408 samples), SU2C (n = 118 samples), Beltran Adenocarcinomas (n = 33 samples), and NCI Primary Adeno (n = 41 samples). (d) Our 29-gene signature derived from demonstrates complete independence from a previously published polycomb repression signature. (e) Our 29 gene signature demonstrates significant correlation with a previously published polycomb repression signature in 2 independent human PCa gene expression datasets. (f) EZH2 activity is not determined by EZH2 mRNA expression. Pearson correlation coefficient analysis was utilized to generate data for E-F.
Extended Data Fig. 2 |
Extended Data Fig. 2 |. Low EZH2 Activity is Associated with Enrichment in IFN Signaling and dsRNA Sensory Machinery.
(a) Genes representing IFN signaling (STAT1, IRF9), Th1 chemokines (CXCL10, CXCL11), and MHC Class I molecules (B2M, HLA-A) were shown to be enriched in PCa patients with low EZH2 activity. (b) Genes representing intracellular sensors of dsRNA (TLR3, MAVs, RIG-I, MDA5) were shown to be enriched in PCa patients with low EZH2 activity. (c) Genes from Canadas et al. (2018) described as ‘SPARCs’ regulated by STAT1 and EZH2 that house endogenous retroviral sequences important for inducing an innate immune response, were shown to be enriched in PCa patients with low EZH2 activity. Sample numbers used for TCGA (n = 408 samples), SU2C (n = 118 samples), Beltran Adenocarcinomas (n = 33 samples), and NCI Primary Adeno (n = 41 samples). All data was generated by using Pearson correlation coefficient analysis.
Extended Data Fig. 3 |
Extended Data Fig. 3 |. EZH2 Inhibition Regulates Innate Immune Signaling in Prostate Cancer.
(a) Overlay of five independent differentially expressed IFNα and IFNɣ gene lists from mouse and human RNA-seq data provided a merged gene list of 97 ISGs. (b) String analysis of the generated 97 type I/II IFN gene list reveals significant enrichment of biological processes including innate immune response, defense response, and type I interferon signaling pathway. Moreover, molecular function terms including double-stranded RNA binding, peptide antigen binding were also significantly enriched. (c) Mouse RNA-seq data was queried to demonstrate that our 97 IFN gene signature is upregulated in response to loss of EZH2 catalytic activity. Data was generated by performing two (n = 2) independent (genetic inhibition) or three (n = 3) independent experiments and displayed as the mean or mean ±SEM respectively. Statistical data was generated by performing a two-tailed unpaired T-test with Welch’s correction. (d) LNCaP RNA-seq data was queried to demonstrate that upon EZH2 genetic (left) or chemical (right) inhibition results in enrichment of IFNα/γ gene sets. Data was generated from previously published RNA-seq data – GSE107780. Triplicate, n = 3/treatment group RNA-seq experiments where available for analysis. (e) Heatmaps of normalized ATAC signal intensities of 97 ISGs from were analyzed in 5 independent patient prostatectomy samples. Each patient sample was analyzed once.
Extended Data Fig. 4 |
Extended Data Fig. 4 |. Activation of interferon stimulated genes is STING dependent cont.
Full statistical comparisons for flow cytometry analysis of PD-L1, MHC-I and dsRNA expression in B6MYC-CaP and Pten−/− cells with and without STING inhibition (chemical by C-176 or genetic by sgSTING) and treated with DMSO, or EZH2 inhibitors DZNep or EPZ. These statistical data are partnered with Fig. 4c,d and was generated by performing a two-tailed unpaired T-test with Welch’s correction. Data was generated using flow cytometry analysis from three (n = 3) independent experiments and displayed as mean ±SEM. P-values can be seen in Extended Data Fig. 4 and were generated using a two-tailed unpaired T-test with Welch’s correction. Note: Data from Pten KO cells in Fig. 4c treated with C176 to inhibit STING was generated from two (n = 2) independent experiments and displayed as the mean value.
Extended Data Fig. 5 |
Extended Data Fig. 5 |. Low EZH2 activity is associated with increased immune gene expression related to positive response to check-point inhibition.
(a) Analysis of human RNA-seq datasets reveal immune signatures related to check-point blockade positive response are significantly enriched in PCa patients with low EZH2 activity. Sample numbers used for TCGA (n = 408 samples), SU2C (n = 118 samples), and Beltran Adenocarcinomas (n = 33 samples). (b) Normalized weights of mice (n = 10 mice/treatment group) indicate that no significant weight loss (ie: toxicity) was observed following therapy with indicated treatment cohorts. (c-d) Tumor measurements of individual tumors by waterfall or spider plots validate significant anti-tumor activity of EZH2 inhibition combined with PD-1 blockade. N = 10 mice/tumors per treatment group. (e) Mouse and human prostate cancer organoids (Pten−/− and human mCRPC organoids), and human LNCaP 2D cell lines treated with indicated EZH2 inhibitors for 96 hours demonstrate upregulation of PD-L1 mRNA. Data was generated for Pten−/− organoids with n = 5 independent experiments for parental and DMSO treatment groups and n = 3 independent experiments for DZ and EPZ treatment groups and displayed as the mean ±SEM. For LNCaP and human CRPC organoids, a n = 3 independent experiment was used to generate data and displayed as the mean ±SEM. Statistical data was generated by performing a two-tailed unpaired T-test with Welch’s correction of DMSO verse DZ or EPZ treatment groups. (f) Human PCa gene expression data was queried to demonstrate that increased PD-L1 gene up-regulation is significantly correlated with low EZH2 activity. Sample numbers used for TCGA (n = 408 samples), NCI (n = 41 samples), SU2C (n = 118 samples), and Beltran Adenocarcinomas (n = 33 samples).
Extended Data Fig. 6 |
Extended Data Fig. 6 |. Low EZH2 activity is associated with positive association of inflammatory immune genes.
(a) B6MYC-CaP and Pten−/− 2D cell lines that express Cas9 were stably infected with gRNA towards Pd-l1 (Cd274). Treatment with IFNɣ validates the inhibition of Pd-l1 expression in KO cell lines. Data was generated by n = 2 independent qRT-PCR experiments. (b) Murine Pten KO prostate cancer cells treated with EZH2 inhibitors increase expression of Th-1 cytokines. Data for A-B was generated by performing two (n = 2) independent experiments and displayed as the mean. (c) Human prostate cancer patient correlation analysis between EZH2 repression score (X-axis) and Th1, Th2, or Th17 gene expression profiles (Y-axis). Sample numbers used for TCGA (n = 408 samples), NCI (n = 41 samples), SU2C (n = 118 samples), and Beltran Adenocarcinomas (n = 33 samples).
Extended Data Fig. 7 |
Extended Data Fig. 7 |. Effects on the tumor microenvironment post EZH2 inhibition.
(a) Representative in vivo tumor analysis indicates that EZH2 inhibition and combination significantly reduce tumor H3K27me3 expression. (b) Frequency of Foxp3 + T-reg cells was determined by flow cytometry. No significant change was observed following treatment. (c) PD-1 protein expression on CD4 + and CD8 + T-cells was analyzed by flow cytometry. Only CD8 + T-cells were observed to express lower PD-1 protein following EZH2 inhibition. Box plots are displayed as min to max distribution. (d) Frequency of Mo-MDSC and Gr-MDSC cells was determined by flow cytometry. No significant change was observed following treatment. Data was generated by analysis of (A) ten (n = 10) independent mice or (B-D) four (n = 4) independent mice per treatment group. Statistical data was generated by performing a two-tailed unpaired T-test with Welch’s correction.
Fig. 1 |
Fig. 1 |. EZH2 negatively regulates type I/II ISGs in PCa.
a,b, EZH2 catalytic activity in EMC PCa mouse organoids inhibited by genetic or chemical inhibition of EZH2 catalytic activity. Chemical and genetic EZH2 inhibition decreases H3K27me3, DNA replication and gene expression. Gene expression differentials were generated by RNA-seq. H3K27me3 and EDU (2′deoxy-5-ethynyluridine) signal intensity were analyzed by ImageStream flow cytometry. P values were generated using a two-tailed, unpaired Student’s t-test with Welch’s correction. Data were generated from n = 3 independent experiments and displayed as mean ± s.e.m. c, GSEA revealing enrichment of type I/II IFN gene signatures in mouse PCa organoids after EZH2 inhibition. Ox phos, oxidative phosphorylation. d, Master regulation analysis of RNA-seq data from 1C (overlap of top 200 TFs ranked by NES) enriched for TFs that regulate type I/II IFN-response genes. e, GSEA reveals enrichment of type I/II IFN gene signatures in human PCa patients with the lowest EZH2 activity. Sample numbers used are for NCI-laser capture dissection prostatectomies (n = 21 samples), for the Cancer Genome Atlas (TCGA; n = 204 samples) and for Beltran mCRPC (n = 17 samples).
Fig. 2 |
Fig. 2 |. EZH2 inhibition derepresses endogenous dsRNA.
a,b, Inhibition of EZH2 induces expression of dsRNA in mouse and human PCa organoids (a) and PCa tissue in vivo (b). Data for a were generated from n = 3 (EMC mouse) or n = 2 (human) independent experiments and n = 10 independent mice for b. Scale bars, 25 μm. P values for a were generated using a one-way ANOVA, Tukey’s multiple-comparison test for a and a two-tailed, unpaired Student’s t-test with Welch’s correction for b, and displayed as mean ± s.e.m. c,d, Histopathology analysis of human prostatectomy samples indicating tumors with >5% PD-L1 tumor-positive staining (PD-L1 high, n = 10 patients) exhibits low H3K27me3 and high dsRNA staining. Tumors with <5% tumor-positive staining (PD-L1 low, n = 10 patients) exhibit high H3K27me3 and low dsRNA staining (c). d, Quantification of MFI for H3K27me3 and dsRNA staining performed in c. MFI, mean fluorescence intensity. Scale bars, 100 μm.
Fig. 3 |
Fig. 3 |. ISGs are poised for activation by EZH2 inhibition.
a, Heatmaps of normalized H3K27me3 and H3K27ac signaling intensities of 97 ISGs from 5 independent patient prostatectomy samples. Each patient sample was analyzed once for each histone mark. The blue line represents the intensity signal of the 97 ISGs described in Extended Data Fig. 3 and the green line represents the signal intensity of randomly selected genes. b, LNCaP cell lines treated with nonspecific or EZH2-targeted short hairpins indicating, on EZH2 knockdown ISG display, no direct association with H3K27me3, but accumulation of increased H3K27ac. c,d, Venn analysis of LNCaP cell lines indicating a total of 302 genes that concurrently lose H3K27me3 and gain H3K27ac that also contain ERV sequences within their 3′-UTR that are upregulated after EZH2 knockdown. d, Average H3K27me3 and H3K27ac peak intensity associated with the the promoter regions of the 302 genes identified in c. Data for bd were generated from previously published ChIP–seq data (accession no. GSE107780). There was a single replicate for each histone ChIP and the treatment condition was provided and used to generate data.
Fig. 4 |
Fig. 4 |. Activation of ISGs is STING dependent.
a, Human PCa gene expression data demonstrating increased expression of the dsRNA sensor STING significantly correlated with low EZH2 catalytic activity. Sample numbers used are n = 118 samples for SU2C, n = 408 samples for TCGA and n = 33 samples for Beltran adenocarcinomas. b, Cropped western blots showing validation of STING KO in Pten−/− and B6-HiMYC–CaP mouse PCa cell lines. Western blot analysis was performed once (n = 1 genotype/treatment condition). c,d, Chemical (c) or genetic (d) inhibition of STING demonstrating that EZH2 inhibitor activation of IFN-stimulated molecules, PD-L1 and MHC-I proteins, are dependent on STING activity. Data were generated using flow cytometry analysis from n = 3 independent experiments and displayed as mean ± s.e.m. P values can be seen in Extended Data Fig. 4 and were generated using a two-tailed, unpaired Student’s t-test with Welch’s correction. MFI, mean fluorescence intensity. Note that data from Pten KO cells in c, treated with C176 to inhibit STING, were generated from n = 2 independent experiments and displayed as the mean value. All values are presented as fold-change normalized to control conditions (DMSO + DMSO or sgScramble + DMSO). The red line indicates the normalized value of the control.
Fig. 5 |
Fig. 5 |. EZH2 inhibition sensitizes murine prostate tumors to PD-1 CPI and is dependent on tumor PD-L1 activation.
a, EZH2 inhibition combines with PD-1 blockade to significantly inhibit prostate tumor progression in vivo. Each group consists of n = 10 mice. The P values were generated using a multiple Student’s t-test. Asterisks represent: day 12, P = 0.043; day 14, P = 0.017; day 18, P = 0.011. b, EZH2 inhibition increases PD-L1 tumor expression (n = 10 mice/tumors per treatment group). The P values were generated using a two-tailed, unpaired Student’s t-test with Welch’s correction and displayed as mean ± s.e.m. Ctl, control. c, Mouse and human PCa organoids treated for 96 h with EZH2 inhibitors notably upregulating PD-L1 gene and protein expression. Data were generated from n = 3 (EMC mouse, left) or n = 2 (human, right) independent experiments and displayed as mean or mean ± s.e.m. The P values were generated using a one-way ANOVA, Tukey’s multiple-comparison test and represent DMSO versus treatment. d, Upregulation of tumor PD-L1 expression functionally assessed using an in vitro cytotoxicity assay. Inhibition of immune cell cytotoxicity after EZH2 inhibition was rescued by PD-1 blockade. This rescue is dependent on tumor PD-L1 upregulation. Data were generated from n = 6 independent experiments and displayed as mean ± s.e.m. The P values were generated using a two-tailed, unpaired Student’s t-test with Welch’s correction. B6MYC-CaP and Pten−/− denote the murine 2D cell lines generated from the genetically engineered mouse models of PCa.
Fig. 6 |
Fig. 6 |. EZH2 inhibition increases T-cell infiltration and induces PCa cell Th1 chemokine expression.
a, EZH2 inhibition alone or in combination (Combo) with PD-1 blockade significantly increasing CD3+, CD4+, CD8+ tumor T-cell trafficking. Scale bar, 100 μm. Each group analyzed consisted of n = 10 mice. Data were generated by quantification of fluorescently positive cells using an EVOS FL Auto 2 Cell Imaging System. Immunofluorescent images represent scanned tumor samples. Veh, vehicle. b, PD-1 blockade alone or in combination significantly increased activated CD8+ T cells but not CD4+ T cells. Each group analyzed consisted of n = 4 mice. Box plots are displayed as minimum to maximum distribution. All P values for a and b were generated using a two-tailed, unpaired Student’s t-test with Welch’s correction. c, Murine B6-MycCaP PCa cells treated with EZH2 inhibitors increasing expression of Th1 chemokines. Data were generated by use of a cytokine western blot array and are displayed as the mean from n = 2 independent experiments.
Fig. 7 |
Fig. 7 |. EZH2 inhibitor combination with PD-1 CPI alters the immunosuppressive tumor microenvironment.
a,b, Example micrographs indicating alterations of M1 TAMs (a) and M2 TAMs (b) within the tumor microenvironment after treatment. Scale bar, 100 μm. c, Quantification indicating that combination therapy (Combo) provides the most significant overall changes to the tumor microenvironment M1:M2 TAM ratio. The P values were generated using a two-tailed, unpaired Student’s t-test with Welch’s correction. Each group analyzed consisted of n = 10 mice. Data were generated by quantification of fluorescent or 3,3′-diaminobenzidine-positive cells using an EVOS FL Auto 2 Cell Imaging System. Images represent scanned tumor samples.

References

    1. Siegel RL, Miller KD & Jemal A Cancer statistics, 2019. CA Cancer J. Clin 69, 7–34 (2019). - PubMed
    1. Gan L et al. Epigenetic regulation of cancer progression by EZH2: from biological insights to therapeutic potential. Biomark Res. 6, 10 (2018). - PMC - PubMed
    1. Varambally S et al. The polycomb group protein EZH2 is involved in progression of prostate cancer. Nature 419, 624–629 (2002). - PubMed
    1. Koh CM et al. Myc enforces overexpression of EZH2 in early prostatic neoplasia via transcriptional and post-transcriptional mechanisms. Oncotarget 2, 669–683 (2011). - PMC - PubMed
    1. Peng D et al. Epigenetic silencing of TH1-type chemokines shapes tumour immunity and immunotherapy. Nature 527, 249–253 (2015). - PMC - PubMed

Publication types