. 2021:2:29.
doi: 10.1038/s43247-021-00097-8. Epub 2021 Feb 9.

Country-based rate of emissions reductions should increase by 80% beyond nationally determined contributions to meet the 2 °C target

Affiliations

Country-based rate of emissions reductions should increase by 80% beyond nationally determined contributions to meet the 2 °C target

Peiran R Liu et al. Commun Earth Environ. 2021.

Abstract

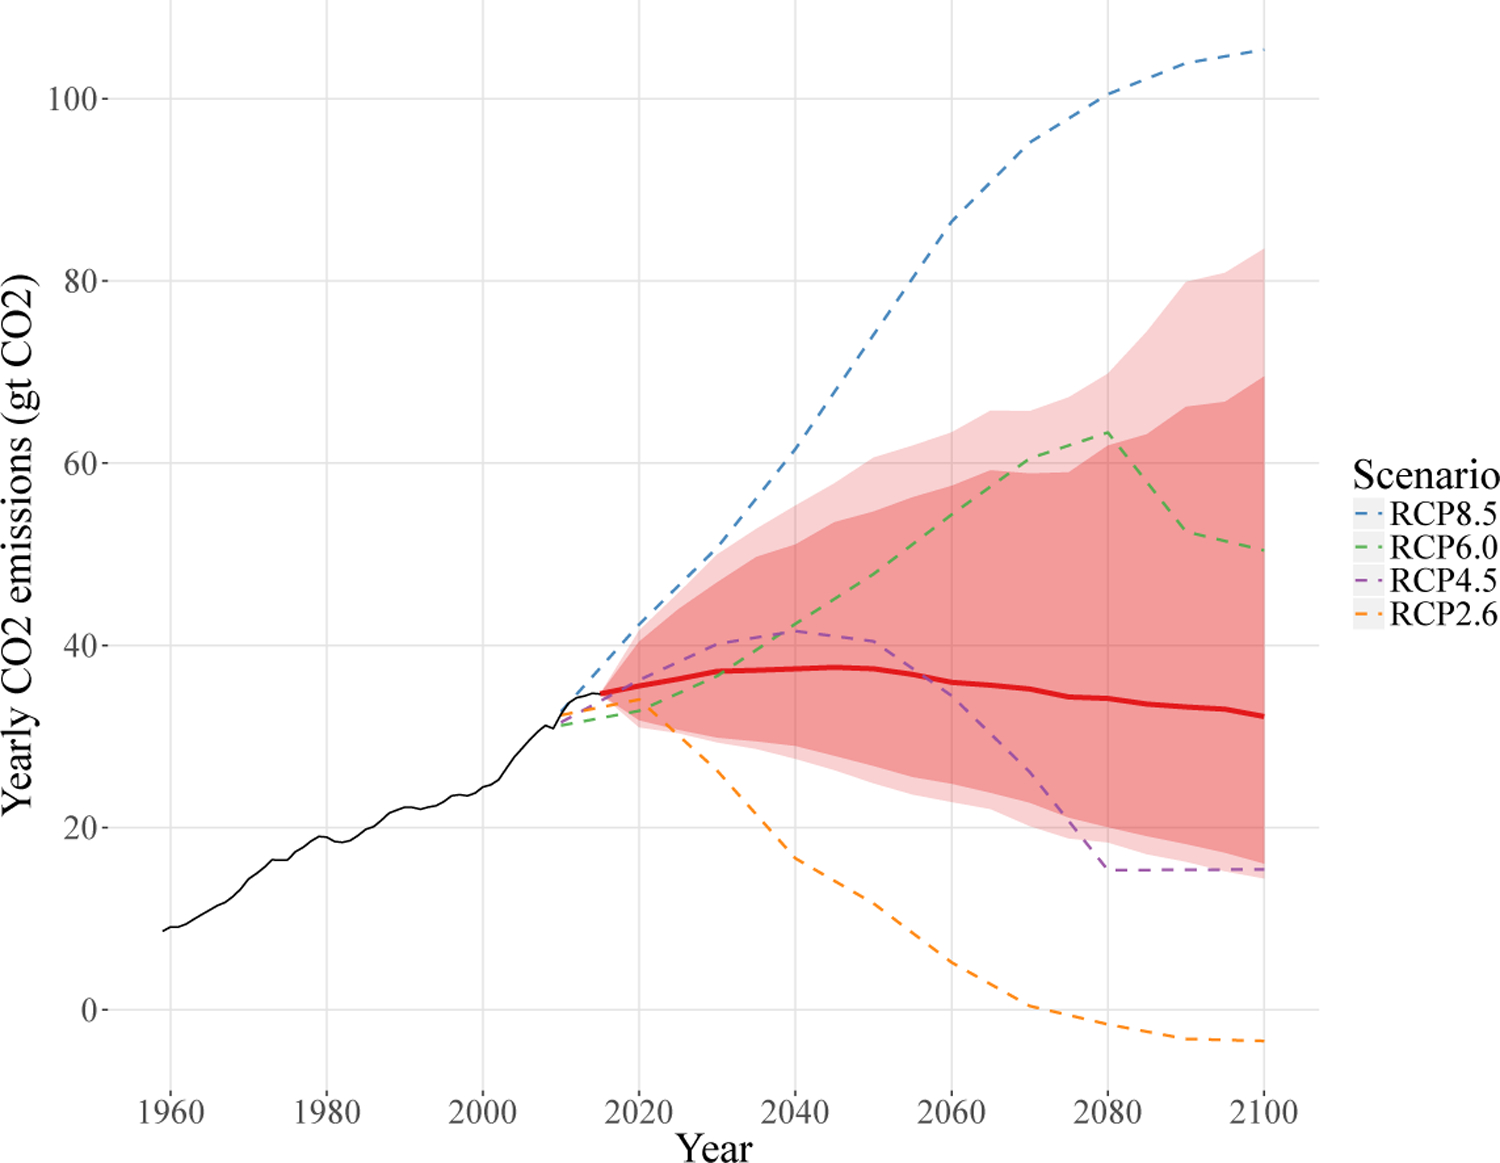
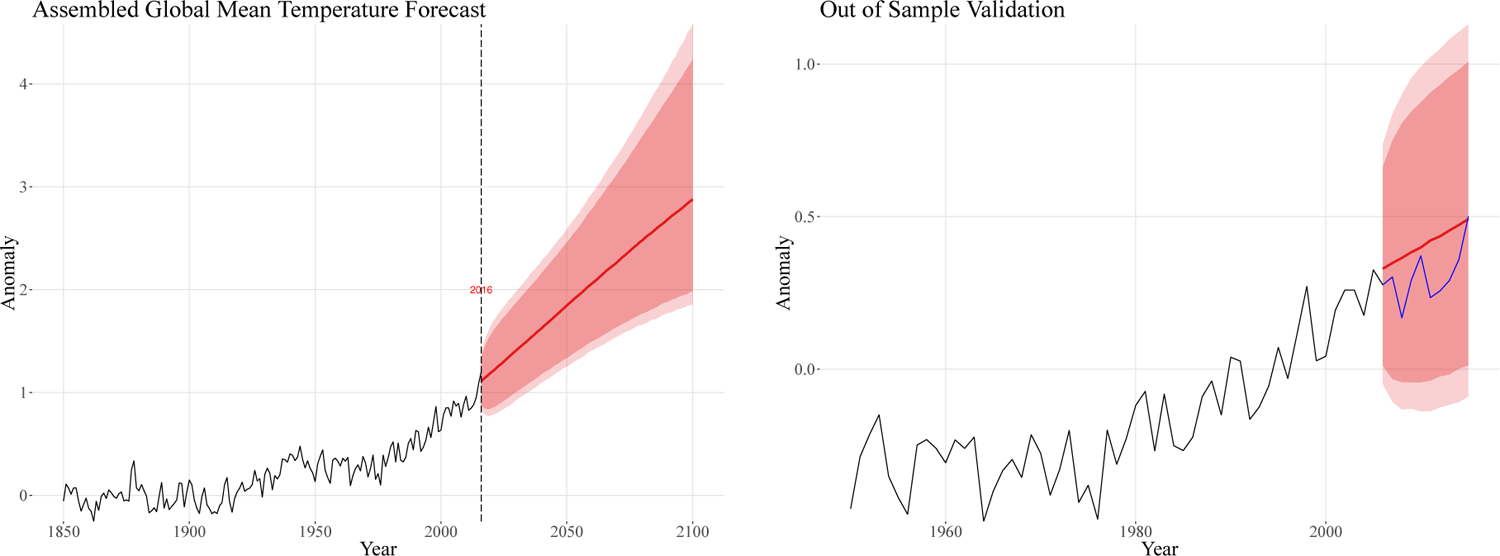
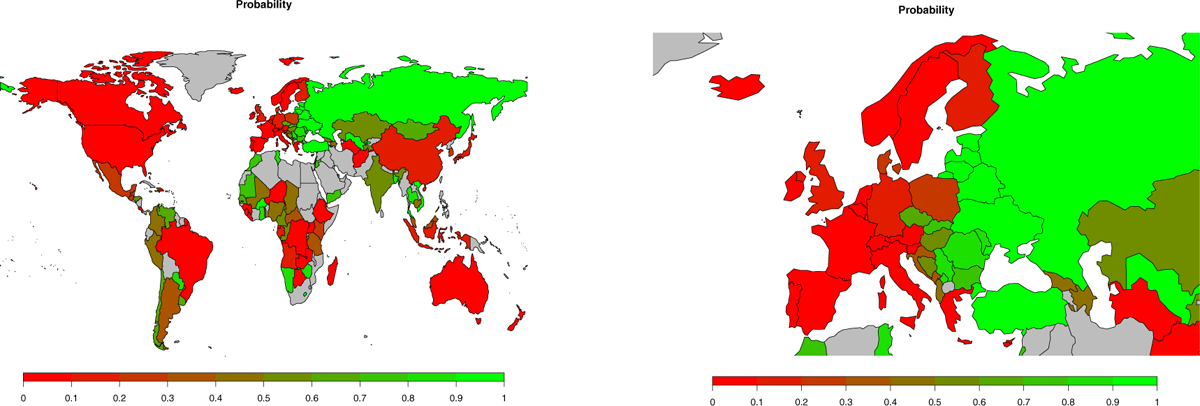
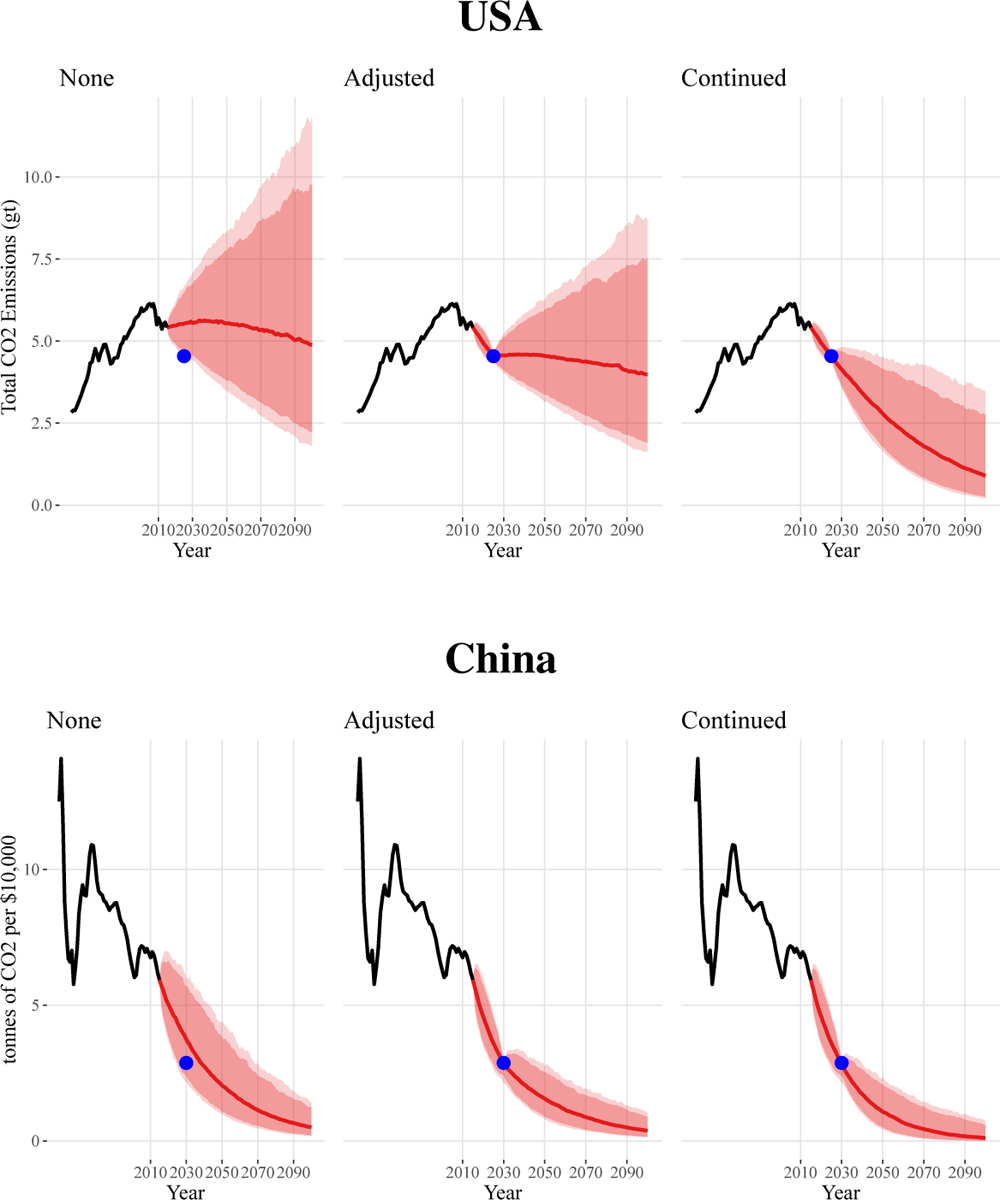
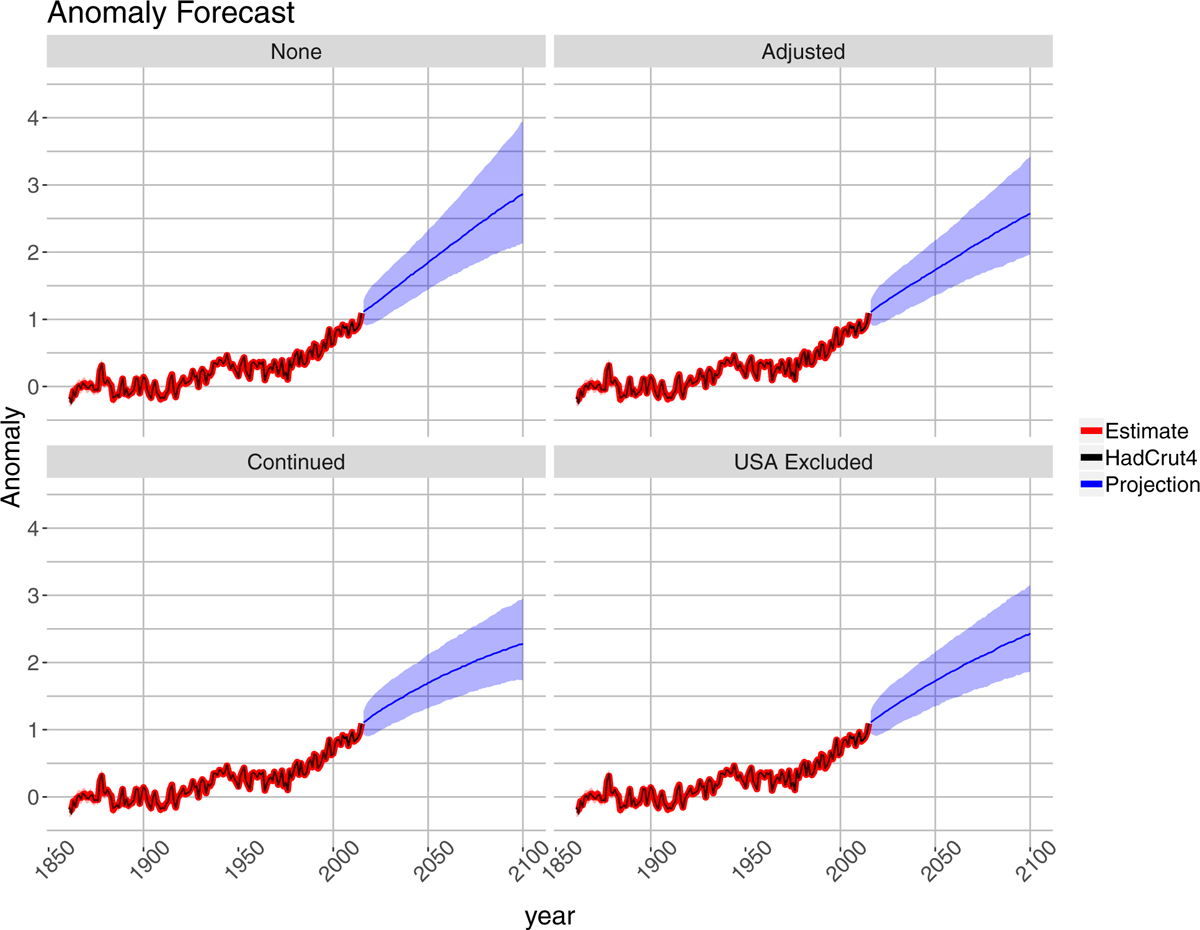
The 2015 Paris Agreement aims to keep global warming by 2100 to below 2°C, with 1.5°C as a target. To that end, countries agreed to reduce their emissions by nationally determined contributions (NDCs). Using a fully statistically based probabilistic framework, we find that the probabilities of meeting their nationally determined contributions for the largest emitters are low, e.g. 2% for the USA and 16% for China. On current trends, the probability of staying below 2°C of warming is only 5%, but if all countries meet their nationally determined contributions and continue to reduce emissions at the same rate after 2030, it rises to 26%. If the USA alone does not meet its nationally determined contribution, it declines to 18%. To have an even chance of staying below 2°C, the average rate of decline in emissions would need to increase from the 1% per year needed to meet the nationally determined contributions, to 1.8% per year.


Conflict of interest statement

Competing Interests The authors declare no competing interests.

Figures

Figure 1:
Figure 1:
Updated probabilistic forecast of CO2 Emissions, based on data to 2015 and the method of Raftery et al (2017). The forecast median of yearly global emissions in 2100 is now 34 Giga tons.
Figure 2:
Figure 2:. Probabilistic global temperature forecast and validation.
a. Probabilistic forecast of the global temperature anomaly to 2100. The black line represents the historical HadCRUT4 observations, while the red lines and the shaded area represents the forecast median, 90% and 95% prediction interval. Here anomaly stands for the relative difference of global mean temperature to the pre-industrial level, which is taken as the average global mean temperature between 1860–1880. b. Out of sample validation. The black line is the historical anomaly observed from the HadCRUT4 data base for 1960–2005. The red line is the forecasted median, and the dark and light shaded area represent the 50% and 90% predictive intervals for 2006–2015. The blue curve is the observed anomaly in 2006 to 2015. The observations fall well within the predictive distribution.
Figure 3:
Figure 3:. Probability that countries achieve their Paris Agreement Goals according to their nationally determined contributions (NDCs).
a. All countries. b. European countries. The probabilities vary widely between countries, from values near 0 to values near 1. However, the probabilities are low for most major emitters (USA, China, European Union, Japan).
Figure 4:
Figure 4:
Emissions forecasts for the two largest emitters, under three scenarios: “None” (left), which is the continuation of current trends, “Adjusted” (middle), which assumes that countries will meet their Paris Agreement NDCs, but that these policies will not be continued thereafter, and “Continued” (right), meaning that the policies will continue past the NDC target data (2025 for the USA, 2030 for China). Top: USA. The NDC for the USA is in terms of total emissions, and so the forecast is shown in terms of total emissions. The blue dots represent the NDC target, which is 26% less than yearly emissions in 2005. Bottom: China. The NDC for China is in terms of carbon intensity, and so the forecast of carbon intensity is shown. The blue dots represent the NDC target, which is 60% less than the intensity in 2005. In all the plots, the solid red line is the median forecast, the solid pink shaded area is the likely range, or 90% prediction interval, and the light pink shaded area is the 95% prediction interval.
Figure 5:
Figure 5:
Global Mean Temperature Forecast under different scenarios. The “None”, “Adjusted” and “Continued” scenarios are defined as in Figure 4. The “USA Excluded” scenarios assumes that all countries except the USA meet their NDCs and continue to reduce carbon emissions at the same rate thereafter, while the USA makes no additional effort and emissions follow their current trend. The purple line is the median forecast, while the shaded area is the likely range (90% prediction interval).
Figure 6:
Figure 6:
CMIP 5 models. Both model simulations and the observed data are adjusted such that the mean anomaly between 1861–1880 for each model and the observed data is 0. The black line represents the observed data, while the colored lines are for the CMIP 5 model simulations. In total there are 39 CMIP 5 models, but we include only 10 models in this plot for visual clarity.
Figure 7:
Figure 7:
Estimation of historical anomalies. The black line represents the HadCrut4 observations, while the red line and the shaded areas represents the estimated median and the 90% and 95% estimation intervals.

References

    1. Raftery AE, Zimmer A, Frierson DMW, Startz R & Liu P Less than 2°C warming by 2100 unlikely. Nature Climate Change 7, 637 (2017). - PMC - PubMed
    1. United Nations. World Population Prospects: The 2015 Revision (United Nations, New York, New York, USA, 2015).
    1. Intergovernmental Panel on Climate Change. Climate Change 2013: The Physical Science Basis. Working Group I Contribution to the Fifth Assessment Report of the Intergovernmental Panel on Climate Change (WMO/UNEP, 2014).
    1. UNFCCC. Adoption of the Paris Agreement. http://unfccc.int/resource/docs/2015/cop21/eng/l09r01.pdf (2015). URL http://unfccc.int/resource/docs/2015/cop21/eng/l09r01.pdf.
    1. United Nations Climate Change. National Determined Contributions. https://www4.unfccc.int/sites/NDCStaging/Pages/Home.aspx (2018). [Online; accessed 19-Sept-2019].

LinkOut - more resources