. 2021 May 18;2(5):100275.
doi: 10.1016/j.xcrm.2021.100275. Epub 2021 Apr 20.

Asymptomatic and symptomatic SARS-CoV-2 infections elicit polyfunctional antibodies

Affiliations

Asymptomatic and symptomatic SARS-CoV-2 infections elicit polyfunctional antibodies

Jérémy Dufloo et al. Cell Rep Med. .

Abstract

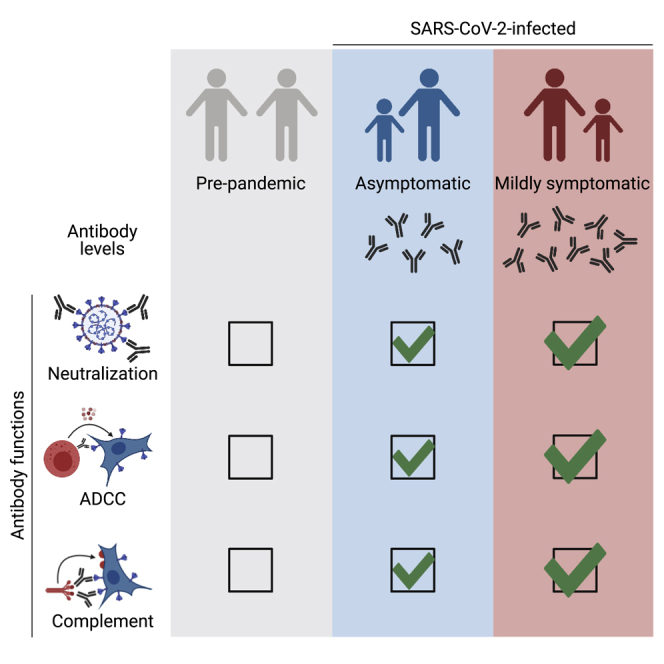
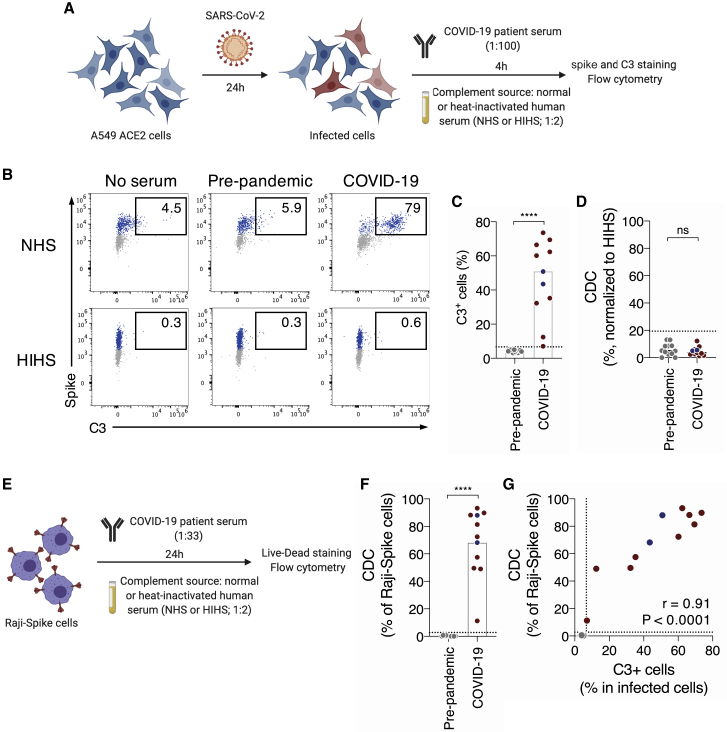
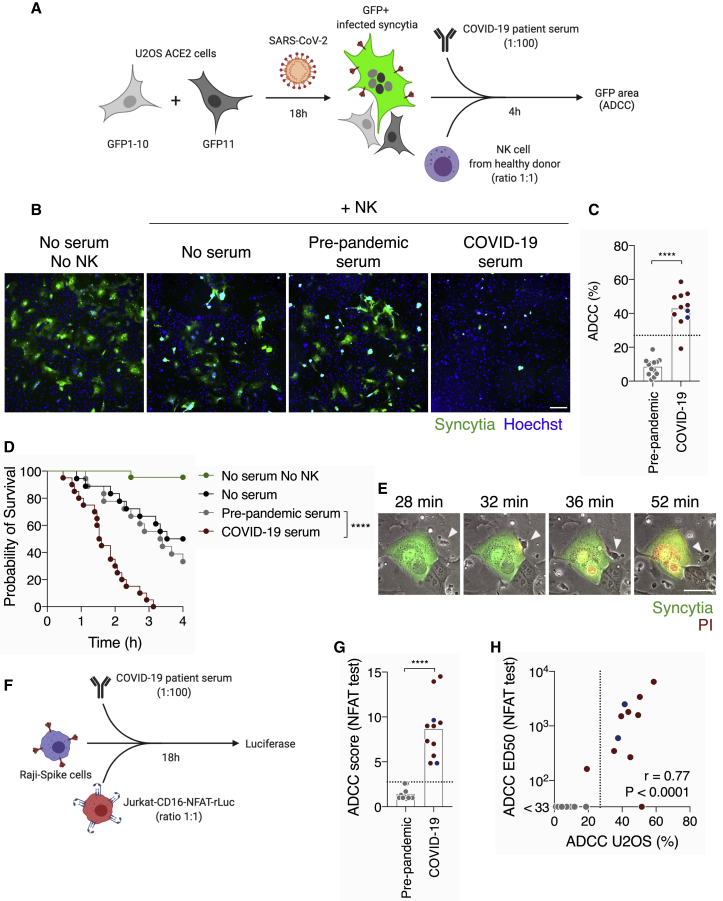
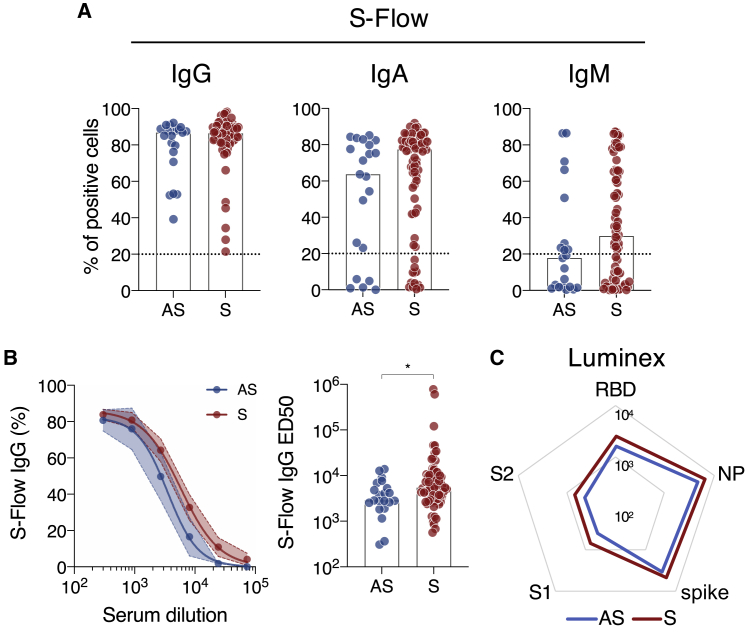
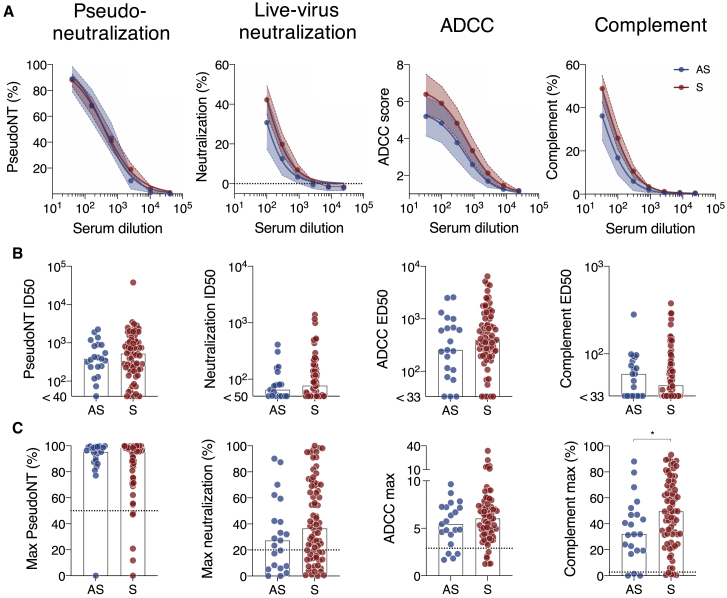
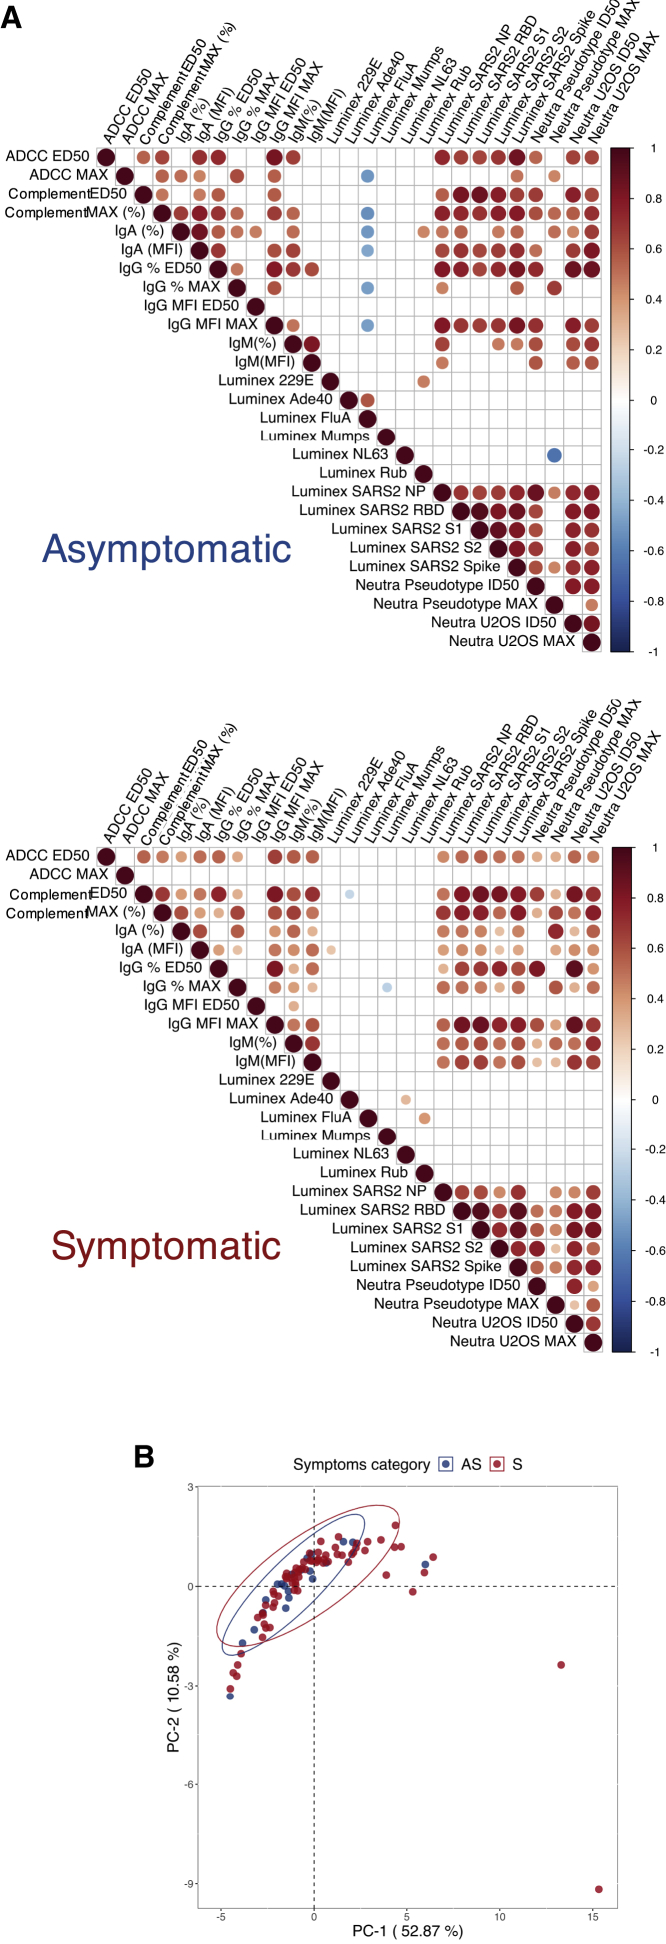
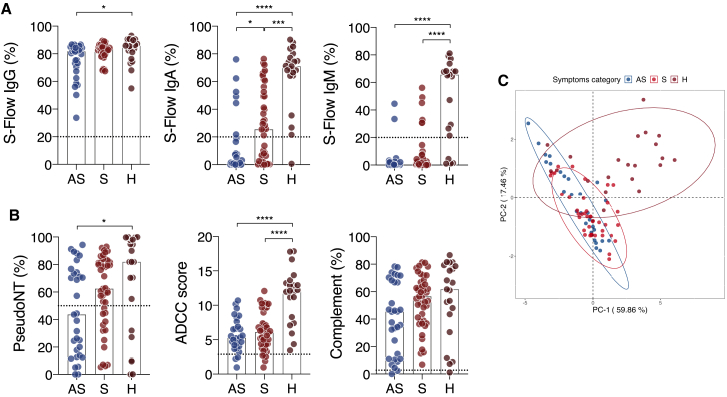
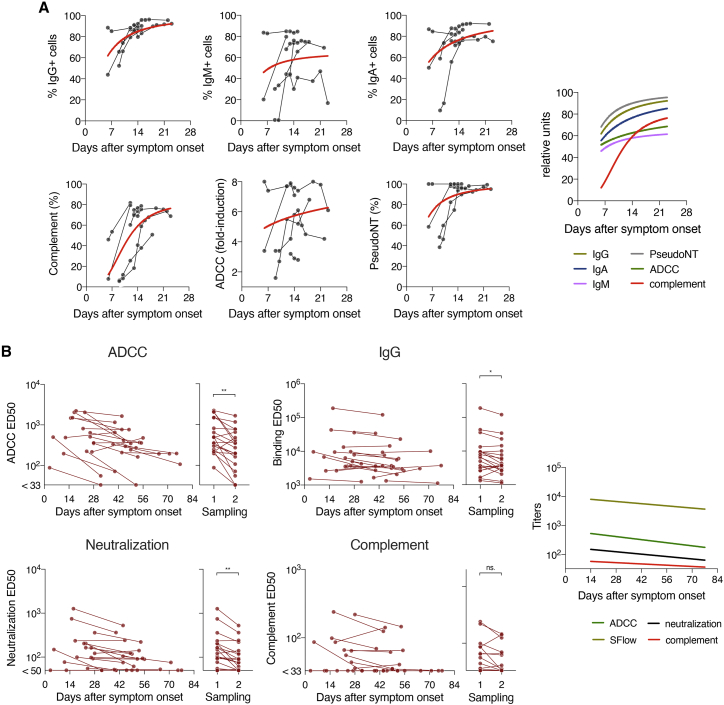
Many SARS-CoV-2-infected individuals remain asymptomatic. Little is known about the extent and quality of their antiviral humoral response. Here, we analyze antibody functions in 52 asymptomatic infected individuals, 119 mildly symptomatic, and 21 hospitalized patients with COVID-19. We measure anti-spike immunoglobulin G (IgG), IgA, and IgM levels with the S-Flow assay and map IgG-targeted epitopes with a Luminex assay. We also evaluate neutralization, complement deposition, and antibody-dependent cellular cytotoxicity (ADCC) using replication-competent SARS-CoV-2 or reporter cell systems. We show that COVID-19 sera mediate complement deposition and kill infected cells by ADCC. Sera from asymptomatic individuals neutralize the virus, activate ADCC, and trigger complement deposition. Antibody levels and functions are lower in asymptomatic individuals than they are in symptomatic cases. Antibody functions are correlated, regardless of disease severity. Longitudinal samplings show that antibody functions follow similar kinetics of induction and contraction. Overall, asymptomatic SARS-CoV-2 infection elicits polyfunctional antibodies neutralizing the virus and targeting infected cells.

Keywords: ADCC; SARS-CoV-2; antibody; asymptomatic; complement.


Conflict of interest statement

P.C. is the founder and chief scientific officer of TheraVectys. L.G., I.S., T.B., R.R., J.B., and O.S. are coinventors on provisional patent no. US 63/020,063 entitled “S-Flow: a FACS-based assay for serological analysis of SARS-CoV2 infection” submitted by Institut Pasteur.

Figures

None
Graphical abstract
Figure 1
Figure 1
COVID-19 sera activate the complement (A) Schematic of the complement activation test on infected cells. (B) Complement deposition on infected cells was measured after culture with or without a control or a COVID-19 serum in presence of normal (NHS) or heat-inactivated (HIHS) human serum. One representative experiment is shown. Percentages indicate the proportion of C3+ cells among infected (spike+) cells. (C) Complement deposition with pre-pandemic (n = 12) and COVID-19 patients’ (n = 11) sera. The percentage of C3+ cells among infected cells is represented. Each dot represents the mean of three independent experiments for one serum donor. (D) Complement-dependent cytotoxicity (CDC) of infected cells was calculated as the relative disappearance of spike+ cells in the NHS compared with HIHS condition, with pre-pandemic (n = 12) and COVID-19 patients’ (n = 11) sera. Each dot represents the mean of three independent experiments. (E) Schematic of the complement activation test on Raji-spike cells. (F) Raji-spike cells were cultured with sera from pre-pandemic individuals (n = 12) or COVID-19 patients (n = 11) and serum from a healthy individual as a source of complement. Each dot represents a different serum. (G) Correlation of the C3 deposition on A549-ACE2-infected cells and CDC of Raji-spike cells induced by sera from pre-pandemic individuals (gray, n = 12) and COVID-19 patients (blue or red, n = 11). Correlation r and p values were calculated using a Spearman correlation test. The dotted line indicates the threshold calculated with pre-pandemic sera. Blue: asymptomatic individuals; red: symptomatic patients. In (C), (D), and (F), the bar indicates the mean and a Mann-Whitney test was performed ns, not significant; ∗∗∗∗p < 0.0001. See also Figure S1 and Tables S1 and S2.
Figure 2
Figure 2
COVID-19 sera trigger antibody-dependent cellular cytotoxicity by NK cells (A) Schematic of the ADCC test on infected cells. (B) Representative images of the ADCC assay. Infected cells created GFP+ syncytia (green). Nuclei were stained with Hoechst (blue). Scale bar: 400 μm. (C) Quantification of the ADCC triggered by pre-pandemic (n = 13) or COVID-19 (n = 11) sera. Each dot represents the mean of six donors of NK cells for one serum donor. (D) The survival of infected cells was followed by live imaging without NK cells (green, n = 22) or with NK cells and no serum (black, n = 18), a pre-pandemic serum (gray, n = 18) or a COVID-19 serum (red, n = 20). Results from two independent experiments are represented. Log-rank (Mantel-Cox) test; ∗∗∗∗p < 0.0001. (E) Time-lapse of the ADCC of an infected cell by a NK cell in the presence of a COVID-19 serum. GFP indicates infected cells. PI was added to monitor cell death in red. The NK cell that contacts the infected cell is indicated with the arrowhead. Scale bar: 30 μm. (F) Schematic of the CD16 activation test. (G) Raji-spike cells were co-cultured with Jurkat-CD16-NFAT-rLuc in presence of pre-pandemic (n = 13) or COVID-19 (n = 11) sera for 18 h. The ADCC score was measured as the fold increase of luciferase expression over the “no serum” condition. (H) Correlation of the ADCC and the NFAT test score ED50 with sera from pre-pandemic individuals (gray, n = 13) and COVID-19 patients (blue or red, n = 11). Correlation r and p values were calculated using a Spearman correlation test. Blue: asymptomatic individuals; red: symptomatic patients. Dotted line: positivity threshold calculated with pre-pandemic sera. In (C) and (G), the bar indicates the mean, and a Mann-Whitney test was performed. ∗∗∗∗p < 0.0001. See also Figure S2 and Tables S1 and S2.
Figure 3
Figure 3
Antibody response to SARS-CoV-2 in sera of asymptomatic and mildly symptomatic COVID-19 individuals (A) IgG (left), IgA (middle), and IgM (right) levels were quantified in asymptomatic (AS; blue; n = 21) and mildly symptomatic (S; red; n = 76) individuals using the flow-cytometry-based S-Flow assay. The percentage of positive cells is represented. Dotted line: positivity threshold measured with pre-pandemic sera. (B) Dose-response analysis of anti-spike IgG response in AS (blue; n = 21) and S (red; n = 76) patients measured with the S-Flow assay. Left panel: the mean binding percentage at each serum dilution is represented with the 95% confidence interval. Right panel: the antibody titers (half-maximal effective dose [ED50]) of each individual are represented. (C) Luminex analysis of the antibody response against receptor binding domain (RBD), S1 and S2 subdomains of the spike, the full spike, and nucleoprotein (NP) for AS (blue line; n = 21) and S (red line; n = 76) sera. The median of MFI for AS and S sera are represented. In (A) and (B), a Mann-Whitney test was performed (∗p < 0.05), and the bar indicates the median. See also Figure S3 and Table S2.
Figure 4
Figure 4
Functional characterization of the sera from COVID-19 individuals (A) AS (blue; n = 21) and S (red; n = 76) sera were tested with serial dilutions for their ability to neutralize Spike pseudoparticles, neutralize SARS-CoV-2, trigger ADCC in the Jurkat-CD16-NFAT-rLuc/Raji-spike system, or induce CDC of Raji-spike cells. The mean activity at each serum dilution and the 95% confidence interval are depicted. (B) The half-maximal inhibitory dilution (ID50) of pseudoneutralization and neutralization, and the ED50 of ADCC and CDC induction are depicted. AS (blue; n = 21) and S (red; n = 76) groups are compared. (C) The maximum activity of each assay is compared for AS (blue; n = 21) and S (red; n = 76) individuals. ∗p < 0.05 (Mann-Whitney test). Dotted lines: positivity threshold measured with pre-pandemic sera. Bars indicate median. See also Table S2.
Figure 5
Figure 5
Similarity of antibody response in asymptomatic and symptomatic individuals (A) Pearson correlation matrix of features assessed in asymptomatic (top) and symptomatic (bottom) individuals. Only statistically significant correlations (p < 0.05) are depicted. Antibody features are alphabetically clustered. The size and color of the dots correspond to the Pearson correlation r values. (B) Principal component analysis of asymptomatic (blue; n = 21) and symptomatic (red; n = 70) patients. Each point represents a single patient. The ellipses indicate the Student’s t-distribution with 95% probability. See also Figure S4 and Table S2.
Figure 6
Figure 6
Similarity of antibody response in other groups of asymptomatic, symptomatic, and hospitalized individuals (A) IgG (left), IgA (middle), and IgM (right) levels were quantified in ASs (n = 31), Ss (n = 43), and Hs (n = 21) using the S-Flow assay. The percentage of positive cells is represented. (B) AS (n = 31), S (n = 43), and H (n = 21) sera were tested for their ability to neutralize spike pseudoparticles (left), trigger ADCC in the Jurkat-CD16-NFAT-rLuc/Raji-spike system (middle), or trigger CDC of Raji-spike cells (right). (C) Principal component analysis of asymptomatic (blue; n = 31), symptomatic (red; n = 43), and hospitalized (brown; n = 21) patients. Each point represents a single patient. The ellipses indicate the Student’s t-distribution with 95% probability for each group. Dotted lines: positivity threshold measured with pre-pandemic sera; bars are median. In (A) and (B), a Kruskal-Wallis test was performed; ∗p < 0.05, ∗∗∗p < 0.001, ∗∗∗∗p < 0.0001. See also Figures S5–S7 and Tables S3 and S4.
Figure 7
Figure 7
Kinetics of antibody functions in acute hospitalized patients and convalescent mildly symptomatic individuals (A) Hospitalized patients (n = 7) in the acute phase were sampled at several times after symptom onset. Their IgG (top left), IgM (top middle), and IgA (top right) levels were assessed longitudinally. CDC (bottom left), ADCC (bottom middle), and pseudoneutralization (bottom right) were also measured. The red curve represents a non-linear fit (four parameters) of the mean of all donors. The average fit of each function is also depicted (right panel). (B) Sera from mildly symptomatic patients in the convalescent phase (n = 21–22) were sampled twice at a 25–29-day interval. ADCC (top left), IgG (top right), pseudoneutralization (middle left), real-virus neutralization (middle right), and CDC (bottom left) levels were measured with serial dilutions. For each assay, the ED50 is represented against the day after symptom onset on the left graph. On the right graph, data for first and second samplings were pooled. ∗p < 0.05, ∗∗p < 0.01, ns, not significant (Wilcoxon test). See also Table S4.

References

    1. Wu F., Zhao S., Yu B., Chen Y.-M., Wang W., Song Z.-G., Hu Y., Tao Z.W., Tian J.H., Pei Y.Y. A new coronavirus associated with human respiratory disease in China. Nature. 2020;579:265–269. - PMC - PubMed
    1. Zhou P., Yang X.-L., Wang X.-G., Hu B., Zhang L., Zhang W., Si H.R., Zhu Y., Li B., Huang C.L. A pneumonia outbreak associated with a new coronavirus of probable bat origin. Nature. 2020;579:270–273. - PMC - PubMed
    1. Gorbalenya A.E., Baker S.C., Baric R.S., de Groot R.J., Drosten C., Gulyaeva A.A., Coronaviridae Study Group of the International Committee on Taxonomy of Viruses The species Severe acute respiratory syndrome-related coronavirus: classifying 2019-nCoV and naming it SARS-CoV-2. Nat. Microbiol. 2020;5:536–544. - PMC - PubMed
    1. Flaxman S., Mishra S., Gandy A., Unwin H.J.T., Mellan T.A., Coupland H., Whittaker C., Zhu H., Berah T., Eaton J.W., Imperial College COVID-19 Response Team Estimating the effects of non-pharmaceutical interventions on COVID-19 in Europe. Nature. 2020;584:257–261. - PubMed
    1. Guan W.-J., Ni Z.-Y., Hu Y., Liang W.-H., Ou C.-Q., He J.-X., Liu L., Shan H., Lei C.L., Hui D.S.C., China Medical Treatment Expert Group for Covid-19 Clinical characteristics of coronavirus disease 2019 in China. N. Engl. J. Med. 2020;382:1708–1720. - PMC - PubMed

Publication types

MeSH terms