. 2021 Jun 11;2(6):100262.
doi: 10.1016/j.patter.2021.100262. Epub 2021 Apr 20.

An intra-host SARS-CoV-2 dynamics model to assess testing and quarantine strategies for incoming travelers, contact management, and de-isolation

Affiliations

An intra-host SARS-CoV-2 dynamics model to assess testing and quarantine strategies for incoming travelers, contact management, and de-isolation

Wiep van der Toorn et al. Patterns (N Y). .

Abstract

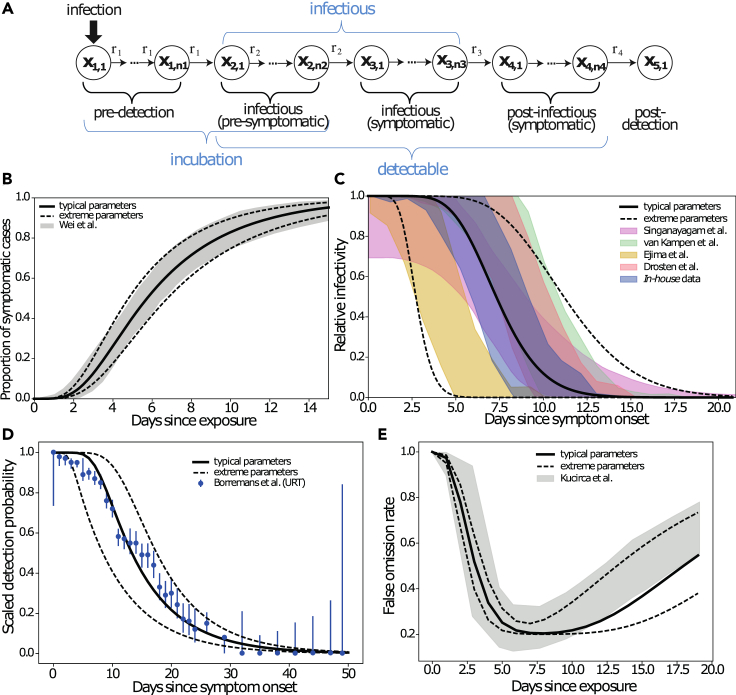
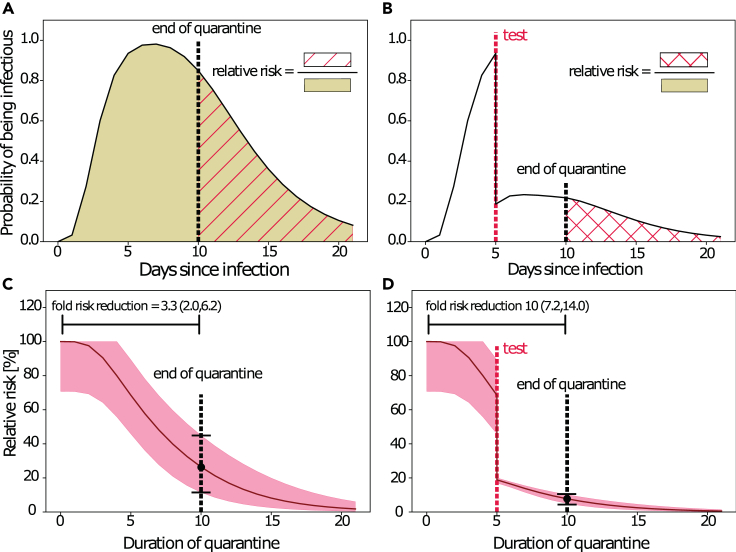
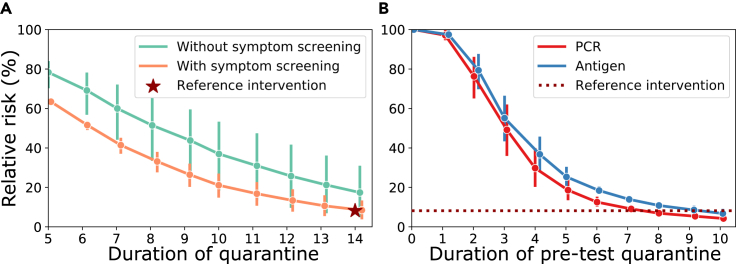
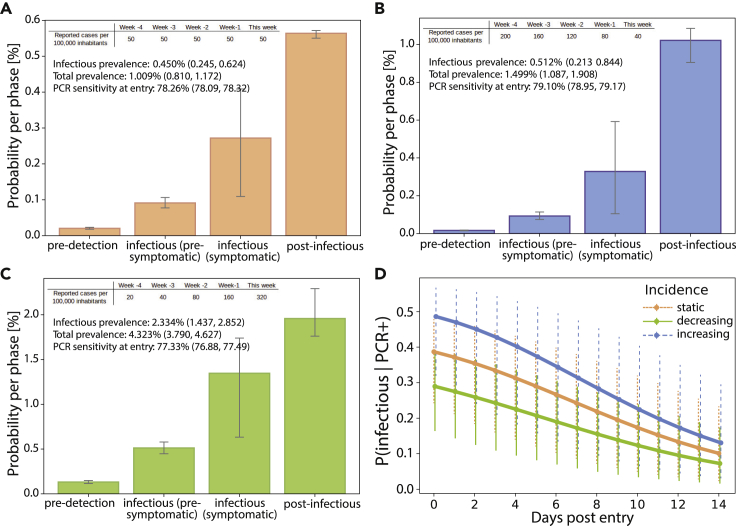
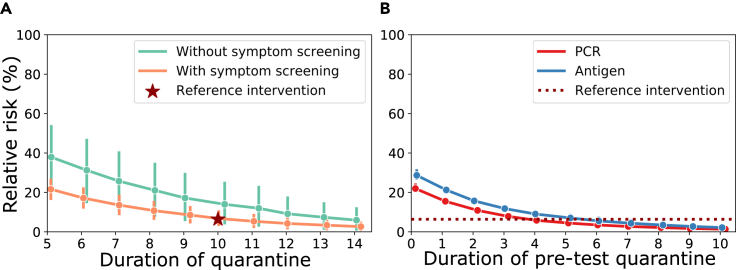
Non-pharmaceutical interventions (NPIs) remain decisive tools to contain SARS-CoV-2. Strategies that combine NPIs with testing may improve efficacy and shorten quarantine durations. We developed a stochastic within-host model of SARS-CoV-2 that captures temporal changes in test sensitivities, incubation periods, and infectious periods. We used the model to simulate relative transmission risk for (1) isolation of symptomatic individuals, (2) contact person management, and (3) quarantine of incoming travelers. We estimated that testing travelers at entry reduces transmission risks to 21.3% ([20.7, 23.9], by PCR) and 27.9% ([27.1, 31.1], by rapid diagnostic test [RDT]), compared with unrestricted entry. We calculated that 4 (PCR) or 5 (RDT) days of pre-test quarantine are non-inferior to 10 days of quarantine for incoming travelers and that 8 (PCR) or 10 (RDT) days of pre-test quarantine are non-inferior to 14 days of post-exposure quarantine. De-isolation of infected individuals 13 days after symptom onset may reduce the transmission risk to <0.2% (<0.01, 6.0).

Keywords: NPI strategies; PCR; SARS-CoV-2; antigen; dynamics; isolation; mathematical model; prevalence estimation; quarantine; testing.


Conflict of interest statement

The authors declare no competing interests.

Figures

Figure 1
Figure 1
Model validation Published and data-derived SARS-CoV-2 intra-patient dynamics (shaded areas), as well as model-predicted dynamics with default parameters (lines). (A) Model structure. (B) Duration of incubation. The cumulative time-to-symptom onset from a meta-analysis of 56 studies is shown (gray-shaded areas), together with the model-predicted time-to-symptom onset (solid line, typical dynamics; dashed lines, upper and lower extremes). (C) Relative infectiousness after symptom onset/peak viral load extracted from Singanayagam et al. and van Kampen et al.,, deduced from in-house data (supplemental experimental procedures) and derived from viral load kinetics reported by Ejima et al., are shown as shaded areas, whereas model-predicted infectiousness profiles are depicted by lines (solid line, typical dynamics; dashed lines, lower and upper extremes). (D) Time-dependent PCR sensitivity after symptom onset reported by Borremans et al. (error bars) together with model-simulated PCR sensitivity using default parameters (solid line, typical dynamics; dashed lines, lower and upper extremes). (E) Time-dependent false omission rate as reported by Kucirca et al. (shaded area). Solid and dashed lines show model simulations with typical and upper/lower extreme parameters. Details on the parameter fitting procedure and analysis of infectivity profiles are provided in the experimental procedures and supplemental experimental procedures.
Figure 2
Figure 2
Simulation of quarantine and testing strategies (A) Model-simulated probability of infectiousness. The shaded area indicates the transmission risk emanating from an infected individual. If a quarantine were imposed until day 10 (dashed black vertical line), the risk of transmission would relate to the red-hatched area. Hence, the relative risk denotes the risk after the quarantine divided by the risk without quarantine. (B) Model-simulated probability of infectiousness when a test (dashed red vertical line) was performed at day 5. If the test were positive, the person would go into isolation, thus not posing a risk, whereas there would be a residual risk that the person was infectious if the test were negative (false negative). The risk after a 10 day quarantine (dashed black vertical line) with a test at day 5 is indicated by the red-crosshatched area. (C) Relative risk profile for a pure quarantine (as exemplarily shown in [A]). Line, typical parameters; shaded area, extreme parameters. (D) Relative risk profile for a testing and quarantine scenario (as exemplarily shown in [A]). Line, typical parameters; shaded area, extreme parameters.
Figure 3
Figure 3
Risk reduction through quarantine and testing strategies in contact management (A) Calculated percentage relative risk during quarantine with and without symptom screening relative to no intervention. The WHO recommendation (14 day quarantine with symptom screening) is marked as the reference intervention (red star). Line, typical parameters; error bars, extreme parameters. (B) Calculated percentage relative risk for combined test and quarantine strategies. Here, an individual goes into a pre-test quarantine with a diagnostic test at the end of it, which, when negative, results in the release from quarantine. The reference efficacy (14 day quarantine with symptom screening) is indicated by a horizontal dotted red line. All calculations were performed with parameters from Table 2 and assuming 20% asymptomatic infections, solving Equations 9 and 13. We assumed that exposure occurred on day 0 (today), with pt0(xj,i)=1 for (j,i)=(1,1) and 0 for all other (j,i). Line, typical parameters; error bars, extreme parameters.
Figure 4
Figure 4
Pre-entry risk calculation for incoming travelers (A–C) (A) Prevalence estimation for travelers entering from a country with 20% probability of detection (P(detect)=20%) and a stable incidence (50 cases/100,000/week for the last 5 weeks), (B) a declining incidence (200, 160, 120, 80, 40 cases/100,000/week for the last 5 weeks), and (C) a rising incidence (20, 40, 80, 160, 320 cases/100,000/week for the last 5 weeks). Typical dynamics; error bars and values in parentheses, upper and lower extremes. (D) Time-dependent probability of detecting infectious individuals among the PCR-positive specimens in the respective cohorts of travelers in the days post-entry. Calculations were performed as outlined under “prevalence estimator” in the experimental procedures. Typical dynamics; error bars and values in parentheses, upper and lower extremes.
Figure 5
Figure 5
Risk reduction through quarantine and testing strategies for incoming travelers (stable incidence of 50 cases/100,000 inhabitants/week; P(detect)=20%) (A) Percentage relative risk during quarantine with and without symptom screening (20% asymptomatic, default parameters). A 10 day quarantine with symptom screening is marked as the reference intervention (red star), according to current German guidelines. Typical dynamics; error bars, upper and lower extremes. (B) Percentage relative risk for combined testing and quarantine strategies. In the simulated scenario, individuals go into a pre-test quarantine with a diagnostic test at the end of it, which, when negative, results in the release from quarantine. The reference efficacy (10 day quarantine with symptom screening) is indicated by a horizontal dotted red line. All calculations were performed with parameters from Table 2 and assuming 20% asymptomatic infections, solving Equations 9 and 13. Typical dynamics; error bars, upper and lower extremes.

References

    1. World Health Organization (2020). Pneumonia of Unknown Cause – China. Published online January 5, 2020.
    1. World Health Organization (2020). Statement on the Second Meeting of the International Health Regulations (2005) Emergency Committee Regarding the Outbreak of Novel Coronavirus (2019-nCoV).
    1. World Health Organization (2020). WHO Director-General's Opening Remarks at the Media Briefing on COVID-19 - 11 March 2020. Published online March 11, 2020.
    1. World Health Organization . 2020. WHO Coronavirus Disease (COVID-19) Dashboard.https://covid19.who.int/
    1. Levin A.T., Hanage W.P., Owusu-Boaitey N., Cochran K.B., Walsh S.P., Meyerowitz-Katz G. Assessing the age specificity of infection fatality rates for COVID-19: systematic review, meta-analysis, and public policy implications. Eur. J. Epidemiol. 2020;35:1123–1138. doi: 10.1007/s10654-020-00698-1. - DOI - PMC - PubMed

LinkOut - more resources