Clinical Trial
. 2021 May 7;144(4):1152-1166.
doi: 10.1093/brain/awab040.

Dietary conjugated linoleic acid links reduced intestinal inflammation to amelioration of CNS autoimmunity

Affiliations
Clinical Trial

Dietary conjugated linoleic acid links reduced intestinal inflammation to amelioration of CNS autoimmunity

Ann-Katrin Fleck et al. Brain. .

Abstract

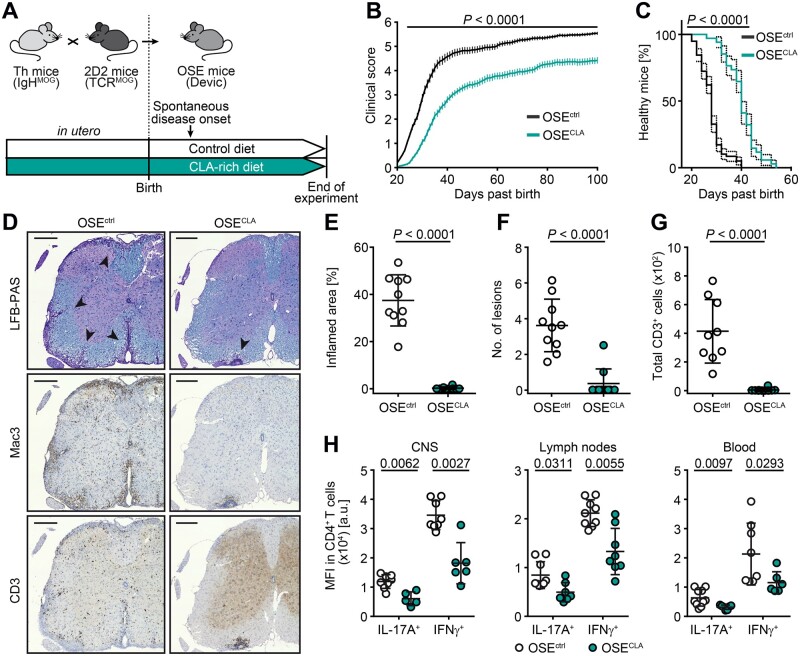
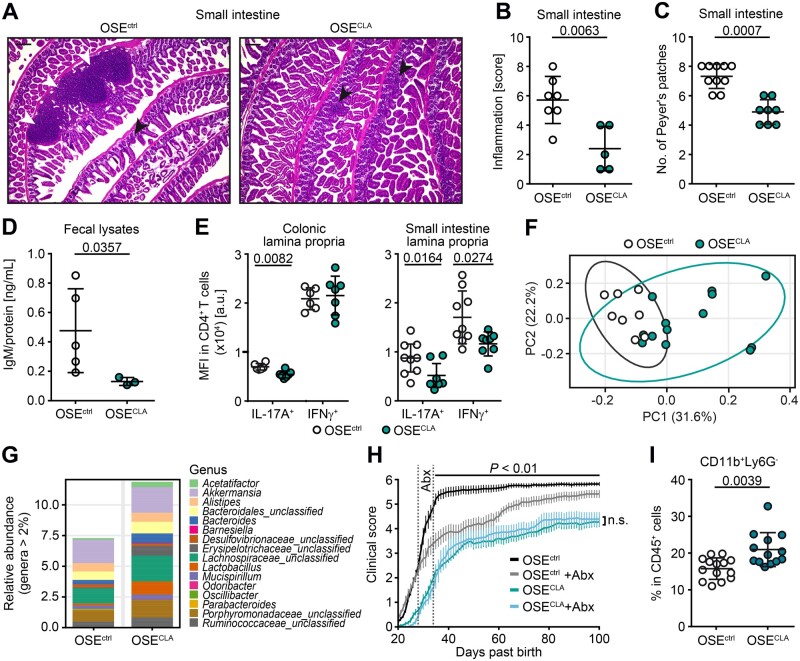
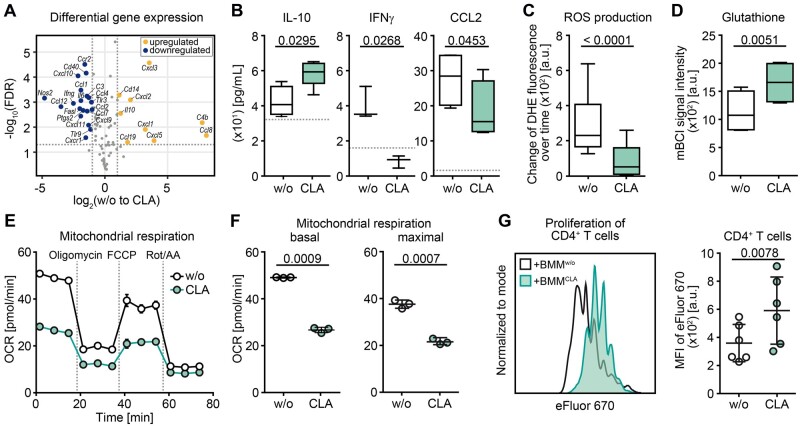
A close interaction between gut immune responses and distant organ-specific autoimmunity including the CNS in multiple sclerosis has been established in recent years. This so-called gut-CNS axis can be shaped by dietary factors, either directly or via indirect modulation of the gut microbiome and its metabolites. Here, we report that dietary supplementation with conjugated linoleic acid, a mixture of linoleic acid isomers, ameliorates CNS autoimmunity in a spontaneous mouse model of multiple sclerosis, accompanied by an attenuation of intestinal barrier dysfunction and inflammation as well as an increase in intestinal myeloid-derived suppressor-like cells. Protective effects of dietary supplementation with conjugated linoleic acid were not abrogated upon microbiota eradication, indicating that the microbiome is dispensable for these conjugated linoleic acid-mediated effects. Instead, we observed a range of direct anti-inflammatory effects of conjugated linoleic acid on murine myeloid cells including an enhanced IL10 production and the capacity to suppress T-cell proliferation. Finally, in a human pilot study in patients with multiple sclerosis (n = 15, under first-line disease-modifying treatment), dietary conjugated linoleic acid-supplementation for 6 months significantly enhanced the anti-inflammatory profiles as well as functional signatures of circulating myeloid cells. Together, our results identify conjugated linoleic acid as a potent modulator of the gut-CNS axis by targeting myeloid cells in the intestine, which in turn control encephalitogenic T-cell responses.

Keywords: conjugated linoleic acid; dietary supplementation; gut–CNS axis; intestinal inflammation; multiple sclerosis.


Figures

Figure 1
Figure 1
Dietary supplementation with CLA ameliorates spontaneous CNS autoimmunity. (AE) Breeding pairs and OSE offspring were fed with CLA-enriched or control (C1000) chow ad libitum. (B and C) Clinical scores are shown over 100 days from OSEctrl (n=58) and OSECLA mice (n=34). (B) Disease courses are illustrated as mean group score over time ± SEM. (C) Disease onset (score ≥ 1) is shown as percentage of healthy mice. (DG) Immune cell infiltration within spinal cords of OSEctrl (n ≥ 9) and OSECLA mice (n=10) was assessed via histology. (D) Representative spinal cord stainings, percentages of inflamed area of total white matter marked by (E) Mac3+ infiltrates, (F) total counts of Mac3+ lesions, and (G) CD3+ cells are shown. (H) CD4+ T cells derived from the CNS, inguinal lymph nodes or blood of OSEctrl (n ≥ 8) and OSECLA mice (n ≥ 5) were restimulated for cytokine analysis. Dot plots depict representative mean fluorescence intensity (MFI) of cytokine expression shown as mean ± SD, whereas each dot represents one individual mouse. Statistics: (B) two-way ANOVA with Bonferroni correction; (C) log-ranked Mantel-Cox test (dotted lines indicate 95% confidence interval); (EH) Mann-Whitney U-test. Scale bars = 200 µm.
Figure 2
Figure 2
CLA supplementation reduces intestinal inflammation in OSE mice. (A) Haematoxylin and eosin (HE)-stained small intestine tissue slices of representative OSEctrl and OSECLA mice (black arrows = mucosal inflammatory cell infiltrates; white arrows = submucosal inflammation/expanding lymphoid follicles). (B) Histopathological intestinal inflammation score of the small intestine was assessed for OSEctrl (n=7) and OSECLA mice (n=5). (C) Total counts of Peyer’s patches in the small intestine of OSEctrl (n=10) and OSECLA mice (n=8) as well as (D) concentrations of faecal immunoglobulin M (IgM) normalized to total protein amount in OSEctrl (n=5) and OSECLA mice (n=3) are shown. (E) Representative MFI of cytokine expression in intestinal CD4+ T cells is illustrated for age-matched OSEctrl (n ≥ 6) and OSECLA mice (n ≥ 7). (F and G) Analysis of the gut microbiome of OSEctrl (n=8) and OSECLA mice (n=13) is shown as (F) PCA and (G) bar graph of the relative abundance at the genus level. (H) Short-term treatment with antibiotics (Abx) has been applied to OSEctrl + Abx (n=9) and OSECLA +Abx mice (n=9). The clinical scores of these mice and their non-antibiotic-treated controls (OSEctrln=17; OSECLAn=15) are illustrated as mean group scores over time ± SEM. (I) Frequency of colonic MDSC-like cells (CD11b+ Ly6G) in OSEctrl (n=14) versus OSECLA mice (n=13) was determined via flow cytometry. Scatter dot plots depict mean ± SD, whereas each dot represents one individual mouse. Statistics: (H) two-way ANOVA with Bonferroni correction; (BE and I) Mann-Whitney U-test. Scale bars = 200 µm; n.s. = not significant.
Figure 3
Figure 3
CLA treatment enhances anti-inflammatory and suppressive features of myeloid cells in vitro. (A) Differential expression analysis of immune response-related genes via RT2 Profiler array is illustrated as a volcano plot of the false discovery rate (FDR) corrected P-values against fold change of untreated versus CLA-treated (50 µM of each isomer = CLA-mix) splenic CD11b+ (n=4; blue = downregulated; yellow = upregulated). (BG) BMMs were differentiated without or with 50 µM CLA-mix over 7 days. At least three independent experiments were performed for each readout. (B) Concentrations of secreted cytokines in cell supernatants were assessed by ELISA. Box plots display the median, interquartile interval of 95% (box) as well as minimum and maximum (whiskers) of pooled data (n ≥ 3 per group). Dotted lines indicate the detection limit. Characterization of (C) reactive oxygen species-production rate (DHE = dihydroethidium, n=6) and (D) glutathione levels (mBCI = monochloromobimane, n=4) in BMMs are shown. (E and F) Real-time measurement of oxygen consumption rate (OCR) in BMMs is shown as (E) graph of one example oxygen consumption rate measurement as well as (F) dot plots of basal and maximal respiration of one example experiment out of three independent experiments with in total six mice, whereas one dot represents one technical replicate. (G) Suppression assay with anti-CD3-activated splenic CD4+ T cells and differentiated BMMs was performed with or without CLA treatment (ratio 2:1). Left: Example MFI profile of eFluorTM 670 in CD4+ T cells of one experiment is shown. Right: Dot plot illustrates pooled data of MFI of CD4+ T cells, whereas each dot represents the mean of three technical replicates from BMMs generated from one individual mouse. Dot plots depict mean ± SD. Statistics: paired two-tailed Student’s t-test.
Figure 4
Figure 4
Dietary CLA supplementation in multiple sclerosis patients alters blood myeloid cell composition by enhancing anti-inflammatory and suppressive subsets and functional properties. (A) CD14+ monocytes were isolated from frozen PBMC of RRMS patients and cultured in the presence or absence of 75 µM CLA-mix for 24 h (n=3). Transcriptional signatures were analysed using the nCounter® Myeloid Innate Immunity Gene Expression Panel (NanoString) and significant differentially expressed genes (P-value < 0.05 and adjusted P-value < 0.5) are illustrated as a heat map. (B) Study design of proof-of-concept trial CLAiMS is shown. (CG) Frozen PBMC of study subjects at baseline (BL) and 6 months (6M) after CLA supplementation as depicted in B, were stained with monocyte-specific antibodies and analysed by multi-colour flow cytometry. (C) Percentages of CD14+/dim CD16+ (intermediate and non-classical) and CD14+ CD16 (classical) monocytes were evaluated by manual gating (n=15). (D) Unbiased cluster analysis of monocyte panels is shown as bh-SNE plot of unstimulated monocytes (left) and LPS-stimulated monocytes (right) (n=12) comparing baseline and 6 months of CLA supplementation. Significantly upregulated clusters are depicted in orange and downregulated clusters are displayed in blue. Clusters with a high (continuous line) and low (dotted line) cytokine expression profile (CCL2, IFNγ, IL1β, IL6, IL8) are highlighted. (E) MFI of pro-inflammatory cytokines in unstimulated CD14+ monocytes, and (F) MFI of CD68 and S100A9 expression in CD14+ CD16 (classical) monocytes were evaluated by manual gating (n=12). (G) MFI of S100A9 expression in HLA-DRlow/CD14+ cells (MDSC-like phenotype) (n=12) is shown. (H) Transcriptional signatures of CD14+ monocytes isolated at baseline and after 6 months of CLA supplementation were analysed by the nCounter® Myeloid Innate Immunity Gene Expression Panel (NanoString) and illustrated as a heat map (n=12, P-value < 0.05). (I) Oxygen consumption rate of CD14+ monocytes isolated at BL and after 6M of CLA supplementation is shown for basal and maximal respiration (n ≥ 10). Dot plots depict mean ± SD. Each dot represents one individual patient at baseline or 6 months; in EG only, dots belonging to the same patient are connected by a line. Statistics: paired two-tailed Student’s t-test; reg. = regulated.

Similar articles

Cited by

References

    1. Amato MP, Derfuss T, Hemmer B, et al.Environmental modifiable risk factors for multiple sclerosis: report from the 2016 ECTRIMS focused workshop. Mult Scler J. 2018;24:590-603. - PubMed
    1. Ascherio A, Munger KL, White R, et al.Vitamin D as an early predictor of multiple sclerosis activity and progression. JAMA Neurol. 2014;71:306-314. - PMC - PubMed
    1. Munger KL, Bentzen J, Laursen B, et al.Childhood body mass index and multiple sclerosis risk: a long-term cohort study. Mult Scler J. 2013;19:1323-1329. - PMC - PubMed
    1. Riccio P, Rossano R.. Diet, gut microbiota, and vitamins D + A in multiple sclerosis. Neurotherapeutics. 2017;15:1-17. - PMC - PubMed
    1. Haghikia A, Jörg S, Duscha A, et al.Dietary fatty acids directly impact central nervous system autoimmunity via the small intestine. Immunity. 2015;43:817-829. - PubMed

Publication types

MeSH terms

Substances