. 2021 Oct;41(10):2656-2675.
doi: 10.1177/0271678X211010354. Epub 2021 Apr 25.

Connexin43 promotes angiogenesis through activating the HIF-1α/VEGF signaling pathway under chronic cerebral hypoperfusion

Affiliations

Connexin43 promotes angiogenesis through activating the HIF-1α/VEGF signaling pathway under chronic cerebral hypoperfusion

Weiwei Yu et al. J Cereb Blood Flow Metab. 2021 Oct.

Abstract

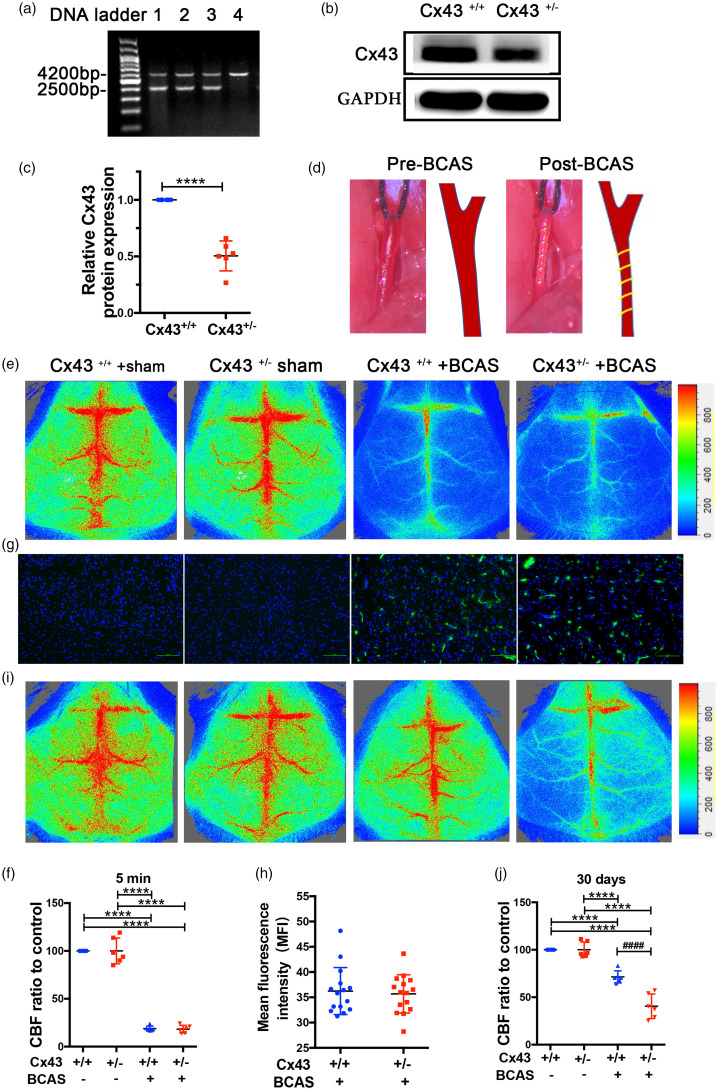
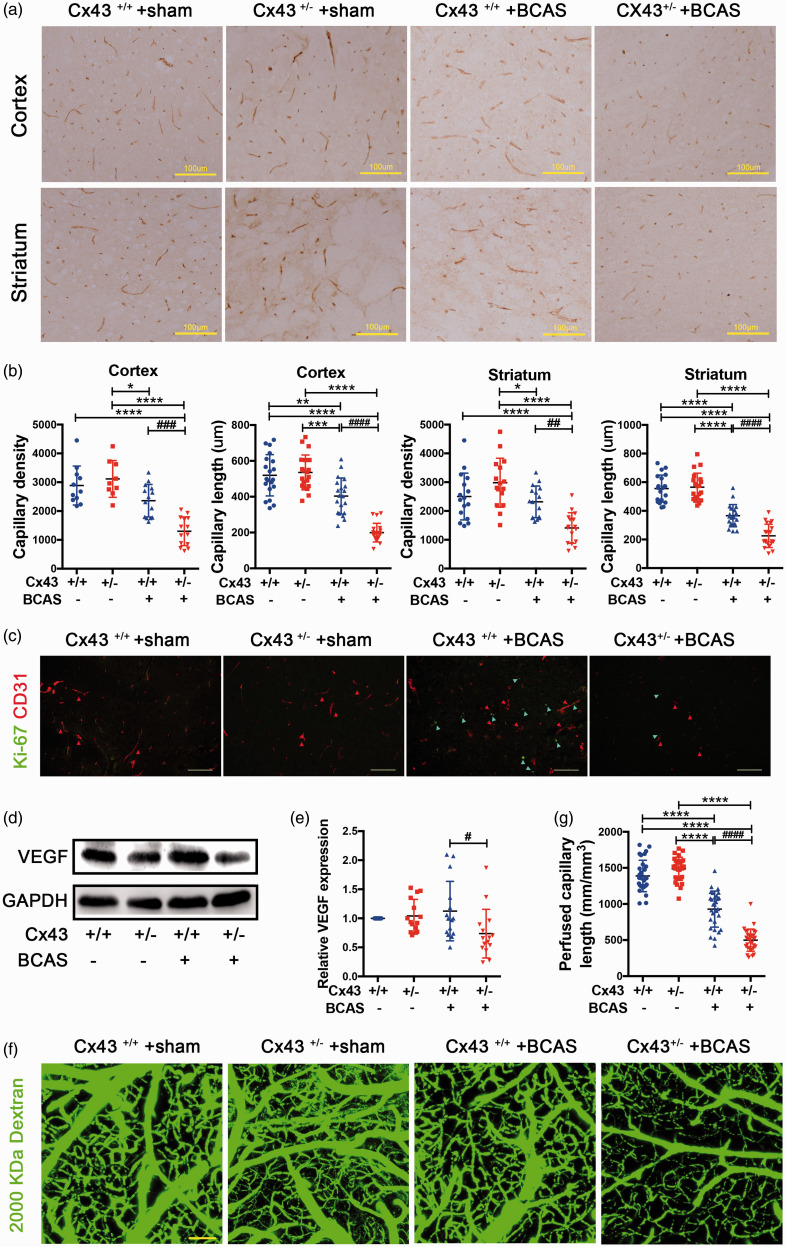
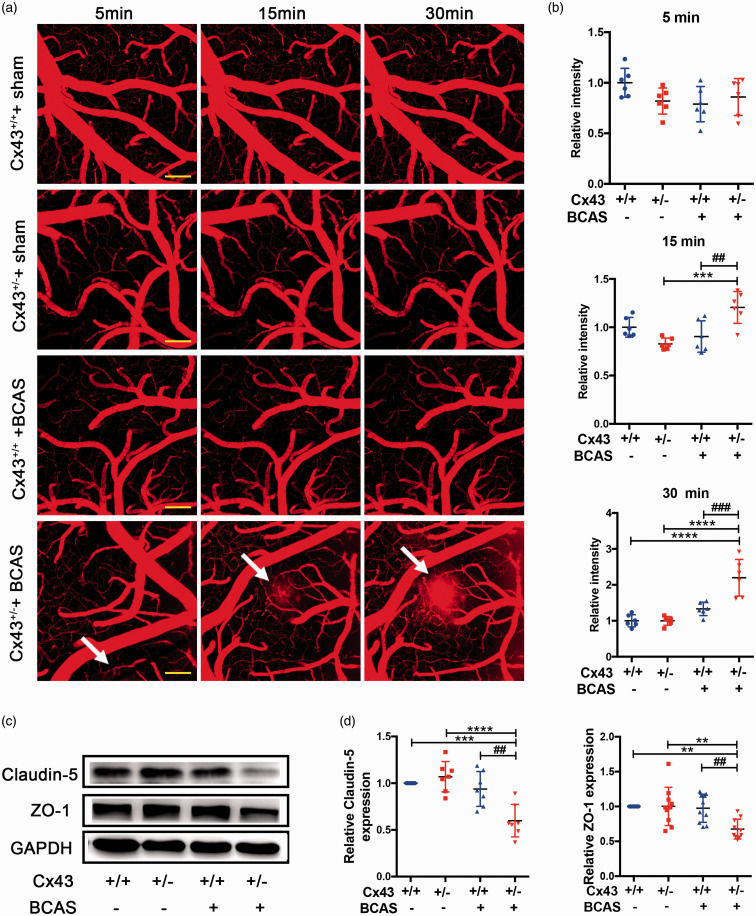
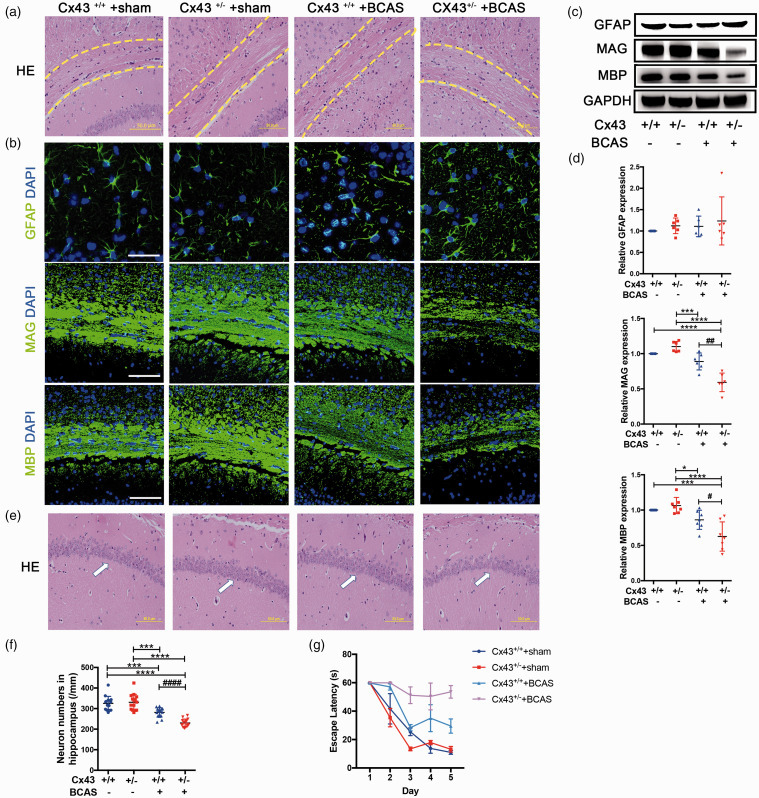
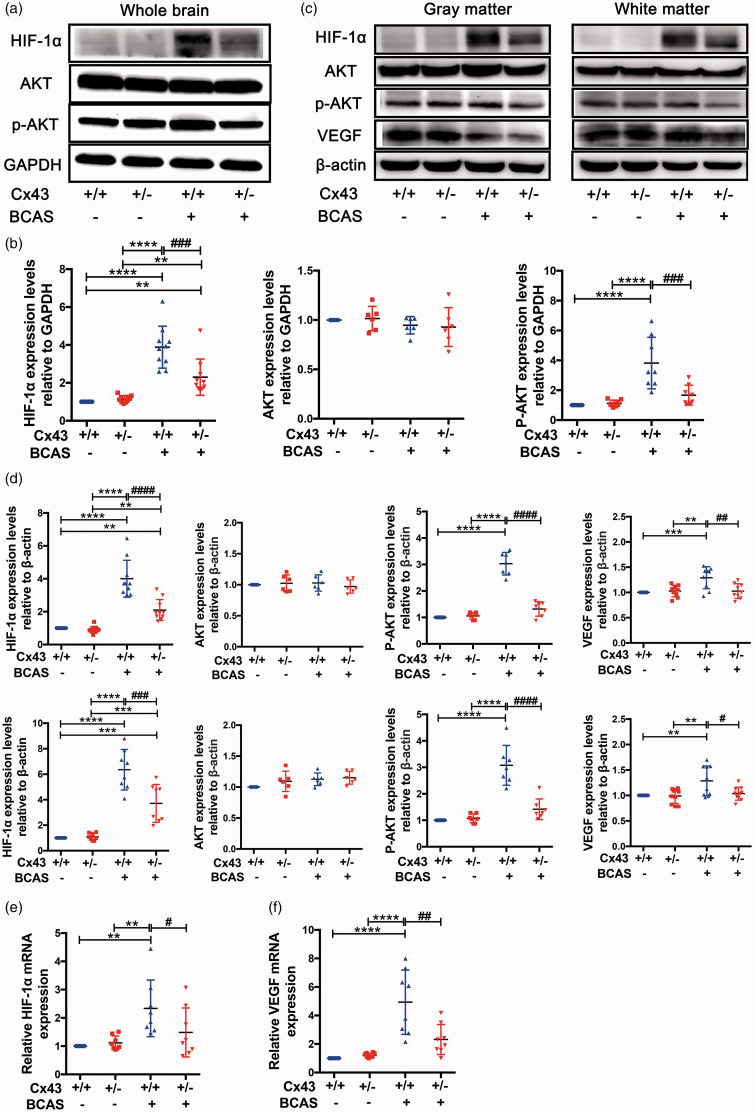
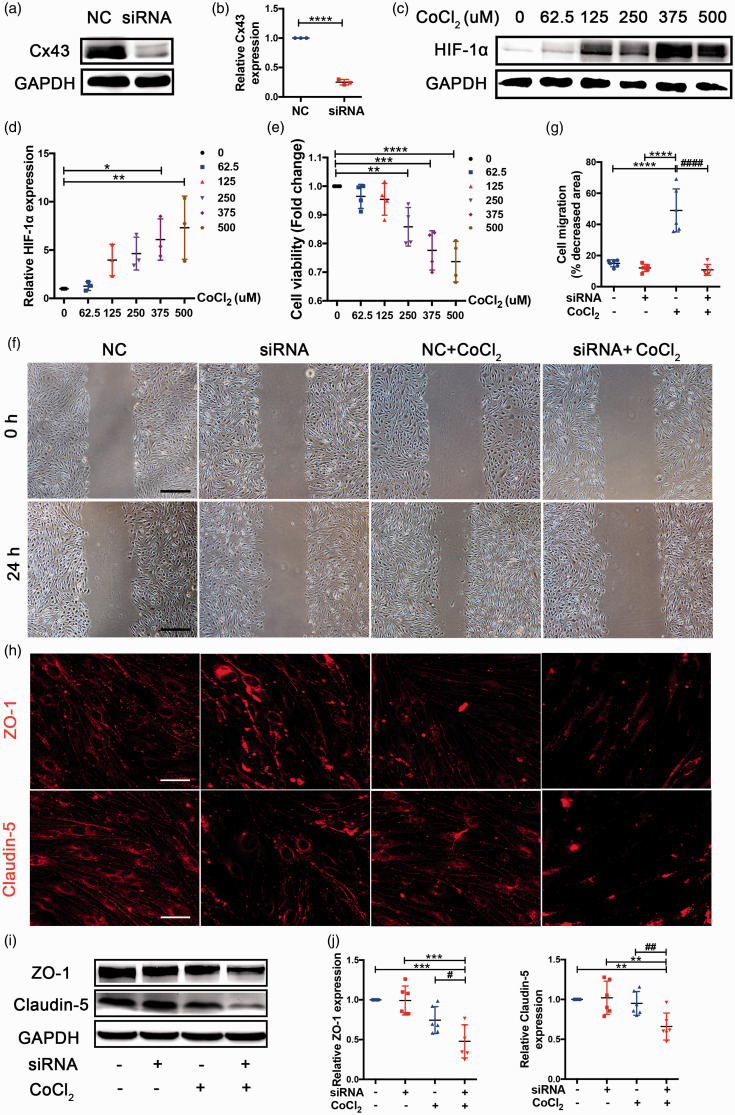
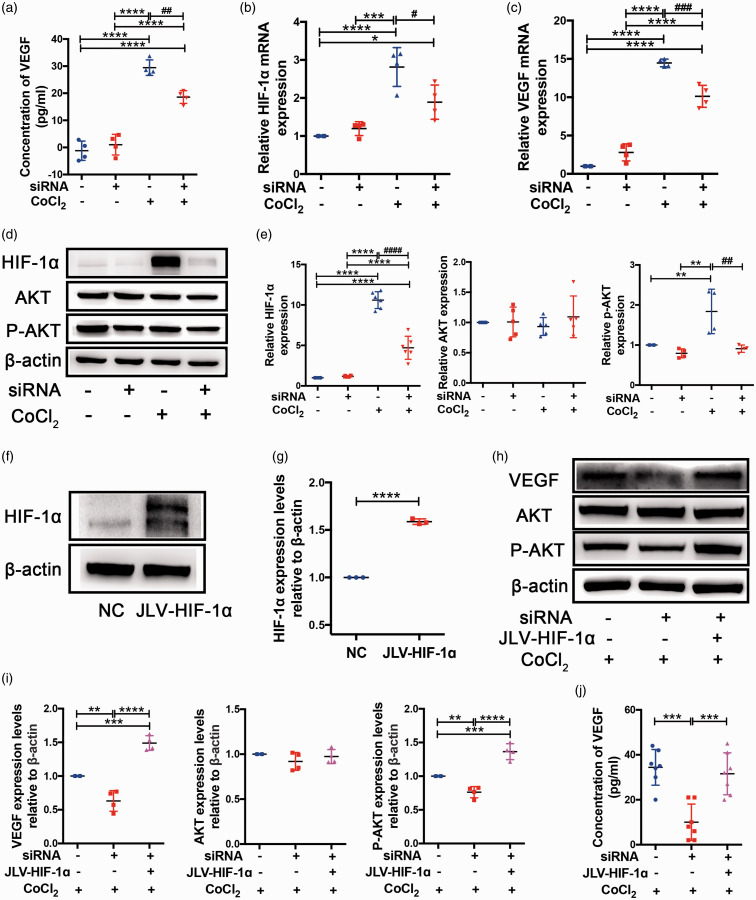
Chronic cerebral hypoperfusion, a major vascular contributor to vascular cognitive impairment and dementia, can exacerbate small vessel pathology. Connexin43, the most abundant gap junction protein in brain tissue, has been found to be critically involved in the pathological changes of vascular cognitive impairment and dementia caused by chronic cerebral hypoperfusion. However, the precise mechanisms underpinning its role are unclear. We established a mouse model via bilateral common carotid arteries stenosis on connexin43 heterozygous male mice and demonstrated that connexin43 improves brain blood flow recovery by mediating reparative angiogenesis under chronic cerebral hypoperfusion, which subsequently reduces the characteristic pathologies of vascular cognitive impairment and dementia including white matter lesions and irreversible neuronal injury. We additionally found that connexin43 mediates hypoxia inducible factor-1α expression and then activates the PKA signaling pathway to regulate vascular endothelial growth factor-induced angiogenesis. All the above findings were replicated in bEnd.3 cells treated with 375 µM CoCl2in vitro. These results suggest that connexin 43 could be instrumental in developing potential therapies for vascular cognitive impairment and dementia caused by chronic cerebral hypoperfusion.

Keywords: Chronic cerebral hypoperfusion; Connexin43; angiogenesis; hypoxia inducible factor-1α; vascular cognitive impairment and dementia.


Conflict of interest statement

Declaration of conflicting interests: The author(s) declared no potential conflicts of interest with respect to the research, authorship, and/or publication of this article.

Figures

Figure 1.
Figure 1.
Cx43 KO mice manifested flawed brain blood flow recovery in response to CCH. PCR (a) and immunoblot (b) were performed to evaluate the genotype of Cx43 KO mice. (a) Genomic DNA from Cx43 WT and KO mice were subjected to PCR using the primers for genotyping. (b) Brains isolated from Cx43 WT and KO mice were lysed and the expression levels of Cx43 were examined using GAPDH as a loading control. (c) Analysis of eoptical densities of the bands. ****P<0.0001, n = 6 mice for each group. (d) Representative photographs of CCA before (left) and after (right) placement of a microcoil. (e) Laser Doppler was used to monitor CBF before and 5 min after BCAS surgery. (f) Quantitative analysis of CBF using percentage of the ischemic brain relative to the control brain. (g) Representative images of pimonidazole adducts in the cerebral tissue of the four mouse groups. Scale bar =100 μm. (h) The average fluorescence intensity of the hypoxic area was analyzed in the brains of the BCAS-operated group mice using a Student’s t-test. (I) 30 days after the surgery, Laser Doppler was used to analyze CBF in the four mouse groups. (j) A quantitative comparison of CBF in Figure 1(i) using percentage relative to the sham-operated mice. ****P < 0.0001 versus sham-operated mice, ####P < 0.0001 versus BCAS-operated Cx43+/+ mice, n = 6 mice in each group.
Figure 2.
Figure 2.
Cx43 KO mice displayed defective reparative angiogenesis after BCAS. (a) Immunohistochemical analysis of CD31 in the cortex and striatum of the brain slices removed from the four mouse groups 30 days after surgery. Brown strips indicated CD31-positive capillaries. Scale bar =100μm. (b) Quantification of density and length of CD31-positive capillaries in the cortex and striatum. (c) Ki-67 and CD31 immunohistochemical double-staining. Ki-67 was stained in green and CD31 in red. Scale bar =100μm. (d) Immunoblot analysis of VEGF expression of brain tissues with GAPDH used as loading control. (e) Quantitative analysis of VEGF relative to GAPDH. (f) Cortical microvascular perfusion was evaluated by in vivo multiphoton microscopy analysis of 2,000,000 Da FITC-conjugated dextran. Scale bar =100μm. (g) Quantitative analysis of perfused capillary length from angiograms in Figure 2(f). ****P < 0.0001 ***P < 0.001 **P < 0.01 *P < 0. 05 versus sham-operated mice, ####P < 0.0001 ###P < 0.001 ##P < 0.01 #P < 0.05 versus BCAS-operated Cx43+/+ mice, n ≥ 6 mice in each group.
Figure 3.
Figure 3.
BBB disruption in Cx43-deficient mice under CCH. (a) 30 days after BCAS, in vivo multiphoton imaging of 40,000 Da FITC-conjugated dextran leakage from microvascular at 5 min, 15 min, and 30 min after FITC-dextran intravenous administration. Scale bar =100μm. (b) Quantitative analysis of the relative fluorescence intensity across a cross-section of vessels from each group in Figure 3(a) using NIH image J software. (c) Western blots showing the integrity of the BBB under CCH by analyzing the levels of claudin-5 and ZO-1. (d) Quantitative analysis of protein levels relative to GAPDH. ****P < 0.0001 ***P < 0.001 **P < 0.01 versus sham-operated mice, ###P < 0.001 ##P < 0.01 versus BCAS-operated Cx43+/+ mice, n ≥ 6 mice for each group.
Figure 4.
Figure 4.
Representative images to explicate the pathogenesis of white matter and hippocampal neuron injury in Cx43 WT and KO mice. (a) HE staining was used to observe the changes in WMLs in CC (critical areas indicated between two yellow dotted lines) of sham- and BCAS-operated mice. Scale bar =50 μm. (b) Representative images depicting immunofluorescent labeling of GFAP, MAG and MBP with DAPI in mouse CC, which are indicative of a loss of myelin integrity and damage. Scale bar =100 μm. (c) Western blot analysis for GFAP, MAG and MBP expression with GAPDH used as an internal control. (d) Quantitative analysis of proteins relative to GAPDH was performed. (e) The results of HE staining also showed significant damage in hippocampal neurons (white arrows). Scale bar =50 μm. (f) Quantification of the hippocampal CA1 neurons. (g) Representative results for the Morris water maze. The escape latency during training was recorded and analyzed. ****P < 0.0001 ***P < 0.001 *P < 0.05 versus sham-operated mice, ####P < 0.0001 ##P < 0.01 #P < 0.05 versus BCAS-operated Cx43+/+ mice, n ≥ 6 mice for each group.
Figure 5.
Figure 5.
Cx43 regulated VEGF-induced angiogenesis through the HIF-1α-PKA signaling pathway. The brain tissues removed from the four mouse groups 30 days after surgery were used for western blots and RT-PCR. (a) Representative images of western blots for HIF-1α, AKT, and p-AKT using GAPDH as an internal control. (b) Differences in the band intensities of HIF-1α, AKT, and p-AKT were compared among the four mouse groups. (c) Representative images of separate western blot analyses for the HIF-1α/P-AKT pathway in white and gray matter using β-actin as an internal control. (d) Quantitative analysis of the band intensities relative to β-actin. (e) HIF-1α mRNA expression in the four mouse groups was evaluated using RT-PCR. (f) RT-PCR measures of VEGF mRNA in each group of mice. ****P < 0.0001 ***P < 0.001 **P < 0.01 versus sham-operated mice, ####P < 0.0001 ###P < 0.001 ##P < 0.01 #P < 0.05 versus BCAS-operated Cx43+/+ mice, n ≥ 6 mice for each group.
Figure 6.
Figure 6.
Cx43-deficient bEnd.3 cells were defective in the migration involved in angiogenesis and TJ protein levels. (a) Western blot analysis of Cx43 expression in NC and siRNA-treated bEnd.3 cells. (b) Quantitative analysis of Cx43 protein level relative to GAPDH. (c) Western blot analysis for HIF-1α extracted from bEnd.3 cells treated with 0, 62.5, 125, 250, 375, and 500 μmol/L CoCl2 for 24 h to select the suitable hypoxic concentration, and GAPDH was an internal control. (d) Quantitative analysis of HIF-1α level relative to GAPDH. (e) CCK-8 assay was used to assess cell viability. The CCK-8 readings further contributed to choosing the suitable hypoxic concentration. (f) Representative images of endothelial wound healing assay. Scale bar =0.5 mm. (g) Quantitative analysis of migratory area expressed as pixels squared. (h) Representative images depicting immunofluorescent labeling claudin-5 and ZO-1 in the four cell groups. Scale bar =100 μm. (i) Western blot analysis for claudin-5 and ZO-1 of samples from the four group bEnd.3 cell groups. (j) Quantitative analysis of claudin-5 and ZO-1 relative to GAPDH was performed. ****P < 0.0001 ***P < 0.001 **P < 0.01 *P < 0.05 versus control cells, ####P < 0.0001 ##P < 0.01 #P < 0.05 versus CoCl2-treated control cells. All these studies were conducted independently at least three times.
Figure 7.
Figure 7.
Cx43 mediated VEGF-induced angiogenesis by activating the HIF-1α-PKA signaling pathway in vitro. (a) VEGF contents in the culture medium of each group of cells were analyzed using a VEGF ELISA kit. (b) HIF-1α mRNA expression in four cell groups were studied by RT-PCR. (c) RT-PCR results indicating VEGF mRNA levels in each cell group. (d) Western blot images of HIF-1α, AKT, and p-AKT from the cultured bEnd.3 samples in four difference groups. β-actin was an internal control. (e) Quantitative analysis of protein levels relative to β-actin. (f) Western blot analysis of HIF-1α expression in lentivirus-transfected cells. (g) Quantitative analysis of HIF-1α protein level relative to β-actin. (h) Representative images of western blots for VEGF, AKT, and p-AKT expression in the three group bEnd.3 cell groups treated with 375 μmol/L CoCl2 for 24 h. (i) Quantitative analysis of the band intensities relative to β-actin. (j) VEGF concentrations in the culture medium of the three group bEnd.3 cell groups were analyzed using a VEGF ELISA kit. ****P < 0.0001 ***P < 0.001 **P < 0.01 *P < 0.05 versus control cells, ####P < 0.0001 ###P < 0.001 ##P < 0.01 #P < 0.05 versus CoCl2-treated control cells. All these studies were conducted independently at least three times.

Similar articles

Cited by

References

    1. Kalaria RN. Neuropathological diagnosis of vascular cognitive impairment and vascular dementia with implications for Alzheimer's disease. Acta Neuropathol 2016; 131: 659–685. - PMC - PubMed
    1. Wallin A, Roman GC, Esiri M, et al.. Update on vascular cognitive impairment associated with subcortical small-vessel disease. J Alzheimers Dis 2018; 62: 1417–1441. - PMC - PubMed
    1. Yu P, Venkat P, Chopp M, et al.. Role of microRNA-126 in vascular cognitive impairment in mice. J Cereb Blood Flow Metab 2019; 39: 2497–2511. - PMC - PubMed
    1. Toth P, Tarantini S, Csiszar A, et al.. Functional vascular contributions to cognitive impairment and dementia: mechanisms and consequences of cerebral autoregulatory dysfunction, endothelial impairment, and neurovascular uncoupling in aging. Am J Physiol Heart Circ Physiol 2017; 312: H1–h20. - PMC - PubMed
    1. Paulson OB, Hasselbalch SG, Rostrup E, et al.. Cerebral blood flow response to functional activation. J Cereb Blood Flow Metab 2010; 30: 2–14. - PMC - PubMed

Publication types

Substances

LinkOut - more resources