

Selection for increased tibia length in mice alters skull shape through parallel changes in developmental mechanisms
- PMID: 33899741
- PMCID: PMC8118654
- DOI: 10.7554/eLife.67612
Selection for increased tibia length in mice alters skull shape through parallel changes in developmental mechanisms
Abstract
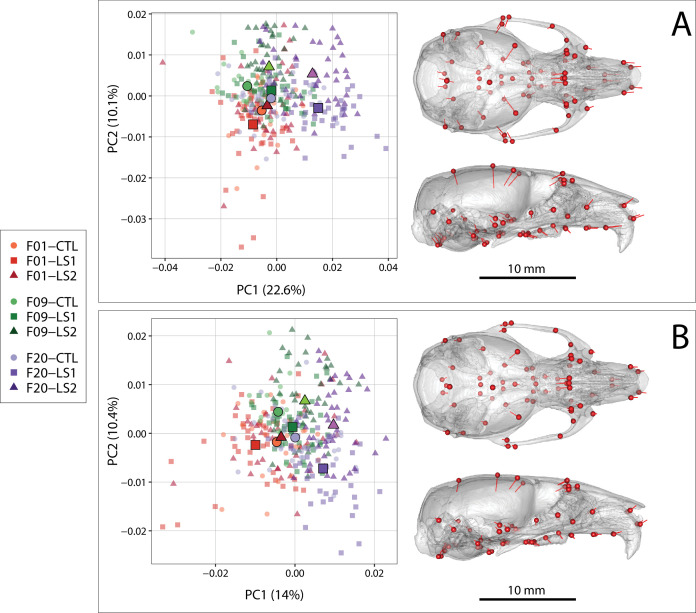
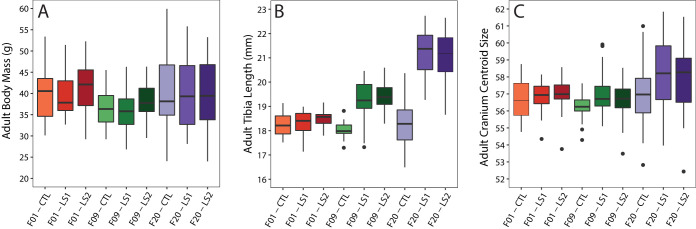
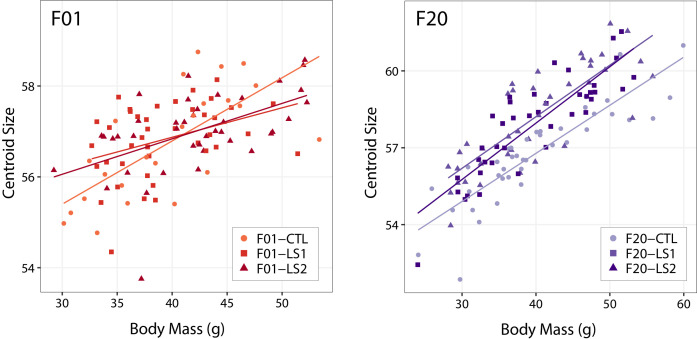
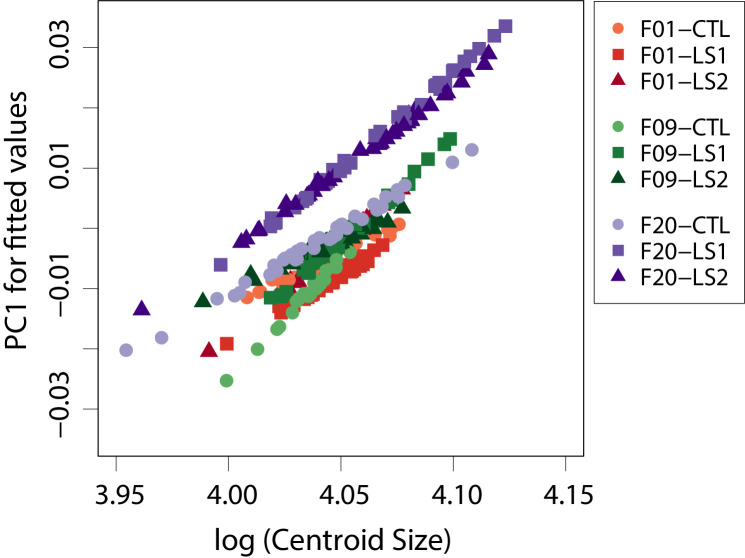
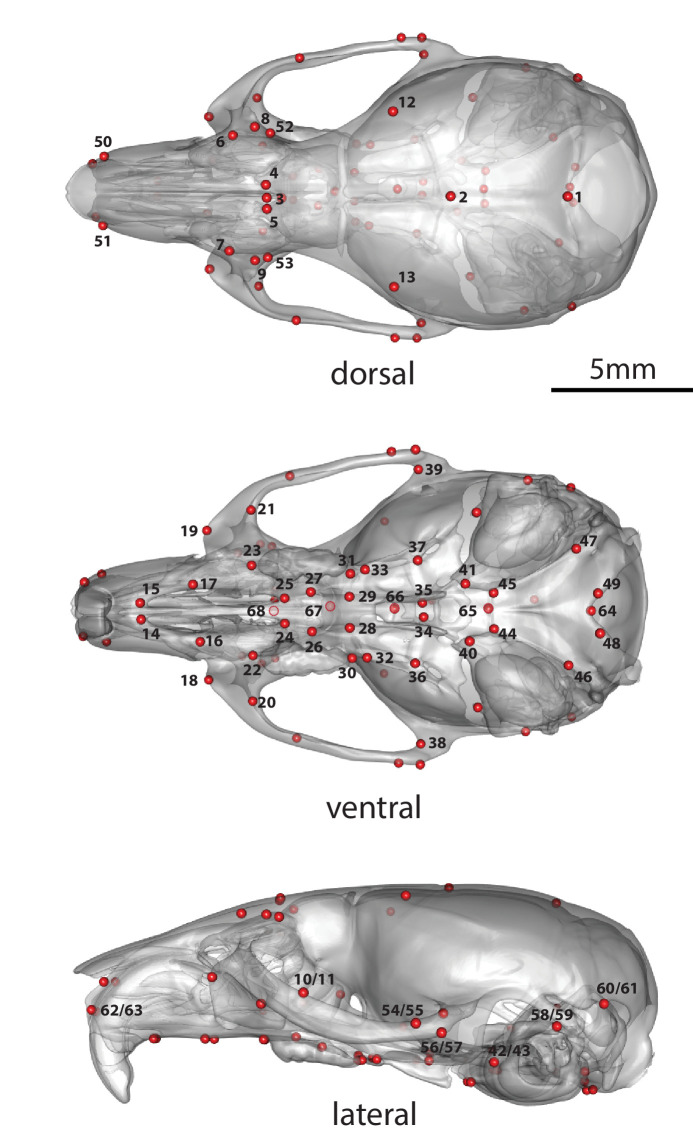
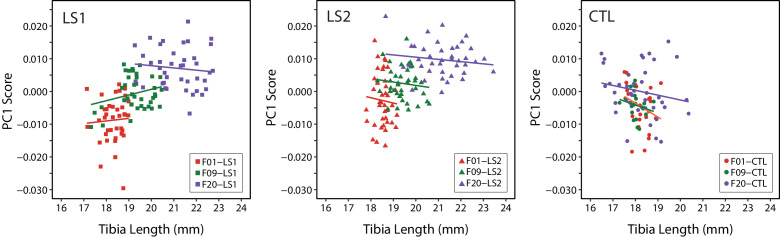
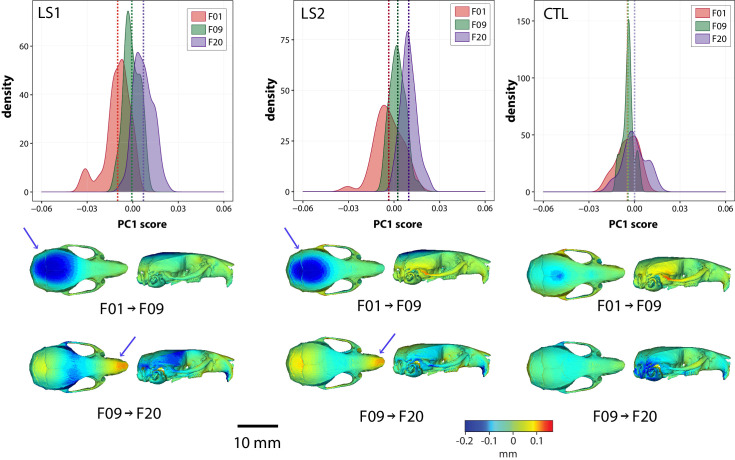
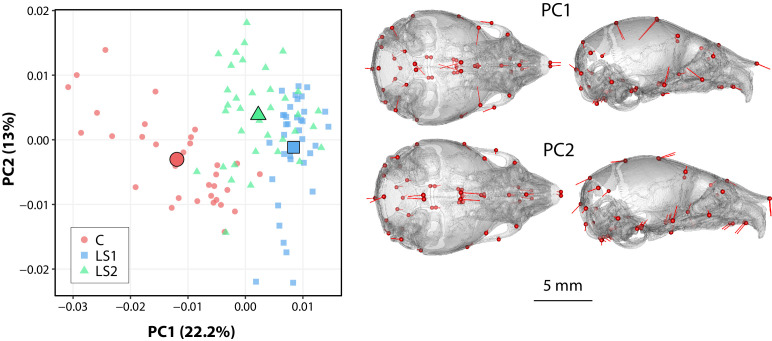
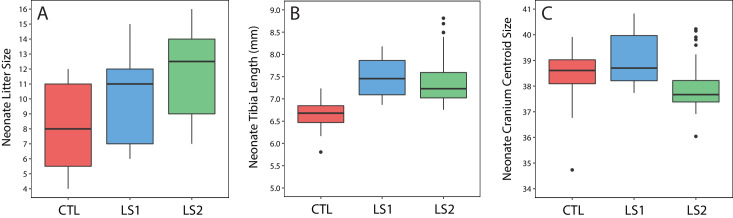
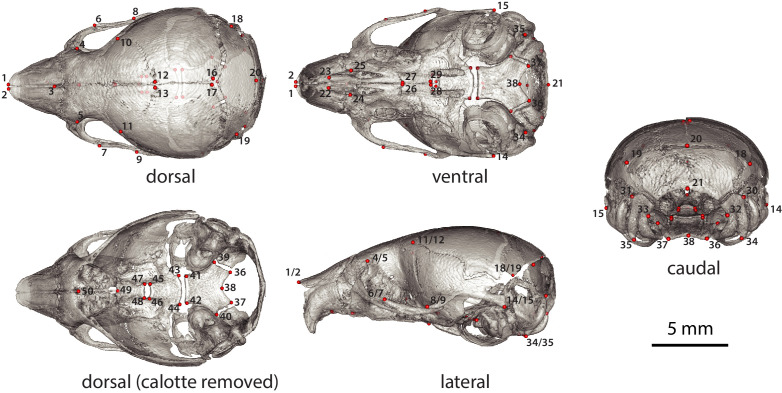
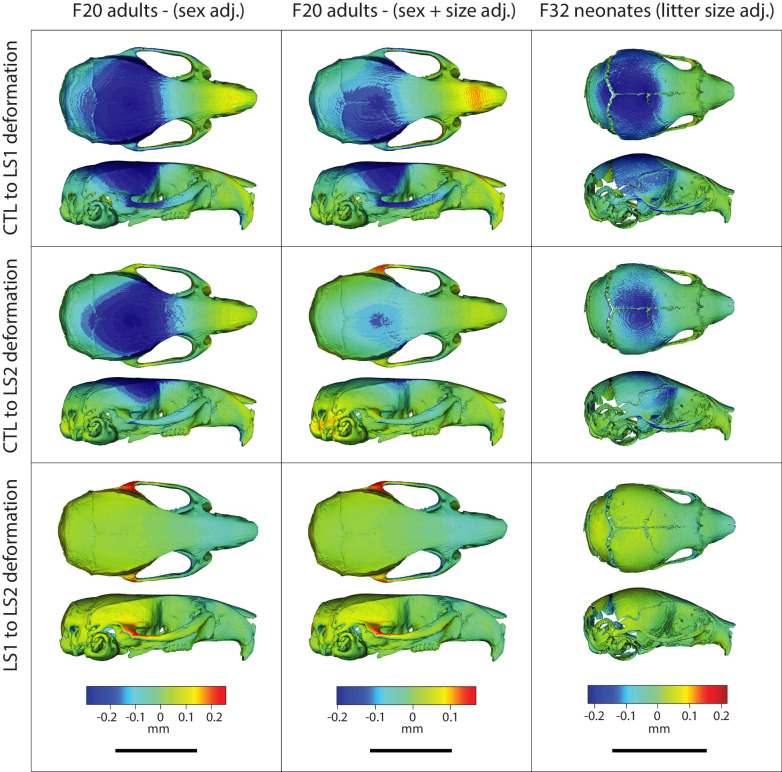
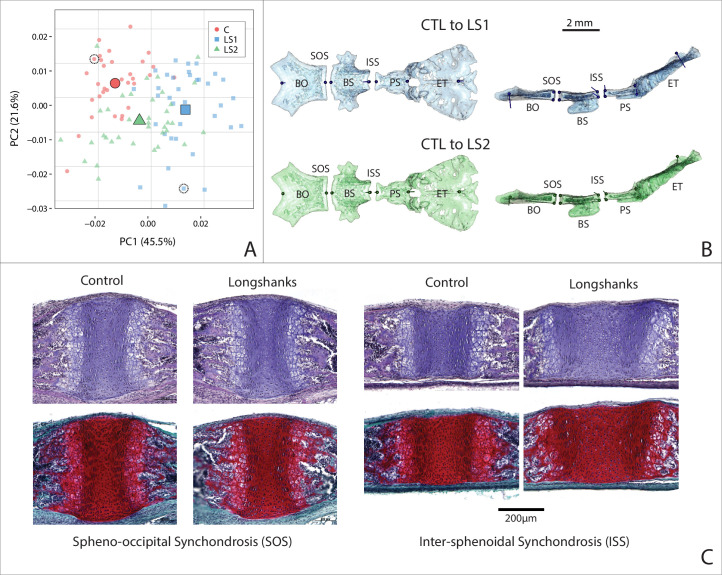
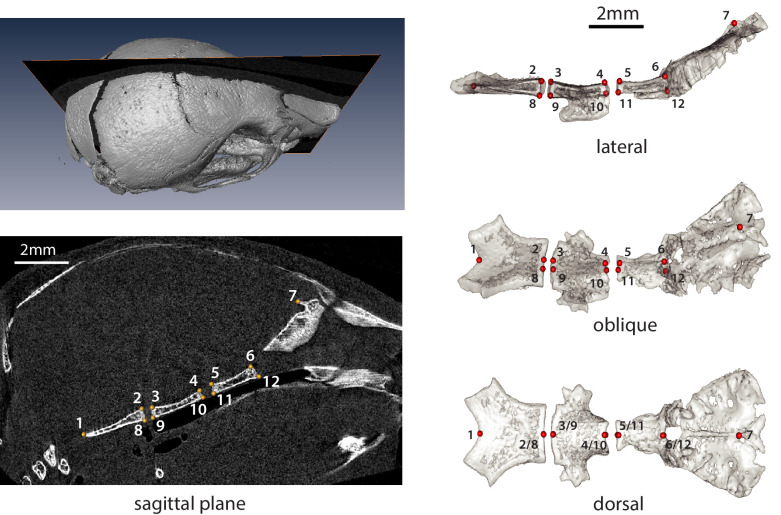
Bones in the vertebrate cranial base and limb skeleton grow by endochondral ossification, under the control of growth plates. Mechanisms of endochondral ossification are conserved across growth plates, which increases covariation in size and shape among bones, and in turn may lead to correlated changes in skeletal traits not under direct selection. We used micro-CT and geometric morphometrics to characterize shape changes in the cranium of the Longshanks mouse, which was selectively bred for longer tibiae. We show that Longshanks skulls became longer, flatter, and narrower in a stepwise process. Moreover, we show that these morphological changes likely resulted from developmental changes in the growth plates of the Longshanks cranial base, mirroring changes observed in its tibia. Thus, indirect and non-adaptive morphological changes can occur due to developmental overlap among distant skeletal elements, with important implications for interpreting the evolutionary history of vertebrate skeletal form.
Keywords: Longshanks mouse; correlated evolution; cranial shape; developmental biology; endochondral ossification; evolutionary biology; geometric morphometrics; mouse.
© 2021, Unger et al.
Conflict of interest statement
CU, JD, BH, CR No competing interests declared
Figures
Similar articles
-
Changes in shape and cross-sectional geometry in the tibia of mice selectively bred for increases in relative bone length.J Anat. 2016 Jun;228(6):940-51. doi: 10.1111/joa.12459. Epub 2016 Mar 22. J Anat. 2016. PMID: 27003624 Free PMC article.
-
Selection for longer limbs in mice increases bone stiffness and brittleness, but does not alter bending strength.J Exp Biol. 2019 May 10;222(Pt 9):jeb203125. doi: 10.1242/jeb.203125. J Exp Biol. 2019. PMID: 31043455
-
Endochondral ossification and the evolution of limb proportions.Wiley Interdiscip Rev Dev Biol. 2020 Jul;9(4):e373. doi: 10.1002/wdev.373. Epub 2020 Jan 29. Wiley Interdiscip Rev Dev Biol. 2020. PMID: 31997553 Review.
-
Pervasive genetic integration directs the evolution of human skull shape.Evolution. 2012 Apr;66(4):1010-23. doi: 10.1111/j.1558-5646.2011.01496.x. Epub 2011 Nov 21. Evolution. 2012. PMID: 22486686
-
Developmental Regulation of the Growth Plate and Cranial Synchondrosis.J Dent Res. 2016 Oct;95(11):1221-9. doi: 10.1177/0022034516651823. Epub 2016 Jun 1. J Dent Res. 2016. PMID: 27250655 Free PMC article. Review.
Cited by
-
Comparative Cranial Geometric Morphometrics among Wistar Albino, Sprague Dawley, and WAG/Rij Rat Strains.Animals (Basel). 2024 Apr 24;14(9):1274. doi: 10.3390/ani14091274. Animals (Basel). 2024. PMID: 38731278 Free PMC article.
-
Life History Traits of Sperm Whales Physeter macrocephalus Linnaeus, 1758 Stranded along Italian Coasts (Cetartiodactyla: Physeteridae).Animals (Basel). 2022 Dec 25;13(1):79. doi: 10.3390/ani13010079. Animals (Basel). 2022. PMID: 36611689 Free PMC article.
-
N-cadherin and β1 integrin coordinately regulate growth plate cartilage architecture.Mol Biol Cell. 2024 Apr 1;35(4):ar49. doi: 10.1091/mbc.E23-03-0101. Epub 2024 Jan 31. Mol Biol Cell. 2024. PMID: 38294852 Free PMC article.
-
MusMorph, a database of standardized mouse morphology data for morphometric meta-analyses.Sci Data. 2022 May 25;9(1):230. doi: 10.1038/s41597-022-01338-x. Sci Data. 2022. PMID: 35614082 Free PMC article.
-
A gene desert required for regulatory control of pleiotropic Shox2 expression and embryonic survival.Nat Commun. 2024 Oct 10;15(1):8793. doi: 10.1038/s41467-024-53009-7. Nat Commun. 2024. PMID: 39389973 Free PMC article.
References
-
- Adams D, Collyer M, Kaliontzopoulou A. Geomorph: Software for Geometric Morphometric Analyses. 2020 https://cran.r-project.org/package=geomorph
-
- Armbruster WS, Schwaegerle KE. Causes of covariation of phenotypic traits among populations. Journal of Evolutionary Biology. 1996;9:261–276. doi: 10.1046/j.1420-9101.1996.9030261.x. - DOI
Publication types
MeSH terms
LinkOut - more resources
Full Text Sources
Other Literature Sources
Molecular Biology Databases
