Associations between T cell infiltration, T cell receptor clonality, histology and recurrence in renal cell carcinoma
- PMID: 33899933
- PMCID: PMC8274198
- DOI: 10.1111/cei.13608
Associations between T cell infiltration, T cell receptor clonality, histology and recurrence in renal cell carcinoma
Abstract
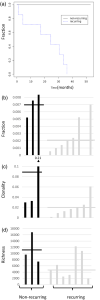
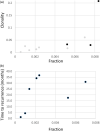
Renal cell carcinoma (RCC) is comprised of clear-cell (ccRCC) and non-clear-cell (nccRCC) tumors. Despite definitive surgical resection in localized disease, recurrence often occurs. A commercial method based on a multiplex polymerase chain reaction (PCR) assay exclusively targets rearranged T cell receptor (TCR) genes to generate high-throughput sequencing-based data, allowing characterization of the immune repertoire within tumors. In this study we performed a retrospective analysis on archived tumor samples from patients with recurring versus non-recurring T3 ccRCC and on samples from early nccRCC versus ccRCC. Following genomic DNA extraction and multiplex PCR, the fraction of T cells within tumors, the number of unique receptors ('richness') and their relative abundances ('clonality') were calculated. Statistical significance and correlations were calculated using Student's t-test and Spearman's rho, respectively. Average fraction and clonality of T cells in tumors from non-recurring patients was 2.5- and 4.3-fold higher than in recurring patients (P = 0.025 and P = 0.043, respectively). A significant positive correlation was found between T cell fraction and clonality (Spearman's rho = 0.78, P = 0.008). The average fraction of T cells in ccRCC tumors was 2.8-fold higher than in nccRCC tumors (P = 0.015). Clonality and estimated richness were similar between ccRCC and nccRCC tumors. In summary, recurrence of ccRCC is associated with a lower fraction and clonality of T cells within tumors; nccRCC tumors are more 'deserted' than ccRCC, but similar in their ability to generate a clonal T cell repertoire. Our work suggests associations between the characteristics of T cell infiltrate, histology and tumor recurrence.
Keywords: RCC; TCR; TIL; clonality; repertoire.
© 2021 British Society for Immunology.
Conflict of interest statement
None of the authors have any relevant potential conflicts of interest.
Figures


References
Publication types
MeSH terms
Substances
LinkOut - more resources
Full Text Sources
Other Literature Sources
Medical

