. 2021 May 7;20(5):2964-2972.
doi: 10.1021/acs.jproteome.1c00168. Epub 2021 Apr 26.

TMTpro-18plex: The Expanded and Complete Set of TMTpro Reagents for Sample Multiplexing

Affiliations

TMTpro-18plex: The Expanded and Complete Set of TMTpro Reagents for Sample Multiplexing

Jiaming Li et al. J Proteome Res. .

Abstract

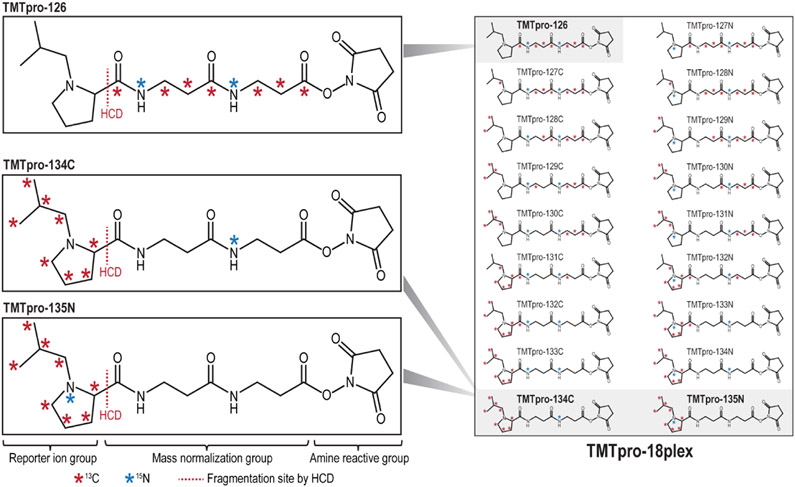
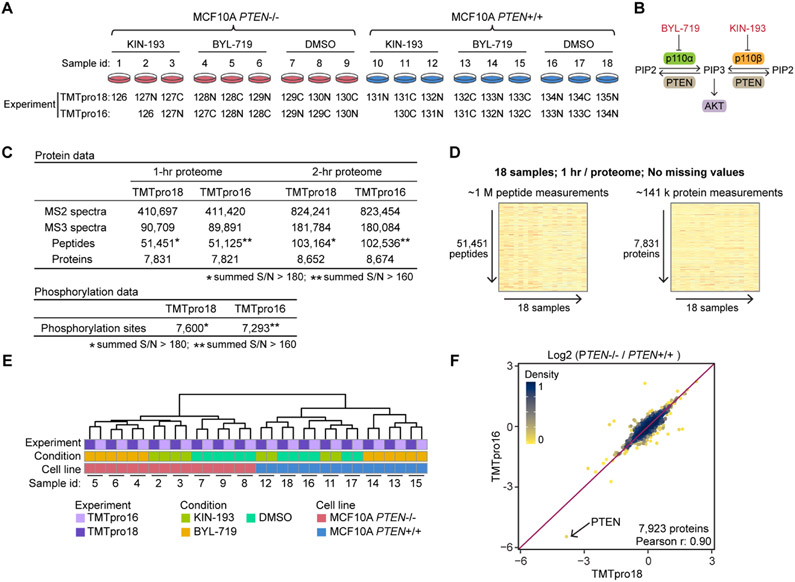
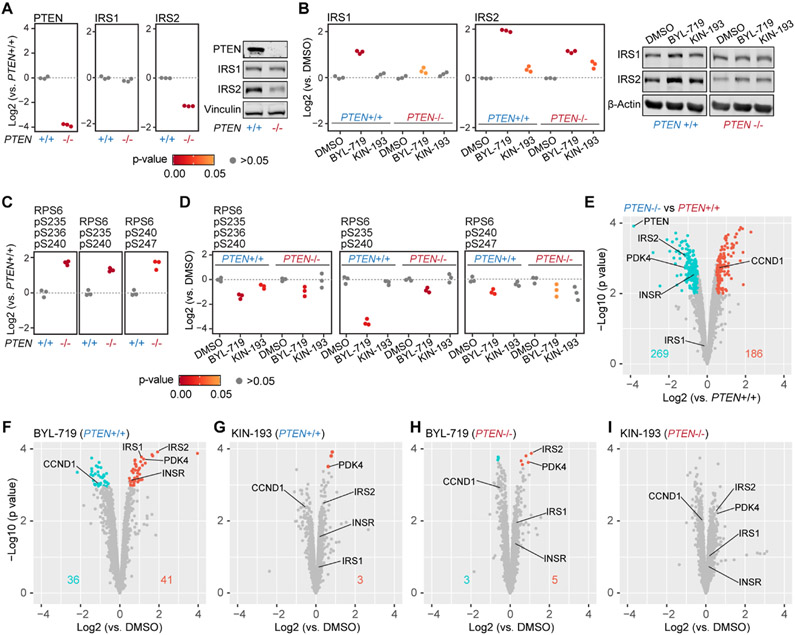
The development of the TMTpro-16plex series expanded the breadth of commercial isobaric tagging reagents by nearly 50% over classic TMT-11plex. In addition to the described 16plex reagents, the proline-based TMTpro molecule can accommodate two additional combinations of heavy carbon and nitrogen isotopes. Here, we introduce the final two labeling reagents, TMTpro-134C and TMTpro-135N, which permit the simultaneous global protein profiling of 18 samples with essentially no missing values. For example, six conditions with three biological replicates can now be perfectly accommodated. We showcase the 18plex reagent set by profiling the proteome and phosphoproteome of a pair of isogenic mammary epithelial cell lines under three conditions in triplicate. We compare the depth and quantitative performance of this data set with a TMTpro-16plex experiment in which two samples were omitted. Our analysis revealed similar numbers of quantified peptides and proteins, with high quantitative correlation. We interrogated further the TMTpro-18plex data set by highlighting changes in protein abundance profiles under different conditions in the isogenic cell lines. We conclude that TMTpro-18plex further expands the sample multiplexing landscape, allowing for complex and innovative experimental designs.

Keywords: 18plex; BYL-719; KIN-193; MCF10A; PTEN; TMTpro; eclipse; real-time search.


Figures

Figure 1.
Figure 1.
Chemical structures and heavy isotope positions of the TMTpro-134C and TMTpro-135N reagents. The full set of TMTpro-18plex reagents is shown on the right. The TMTpro-134C and TMTpro-135N reagents have the same chemical structure as isobaric TMTpro-16plex reagents (TMTpro-126 is shown as an example). However, the two new reagents differ from the TMTpro-16plex reagents in the number of 13C and 15N atoms. The TMTpro-16plex reagents incorporate seven 13C and two 15N atoms, while the two additional reagents incorporate eight 13C and only one 15N atoms that are distributed across the reporter ion and mass normalization region of each reagent. This arrangement enables the complete utilization of the positions in the reporter ion group, creating the 17th and 18th channels in the TMTpro-18plex reagent set.
Figure 2.
Figure 2.
TMTpro-18plex reagents facilitate proteome analysis at an effective rate of 1 h per proteome. (A) Set of 18 samples of drug-treated control MCF10A and MCF10A PTEN−/− cell lines was used to benchmark the TMTpro-18plex reagents. The cell lines were treated with a PI3K inhibitor (BYL-719 or KIN-193) or DMSO, in biological triplicate (n = 3). Samples were prepared following the SL-TMT protocol using 50 μg protein and labeling with either the full 18 reagents or only 16 reagents as indicated. Peptides were fractionated and then concatenated into 24 “super” fractions. Fractionated samples were analyzed with FAIMS and real-time search-synchronous-precursor-selection-MS3 on an Orbitrap Eclipse mass spectrometer. An equal amount of fractionated peptide was analyzed in both experiments. (B) PI3K overview. KIN-193 and BYL-719 inhibit the kinases p110α and p110β, respectively. p110α and p110β are catalytic subunits of PI3K. PI3K-mediated PIP3 production leads to the activation of the downstream AKT/mTOR pathway. (C) Data set overview. Analysis of 12 fractions (1 h per proteome) or 24 fractions (2 h per proteome) yielded ~7.8k and ~8.6k quantified proteins in both experiments, respectively. A total amount of 900 and 800 μg of peptide was used to enrich phosphorylated peptides in the 18- and 16-plex experiments, respectively. The numbers of localized and quantified phosphorylation sites are reported (AScore > 13). (D) 1 h human cell line proteome. The TMTpro-18plex reagents facilitated the collection of a 1 h per proteome analysis that included ~1 million peptide measurements and ~141,000 protein measurements across 18 samples without missing values. (E) HCA of the protein data; (F) log 2 protein fold changes between the two cell lines treated with DMSO in both experiments showed good agreement.
Figure 3.
Figure 3.
Overview of alterations in protein abundance and phosphorylation levels in control and PTEN−/− cells upon treatment with two PI3K inhibitors. (A) Absence of PTEN and down-regulation of IRS2 in MCF10A PTEN−/− cells, and the equivalent expression level of IRS1 in both cell lines were recapitulated by the mass spectrometry data. Welch’s t-test p-values are shown as different colored dots to provide an estimate of the significance. (B) IRS1 and IRS2 were upregulated after BYL-719 treatment in both cell lines. IRS2 was also up-regulated under KIN-193 treatment in both cell lines. (C,D) Two doubly-phosphorylated RPS6 peptides and one triply phosphorylated RPS6 peptide were quantified. These phosphorylation events were upregulated in MCF10A PTEN−/− cells and were inhibited by BYL-719 and KIN-193 to a different extent in both cell lines. (E) Volcano plot showing protein expression level differences between control and PTEN−/− cells. SAM was used to evaluate up- or down-regulated proteins. Negative log 10-transformed estimated p-values for each protein from the SAM analysis are shown on the y-axis. Significant proteins were filtered at 1% FDR and a minimum of 40% change. Numbers on the plot indicate significantly up-regulated (red) and down-regulated (cyan) proteins in MCF10A PTEN−/− cells. (F–I) Volcano plots showing the protein level comparison between DMSO and 24 h drug treatment in both cell lines. Numbers on the plot indicate significantly up-regulated (red) and down-regulated (cyan) proteins. Inhibition of p110β by KIN-193 caused only minor protein perturbations compared with the inhibition of p110α by BYL-719 in both cell lines. PTEN knockout conferred p110α inhibitor BYL-719 resistance, as protein level changes by BYL-719 were not changed in the PTEN knockout.

References

    1. Rauniyar N; Yates JR 3rd Isobaric labeling-based relative quantification in shotgun proteomics. J. Proteome Res 2014, 13, 5293–5309. - PMC - PubMed
    1. Li J; Van Vranken JG; Pontano Vaites L; Schweppe DK; Huttlin EL; Etienne C; Nandhikonda P; Viner R; Robitaille AM; Thompson AH; Kuhn K; Pike I; Bomgarden RD; Rogers JC; Gygi SP; Paulo JA TMTpro reagents: a set of isobaric labeling mass tags enables simultaneous proteome-wide measurements across 16 samples. Nat. Methods 2020, 17, 399–404. - PMC - PubMed
    1. Thompson A; Wölmer N; Koncarevic S; Selzer S; Böhm G; Legner H; Schmid P; Kienle S; Penning P; Höhle C; Berfelde A; Martinez-Pinna R; Farztdinov V; Jung S; Kuhn K; Pike I TMTpro: Design, Synthesis, and Initial Evaluation of a Proline-Based Isobaric 16-Plex Tandem Mass Tag Reagent Set. Anal. Chem 2019, 91, 15941–15950. - PubMed
    1. Chu EC; Tarnawski AS PTEN regulatory functions in tumor suppression and cell biology. Med. Sci. Monit 2004, 10, Ra235–41. - PubMed
    1. Simpson L; Parsons R PTEN: life as a tumor suppressor. Exp. Cell Res 2001, 264, 29–41. - PubMed

Publication types

LinkOut - more resources