

SARS-CoV-2 in Nursing Homes after 3 Months of Serial, Facilitywide Point Prevalence Testing, Connecticut, USA
- PMID: 33900171
- PMCID: PMC8084507
- DOI: 10.3201/eid2705.204936
SARS-CoV-2 in Nursing Homes after 3 Months of Serial, Facilitywide Point Prevalence Testing, Connecticut, USA
Abstract
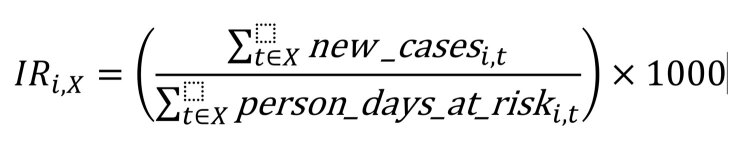
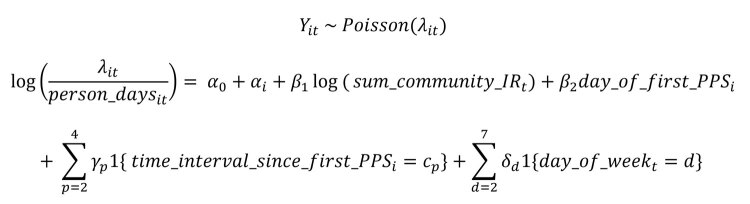
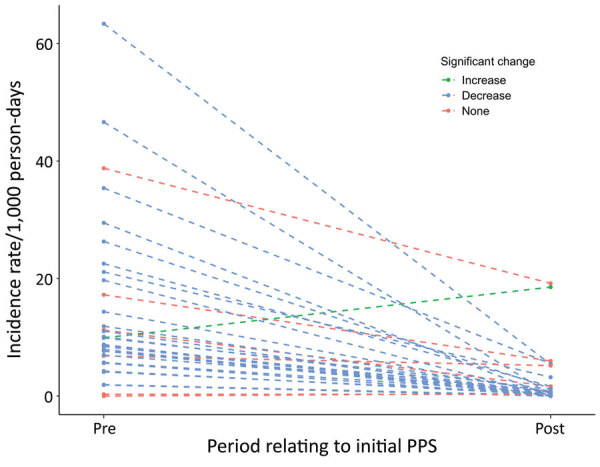
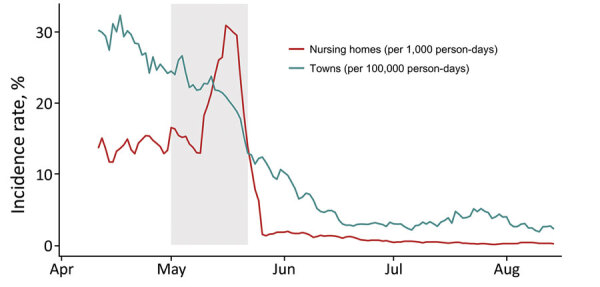
Nursing homes house populations that are highly vulnerable to coronavirus disease. Point prevalence surveys (PPSs) provide information on the severe acute respiratory syndrome coronavirus 2 infection status of staff and residents in nursing homes and enable isolation of infectious persons to halt disease spread. We collected 16 weeks of public health surveillance data on a subset of nursing homes (34/212) in Connecticut, USA. We fit a Poisson regression model to evaluate the association between incidence and time since serial PPS onset, adjusting for decreasing community incidence and other factors. Nursing homes conducted a combined total of 205 PPSs in staff and 232 PPSs in residents. PPS was associated with 41%-80% reduction in incidence rate in nursing homes. Our findings provide support for the use of repeated PPSs in nursing home staff and residents, combined with strong infection prevention measures such as cohorting, in contributing to outbreak control.
Keywords: COVID-19; Connecticut; RT-PCR; SARS-CoV-2; United States; coronavirus disease; diagnostics; epidemiology; long-term care facility; nursing home; outbreak; prevalence; respiratory infections; severe acute respiratory syndrome coronavirus 2; universal testing; viruses; zoonoses.
Figures

Similar articles
-
Implementation of a national testing policy in Dutch nursing homes during SARS-CoV-2 outbreaks.J Am Geriatr Soc. 2022 Apr;70(4):940-949. doi: 10.1111/jgs.17687. Epub 2022 Feb 4. J Am Geriatr Soc. 2022. PMID: 35080774 Free PMC article.
-
Severe Acute Respiratory Syndrome Coronavirus 2 (SARS-CoV-2) Delta Outbreak Among Fully Vaccinated Nursing Home Residents Likely Initiated by a Fully Vaccinated Staff Member - Connecticut, July-August 2021.Clin Infect Dis. 2022 Aug 24;75(1):e909-e911. doi: 10.1093/cid/ciab1025. Clin Infect Dis. 2022. PMID: 34893827 Free PMC article.
-
Estimation of Transmission of COVID-19 in Simulated Nursing Homes With Frequent Testing and Immunity-Based Staffing.JAMA Netw Open. 2021 May 3;4(5):e2110071. doi: 10.1001/jamanetworkopen.2021.10071. JAMA Netw Open. 2021. PMID: 33988707 Free PMC article.
-
COVID-19 in Nursing Homes: Calming the Perfect Storm.J Am Geriatr Soc. 2020 Oct;68(10):2153-2162. doi: 10.1111/jgs.16784. Epub 2020 Sep 2. J Am Geriatr Soc. 2020. PMID: 32735036 Review.
-
[COVID-19 outbreak in nursing homes: what can be learned from the literature about other disasters or crisis situations?].Tijdschr Gerontol Geriatr. 2020 Apr 23;51(3). doi: 10.36613/tgg.1875-6832/2020.03.01. Tijdschr Gerontol Geriatr. 2020. PMID: 32951401 Review. Dutch.
Cited by
-
Nursing Home Residents' COVID-19 Infections in the United States: A Systematic Review of Personal and Contextual Factors.Gerontol Geriatr Med. 2024 Feb 15;10:23337214241229824. doi: 10.1177/23337214241229824. eCollection 2024 Jan-Dec. Gerontol Geriatr Med. 2024. PMID: 38370579 Free PMC article.
-
Nurses' Experiences of Care in Portuguese Nursing Homes during the COVID-19 Pandemic: A Focus Group Study.Int J Environ Res Public Health. 2023 Aug 11;20(16):6563. doi: 10.3390/ijerph20166563. Int J Environ Res Public Health. 2023. PMID: 37623149 Free PMC article.
-
Implementation of a national testing policy in Dutch nursing homes during SARS-CoV-2 outbreaks.J Am Geriatr Soc. 2022 Apr;70(4):940-949. doi: 10.1111/jgs.17687. Epub 2022 Feb 4. J Am Geriatr Soc. 2022. PMID: 35080774 Free PMC article.
-
[COVID-19 in care homes: equity will be needed to avoid new catastrophes].Gac Sanit. 2022 Jan-Feb;36(1):3-5. doi: 10.1016/j.gaceta.2021.06.009. Epub 2021 Jul 21. Gac Sanit. 2022. PMID: 34400008 Free PMC article. Spanish. No abstract available.
-
Disease burden and high-risk populations for complications in patients with acute respiratory infections: a scoping review.Front Med (Lausanne). 2024 May 16;11:1325236. doi: 10.3389/fmed.2024.1325236. eCollection 2024. Front Med (Lausanne). 2024. PMID: 38818396 Free PMC article.
References
-
- Louie JK, Scott HM, DuBois A, Sturtz N, Lu W, Stoltey J, et al.; San Francisco Department of Public Health COVID-19 Skilled Nursing Facility Outbreak Response Team. Lessons from mass-testing for COVID-19 in long term-care facilities for the elderly in San Francisco. Clin Infect Dis. 2020;•••:ciaa1020. 10.1093/cid/ciaa1020 - DOI - PMC - PubMed
Publication types
MeSH terms
Grants and funding
LinkOut - more resources
Full Text Sources
Medical
Miscellaneous
