

Genomic Epidemiology of SARS-CoV-2 Infection During the Initial Pandemic Wave and Association With Disease Severity
- PMID: 33900399
- PMCID: PMC8076962
- DOI: 10.1001/jamanetworkopen.2021.7746
Genomic Epidemiology of SARS-CoV-2 Infection During the Initial Pandemic Wave and Association With Disease Severity
Abstract
Importance: Understanding of SARS-CoV-2 variants that alter disease outcomes are important for clinical risk stratification and may provide important clues to the complex virus-host relationship.
Objective: To examine the association of identified SARS-CoV-2 variants, virus clades, and clade groups with disease severity and patient outcomes.
Design, setting, and participants: In this cross-sectional study, viral genome analysis of clinical specimens obtained from patients at the Cleveland Clinic infected with SARS-CoV-2 during the initial wave of infection (March 11 to April 22, 2020) was performed. Identified variants were matched with clinical outcomes. Data analysis was performed from April to July 2020.
Main outcomes and measures: Hospitalization, intensive care unit (ICU) admission, mortality, and laboratory outcomes were matched with SARS-CoV-2 variants.
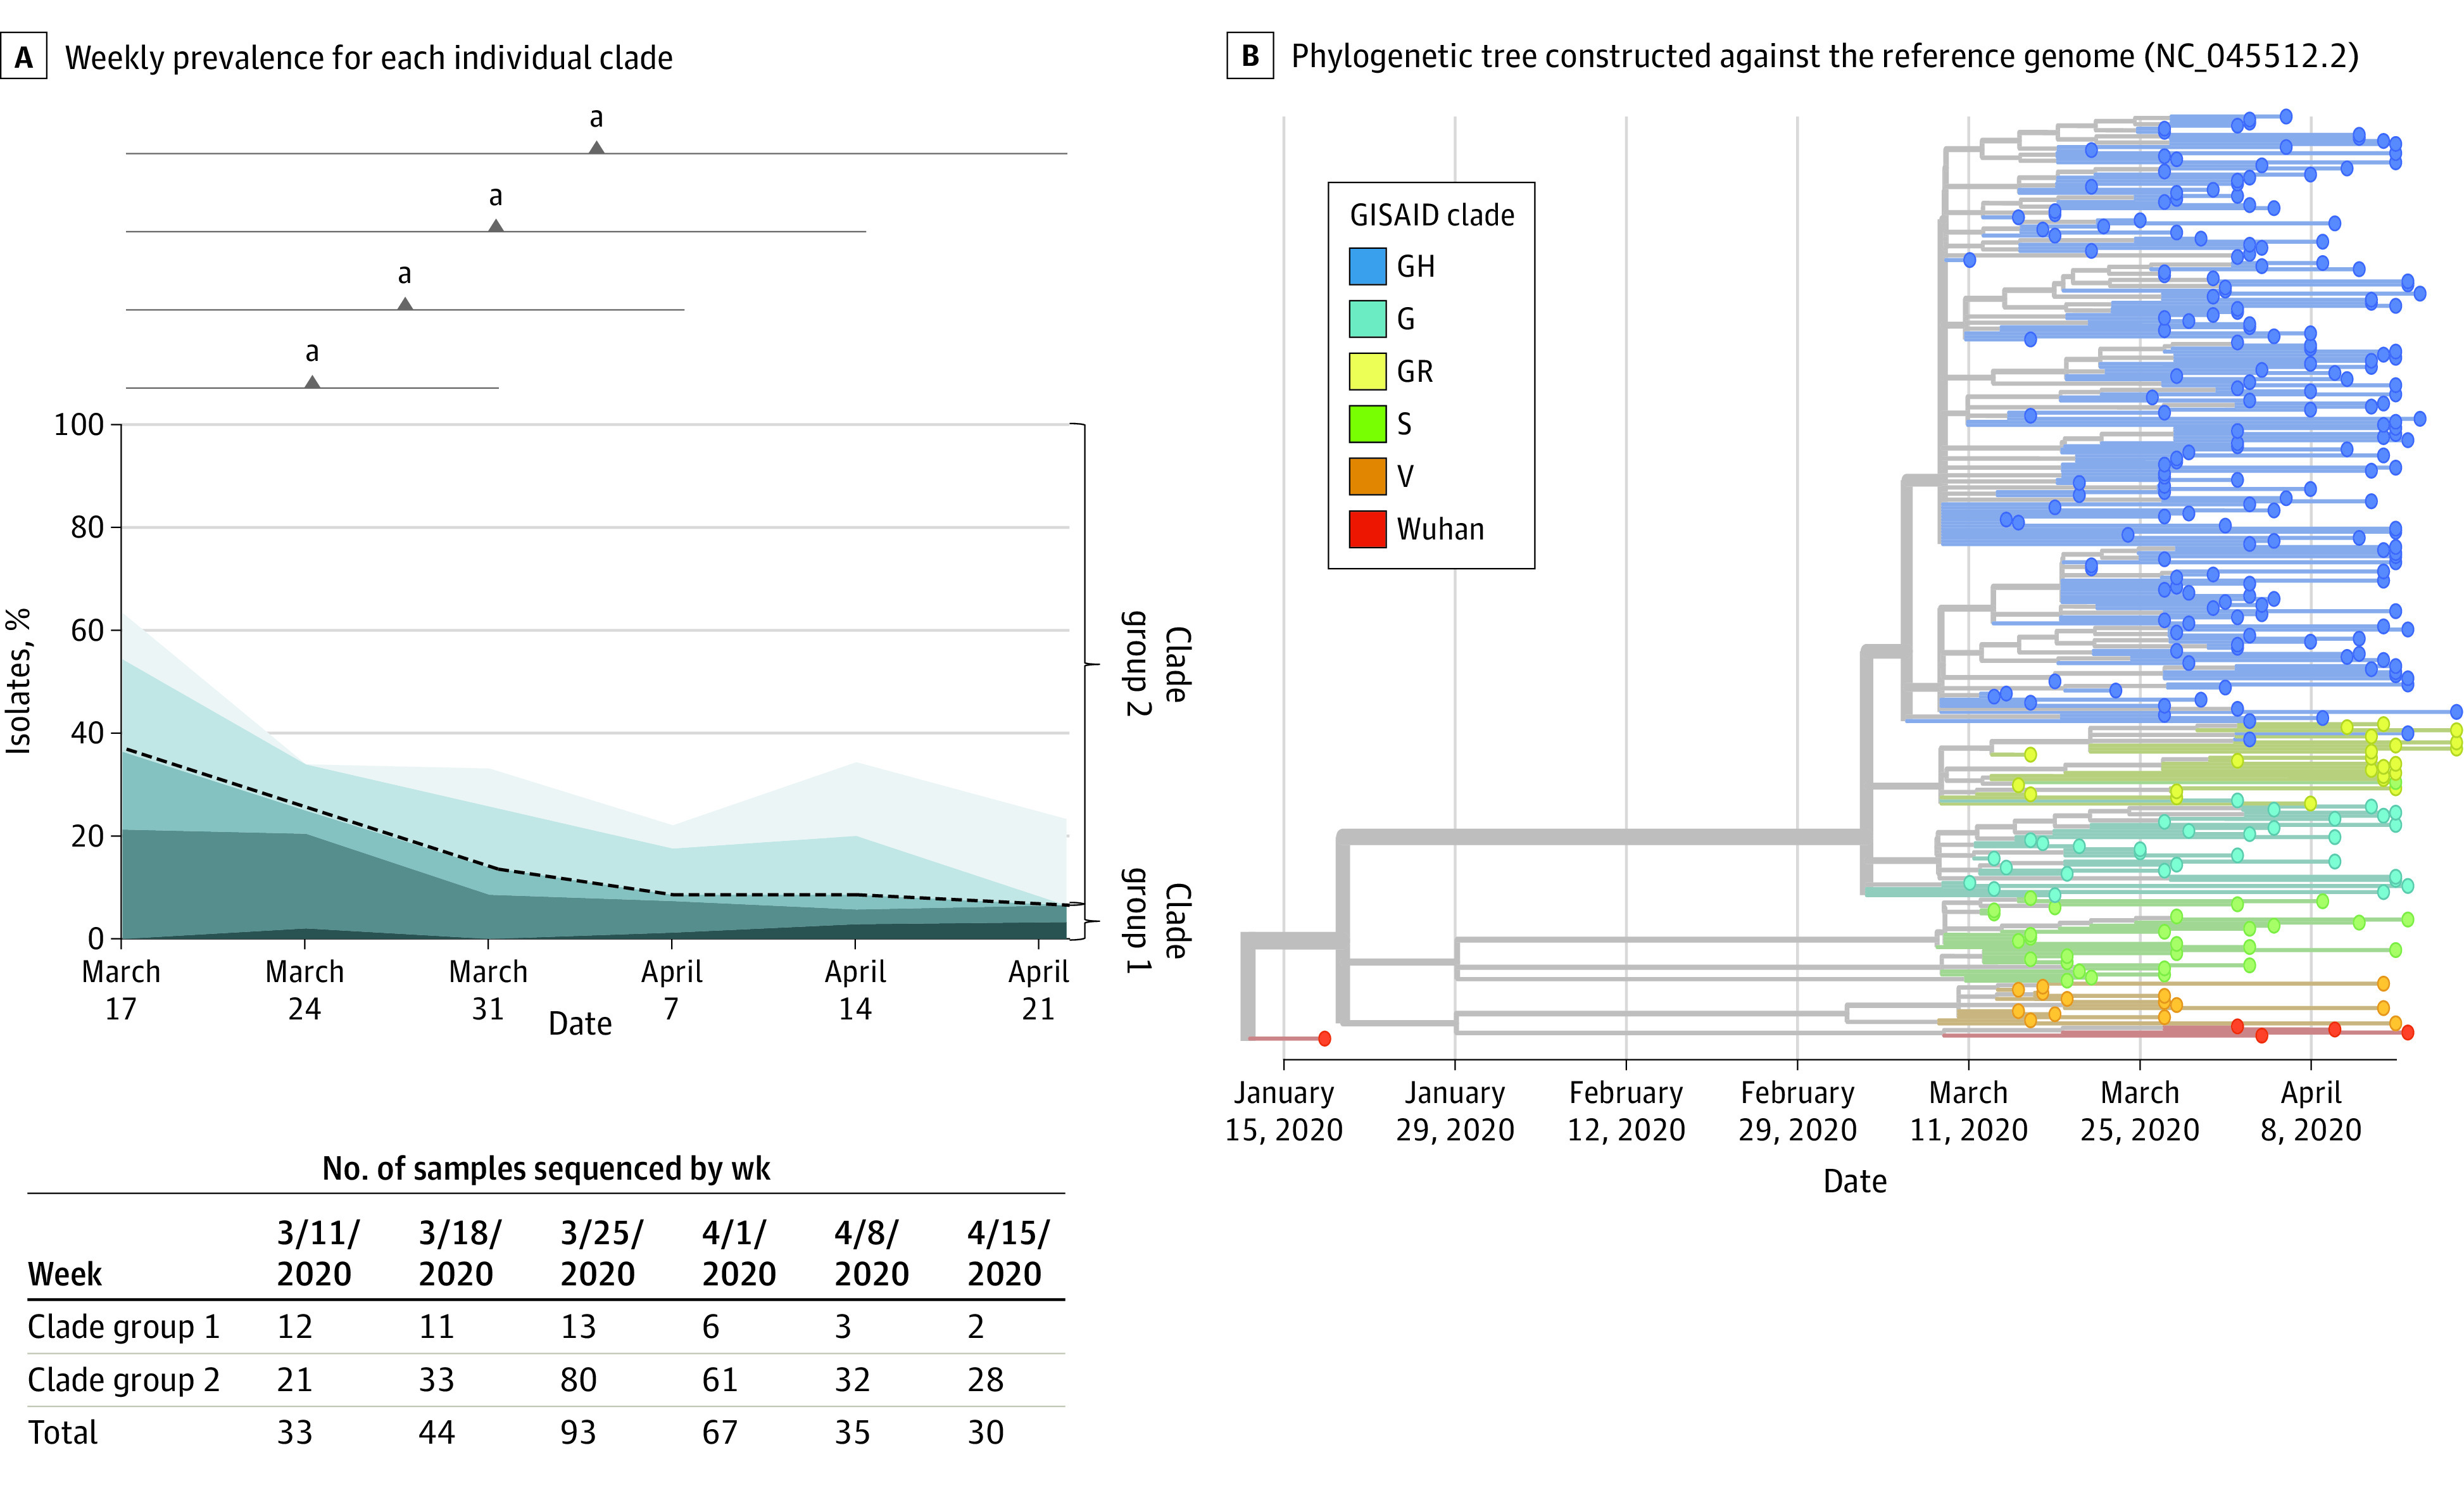
Results: Specimens sent for viral genome sequencing originated from 302 patients with SARS-CoV-2 infection (median [interquartile range] age, 52.6 [22.8 to 82.5] years), of whom 126 (41.7%) were male, 195 (64.6%) were White, 91 (30.1%) required hospitalization, 35 (11.6%) needed ICU admission, and 17 (5.6%) died. From these specimens, 2531 variants (484 of which were unique) were identified. Six different SARS-CoV-2 clades initially circulated followed by a rapid reduction in clade diversity. Several variants were associated with lower hospitalization rate, and those containing 23403A>G (D614G Spike) were associated with increased survival when the patient was hospitalized (64 of 74 patients [86.5%] vs 10 of 17 patients [58.8%]; χ21 = 6.907; P = .009). Hospitalization and ICU admission were similar regardless of clade. Infection with Clade V variants demonstrated higher creatinine levels (median [interquartile range], 2.6 [-0.4 to 5.5] mg/dL vs 1.0 [0.2 to 2.2] mg/dL; mean creatinine difference, 2.9 mg/dL [95% CI, 0.8 to 5.0 mg/dL]; Kruskal-Wallis P = .005) and higher overall mortality rates (3 of 14 patients [21.4%] vs 17 of 302 patients [5.6%]; χ21 = 5.640; P = .02) compared with other variants. Infection by strains lacking the 23403A>G variant showed higher mortality in multivariable analysis (odds ratio [OR], 22.4; 95% CI, 0.6 to 5.6; P = .01). Increased variants of open reading frame (ORF) 3a were associated with decreased hospitalization frequency (OR, 0.4; 95% CI, 0.2 to 0.96; P = .04), whereas increased variants of Spike (OR, 0.01; 95% CI, <0.01 to 0.3; P = .01) and ORF8 (OR, 0.03; 95% CI, <0.01 to 0.6; P = .03) were associated with increased survival.
Conclusions and relevance: Within weeks of SARS-CoV-2 circulation, a profound shift toward 23403A>G (D614G) specific genotypes occurred. Replaced clades were associated with worse clinical outcomes, including mortality. These findings help explain persistent hospitalization yet decreasing mortality as the pandemic progresses. SARS-CoV-2 clade assignment is an important factor that may aid in estimating patient outcomes.
Conflict of interest statement
Figures

References
-
- Centers for Disease Control and Prevention . COVID data tracker. Accessed November 20, 2020. https://covid.cdc.gov/covid-data-tracker/#trends_dailytrendscases
Publication types
MeSH terms
Grants and funding
LinkOut - more resources
Full Text Sources
Medical
Miscellaneous
