. 2021 Apr 1;4(4):e217737.
doi: 10.1001/jamanetworkopen.2021.7737.

Predictors of 30-Day Mortality Among Dutch Patients Undergoing Colorectal Cancer Surgery, 2011-2016

Affiliations

Predictors of 30-Day Mortality Among Dutch Patients Undergoing Colorectal Cancer Surgery, 2011-2016

Tom van den Bosch et al. JAMA Netw Open. .

Erratum in

  • Error in Byline.
    [No authors listed] [No authors listed] JAMA Netw Open. 2021 Aug 2;4(8):e2127694. doi: 10.1001/jamanetworkopen.2021.27694. JAMA Netw Open. 2021. PMID: 34410401 Free PMC article. No abstract available.

Abstract

Importance: Quality improvement programs for colorectal cancer surgery have been introduced with benchmarking based on quality indicators, such as mortality. Detailed (pre)operative characteristics may offer relevant information for proper case-mix correction.

Objective: To investigate the added value of machine learning to predict quality indicators for colorectal cancer surgery and identify previously unrecognized predictors of 30-day mortality based on a large, nationwide colorectal cancer registry that collected extensive data on comorbidities.

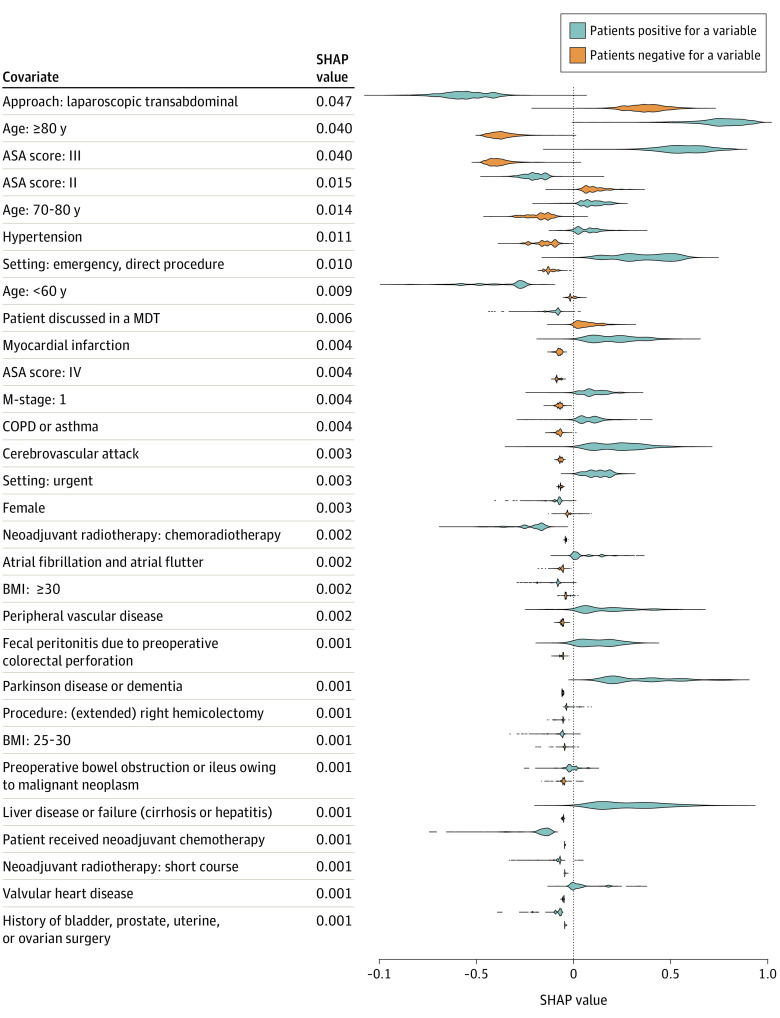
Design, setting, and participants: All patients who underwent resection for primary colorectal cancer registered in the Dutch ColoRectal Audit between January 1, 2011, and December 31, 2016, were included. Multiple machine learning models (multivariable logistic regression, elastic net regression, support vector machine, random forest, and gradient boosting) were made to predict quality indicators. Model performance was compared with conventionally used scores. Risk factors were identified by logistic regression analyses and Shapley additive explanations (ie, SHAP values). Statistical analysis was performed between March 1 and September 30, 2020.

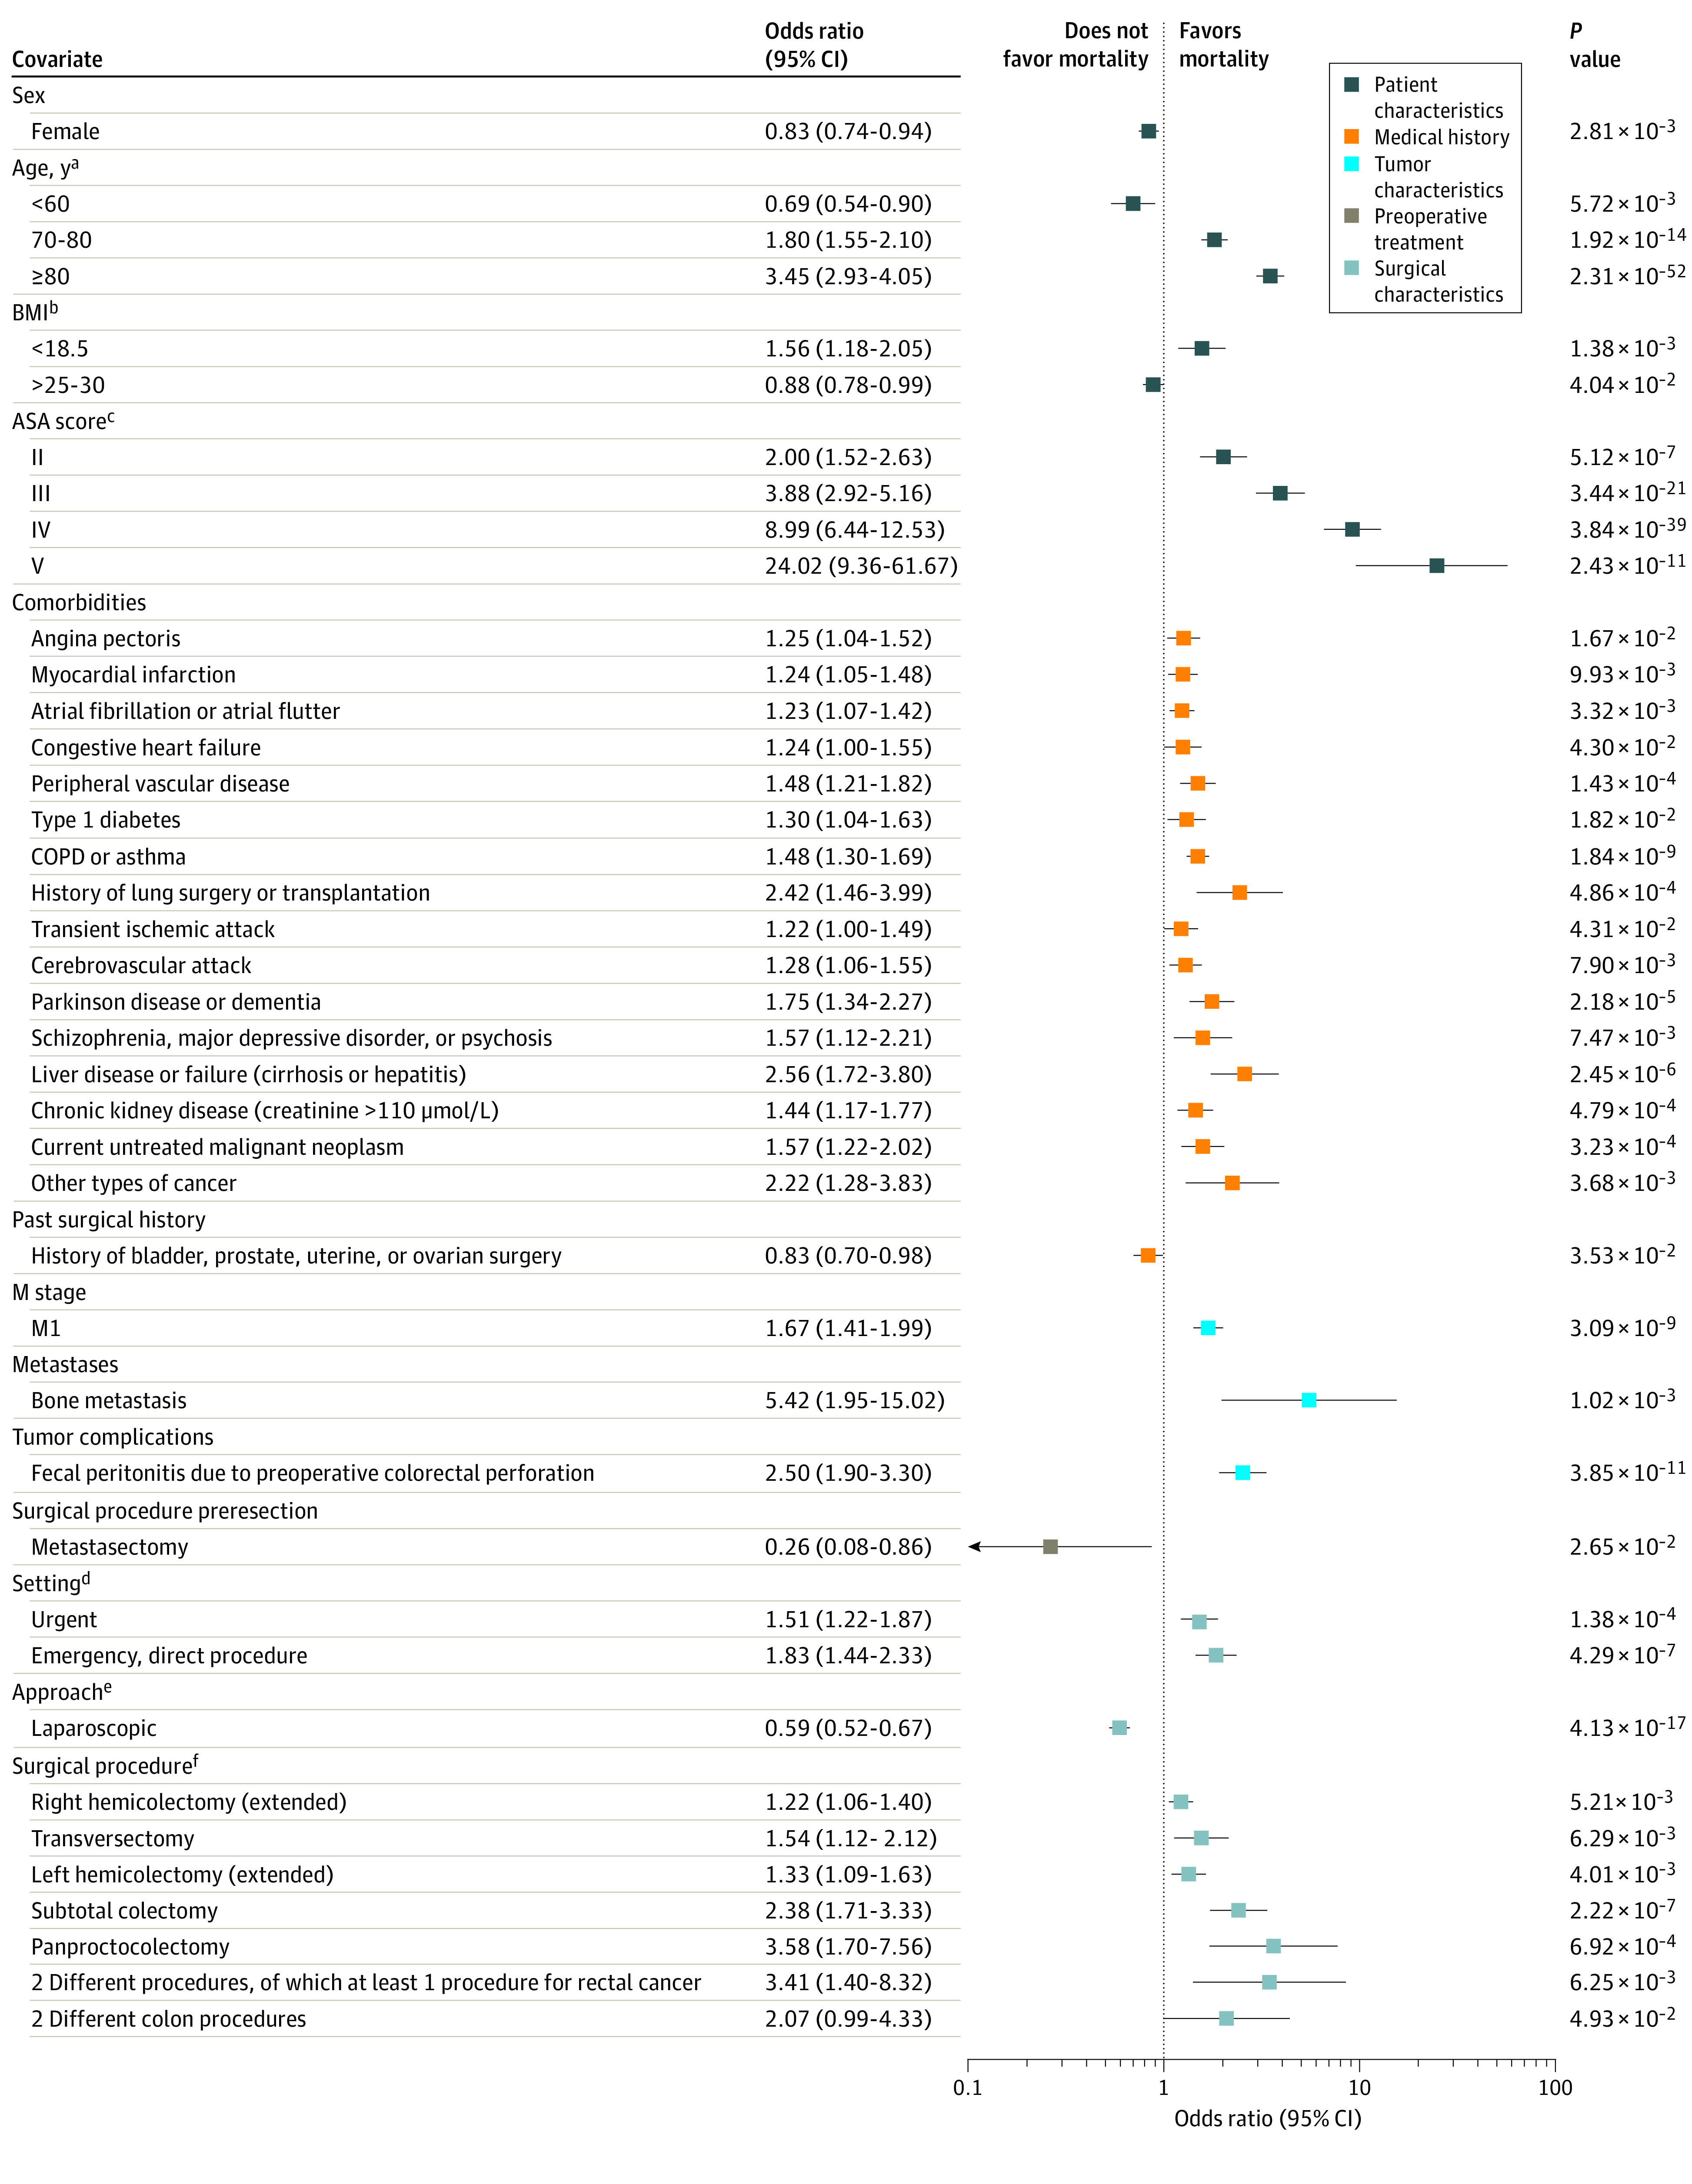
Main outcomes and measures: The primary outcome of this cohort study was 30-day mortality. Prediction models were trained on a training set by performing 5-fold cross-validation, and outcomes were measured by the area under the receiver operating characteristic curve on the test set. Machine learning was further used to identify risk factors, measured by odds ratios and SHAP values.

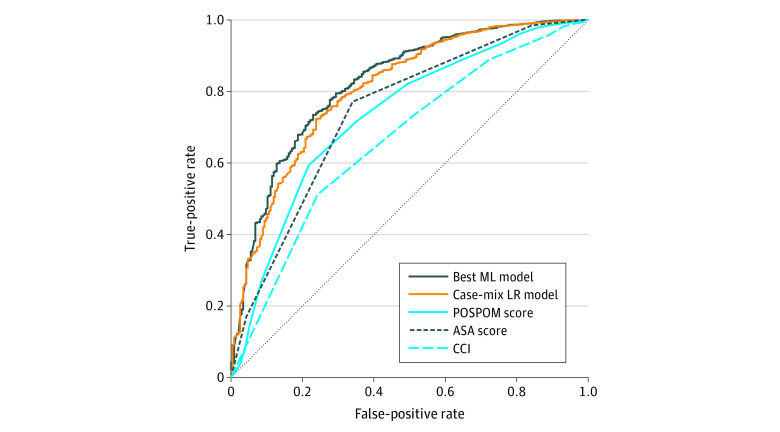
Results: This cohort study included 62 501 records, most patients were male (35 116 [56.2%]), were aged 61 to 80 years (41 560 [66.5%]), and had an American Society of Anesthesiology score of II (35 679 [57.1%]). A 30-day mortality rate of 2.7% (n = 1693) was found. The area under the curve of the best machine learning model for 30-day mortality (0.82; 95% CI, 0.79-0.85) was significantly higher than the American Society of Anesthesiology score (0.74; 95% CI, 0.71-0.77; P < .001), Charlson Comorbidity Index (0.66; 95% CI, 0.63-0.70; P < .001), and preoperative score to predict postoperative mortality (0.73; 95% CI, 0.70-0.77; P < .001). Hypertension, myocardial infarction, chronic obstructive pulmonary disease, and asthma were comorbidities with a high risk for increased mortality. Machine learning identified specific risk factors for a complicated course, intensive care unit admission, prolonged hospital stay, and readmission. Laparoscopic surgery was associated with a decreased risk for all adverse outcomes.

Conclusions and relevance: This study found that machine learning methods outperformed conventional scores to predict 30-day mortality after colorectal cancer surgery, identified specific patient groups at risk for adverse outcomes, and provided directions to optimize benchmarking in clinical audits.


Conflict of interest statement

Conflict of Interest Disclosures: Dr de Nerée tot Babberich reported being an employee of Pacmed outside the submitted work. Dr Geerts reported holding shares in Healthplus.ai BV and stock options in Sensulin LLC; serving as an unpaid advisor to Mode Sensors; and serving as a paid consultant for and receiving research grants from Edwards Lifesciences LLC, Philips NV, and NLC BV. Dr Tanis reported receiving grants from LifeCell and Allergan outside the submitted work. No other disclosures were reported.

Figures

Figure 1.
Figure 1.. Patient Inclusion Criteria
Figure 2.
Figure 2.. Receiver Operating Characteristic Plot for 30-Day Mortality
Accuracy of 30-day mortality prediction for the best performing machine learning (ML) model (elastic net regression), case-mix logistic regression (LR) model, the preoperative score to predict postoperative mortality (POSPOM), American Society of Anesthesiology (ASA) score, and Charlson Comorbidity Index (CCI).
Figure 3.
Figure 3.. Significant Predictors of 30-Day Mortality
Logistic regression model of 30-day mortality for 62 501 patients. All regression coefficients with P < .05 are translated to odds ratios. For categorical variables, references are shown on the right axis. To convert creatinine to mg/dL, divide by 88.4. BMI indicates body mass index (calculated as weight in kilograms divide by height in meters squared); COPD, chronic obstructive pulmonary disease. aReference, 60-70 years. bReference, 18.5-25. cReference, American Society of Anesthesiology (ASA) score I. dReference, elective setting. eReference, open approach. fReference, low anterior resection or sigmoid resection.
Figure 4.
Figure 4.. Variables That Demonstrated the Greatest Association With Prediction of 30-Day Mortality
Top 30 Shapley additive explanation (SHAP) feature values of the gradient-boosting model for prediction of 30-day mortality. SHAP values were calculated per variable for all patients in the test set. Distributions of SHAP values for patients are shown in blue (patients who are positive for a variable) and orange (patients who are negative for a variable). SHAP values were ranked by the mean of the absolute value across all patients in the test set. ASA indicates American Society of Anesthesiology; BMI, body mass index (calculated as weight in kilograms divided by height in meters squared); COPD, chronic obstructive pulmonary disease; and MDT, multidisciplinary team.

References

    1. Lemmens VEPP, Janssen-Heijnen MLG, Houterman S, et al. . Which comorbid conditions predict complications after surgery for colorectal cancer? World J Surg. 2007;31(1):192-199. doi:10.1007/s00268-005-0711-8 - DOI - PubMed
    1. Zoucas E, Lydrup ML. Hospital costs associated with surgical morbidity after elective colorectal procedures: a retrospective observational cohort study in 530 patients. Patient Saf Surg. 2014;8(1):2. doi:10.1186/1754-9493-8-2 - DOI - PMC - PubMed
    1. Vonlanthen R, Slankamenac K, Breitenstein S, et al. . The impact of complications on costs of major surgical procedures: a cost analysis of 1200 patients. Ann Surg. 2011;254(6):907-913. doi:10.1097/SLA.0b013e31821d4a43 - DOI - PubMed
    1. Govaert JA, Fiocco M, van Dijk WA, et al. ; Dutch Value Based Healthcare Study Group . Costs of complications after colorectal cancer surgery in the Netherlands: building the business case for hospitals. Eur J Surg Oncol. 2015;41(8):1059-1067. doi:10.1016/j.ejso.2015.03.236 - DOI - PubMed
    1. McNicol L, Story DA, Leslie K, et al. . Postoperative complications and mortality in older patients having non-cardiac surgery at three Melbourne teaching hospitals. Med J Aust. 2007;186(9):447-452. doi:10.5694/j.1326-5377.2007.tb00994.x - DOI - PubMed

Publication types

MeSH terms