. 2021 Jul;174(7):945-951.
doi: 10.7326/M21-0422. Epub 2021 Apr 27.

Performance Evaluation of Serial SARS-CoV-2 Rapid Antigen Testing During a Nursing Home Outbreak

Collaborators, Affiliations

Performance Evaluation of Serial SARS-CoV-2 Rapid Antigen Testing During a Nursing Home Outbreak

Susannah L McKay et al. Ann Intern Med. 2021 Jul.

Abstract

Background: To address high COVID-19 burden in U.S. nursing homes, rapid SARS-CoV-2 antigen tests have been widely distributed in those facilities. However, performance data are lacking, especially in asymptomatic people.

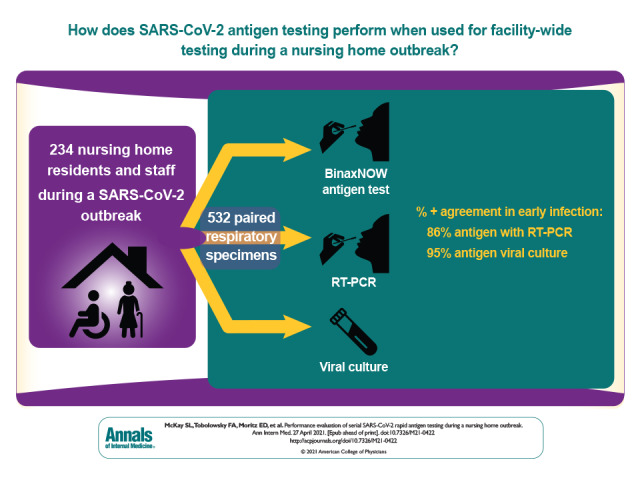
Objective: To evaluate the performance of SARS-CoV-2 antigen testing when used for facility-wide testing during a nursing home outbreak.

Design: A prospective evaluation involving 3 facility-wide rounds of testing where paired respiratory specimens were collected to evaluate the performance of the BinaxNOW antigen test compared with virus culture and real-time reverse transcription polymerase chain reaction (RT-PCR). Early and late infection were defined using changes in RT-PCR cycle threshold values and prior test results.

Setting: A nursing home with an ongoing SARS-CoV-2 outbreak.

Participants: 532 paired specimens collected from 234 available residents and staff.

Measurements: Percentage of positive agreement (PPA) and percentage of negative agreement (PNA) for BinaxNOW compared with RT-PCR and virus culture.

Results: BinaxNOW PPA with virus culture, used for detection of replication-competent virus, was 95%. However, the overall PPA of antigen testing with RT-PCR was 69%, and PNA was 98%. When only the first positive test result was analyzed for each participant, PPA of antigen testing with RT-PCR was 82% among 45 symptomatic people and 52% among 343 asymptomatic people. Compared with RT-PCR and virus culture, the BinaxNOW test performed well in early infection (86% and 95%, respectively) and poorly in late infection (51% and no recovered virus, respectively).

Limitation: Accurate symptom ascertainment was challenging in nursing home residents; test performance may not be representative of testing done by nonlaboratory staff.

Conclusion: Despite lower positive agreement compared with RT-PCR, antigen test positivity had higher agreement with shedding of replication-competent virus. These results suggest that antigen testing could be a useful tool to rapidly identify contagious people at risk for transmitting SARS-CoV-2 during nascent outbreaks and help reduce COVID-19 burden in nursing homes.

Primary funding source: None.


Conflict of interest statement

Disclosures: Disclosures can be viewed at www.acponline.org/authors/icmje/ConflictOfInterestForms.do?msNum=M21-0422.

Figures

Visual Abstract.
Visual Abstract.. Serial SARS-CoV-2 Rapid Antigen Testing During a Nursing Home Outbreak.
It has been hoped that rapid SARS-CoV-2 antigen testing could reduce the tragic toll of COVID-19 in nursing homes. The performance of the BinaxNOW antigen test in a nursing home during an ongoing SARS-CoV-2 outbreak was evaluated.
Figure 1.
Figure 1.. PPA and PNA between antigen test and RT-PCR and virus culture.
PNA = percentage of negative agreement; PPA = percentage of positive agreement; RT-PCR = reverse transcription polymerase chain reaction. Top. PPA and PNA between antigen test and reference standard RT-PCR for all paired specimens and paired specimens collected from people without a prior positive test result; those without a prior positive result were further stratified by symptomatic versus asymptomatic individuals. Detailed data for these PPA and PNA figures are provided in Appendix Table 2. Bars indicate 95% CIs. Bottom. PPA between antigen test and alternative reference standard virus culture for all paired specimens and paired specimens collected from people without a prior positive test result; those without a prior positive result were further stratified by symptomatic versus asymptomatic individuals. Bars indicate 95% CIs. Note: Virus culture was attempted only for RT-PCR–positive specimens with a cycle threshold value ≤34. Because specimens not likely to harbor infectious virus were not assessed for virus culturing, PNAs were not calculated. Detailed data for these PPA and PNA figures are provided in Appendix Table 6. Antigen test: BinaxNOW COVID-19 Ag Card.
Appendix Figure.
Appendix Figure.. Agreement between antigen testing and RT-PCR and VC among 101 paired specimens with VC result, over time.
Ag, RT-PCR, and VC results for 101 specimens from 63 individuals. VC was attempted for specimens that were Ag-positive and RT-PCR–negative (circle with X) but not attempted for RT-PCR–positive specimens with Ct values ≥35 (black squares). Ag = antigen; Ct = cycle threshold; RT-PCR = reverse transcription polymerase chain reaction; VC = virus culture.
Figure 2.
Figure 2.. Antigen test result, by SARS-CoV-2 nucleocapsid Ct values and virus culture result.
Ct values of all RT-PCR–positive respiratory specimens (n = 105). Shown are nucleocapsid Ct values for all paired RT-PCR–positive specimens stratified by antigen-positive and antigen-negative results and further by virus culture results. Median Ct for each category of antigen results is noted by the black bar. Virus culture was attempted for all RT-PCR–positive specimens with Ct ≤34. Culture was attempted for 8 additional specimens that were antigen-positive and RT-PCR–negative; all were culture-negative. Randomized jitter of 0.5 was added to x-axis values to improve visibility. Antigen test: BinaxNOW COVID-19 Ag Card. Ct = cycle threshold; RT-PCR = reverse transcription polymerase chain reaction.
Figure 3.
Figure 3.. Antigen test result during early and late infection, by SARS-CoV-2 nucleocapsid Ct values and virus culture result.
Shown are nucleocapsid Ct values for all paired RT-PCR–positive specimens with evidence of early (n = 56) or late (n = 47) infection by antigen and virus culture results. Median Ct for each category of antigen results is noted by the black bar. Virus culture was attempted for all RT-PCR–positive specimens with Ct ≤34. Culture was attempted for an additional 6 late-infection and 2 unknown-stage specimens that were antigen-positive and RT-PCR–negative; all were culture-negative. Randomized jitter of 0.5 was added to x-axis values to improve visibility. Antigen test: BinaxNOW COVID-19 Ag Card. Ct = cycle threshold; RT-PCR = reverse transcription polymerase chain reaction.

Comment in

References

    1. Centers for Medicare & Medicaid Services. COVID-19 nursing home data. 2020. Accessed at https://data.cms.gov/stories/s/COVID-19-Nursing-Home-Data/bkwz-xpvg on 10 January 2021.
    1. Shi SM , Bakaev I , Chen H , et al. Risk factors, presentation, and course of coronavirus disease 2019 in a large, academic long-term care facility. J Am Med Dir Assoc. 2020;21:1378-1383.e1. [PMID: 32981664] doi:10.1016/j.jamda.2020.08.027 - DOI - PMC - PubMed
    1. Arons MM , Hatfield KM , Reddy SC , et al. Presymptomatic SARS-CoV-2 infections and transmission in a skilled nursing facility. N Engl J Med. 2020;382:2081-2090. [PMID: 32329971] doi:10.1056/NEJMoa2008457 - DOI - PMC - PubMed
    1. CDC. SARS-CoV-2 antigen testing in long term care facilities. Updated 7 January 2020. Accessed at www.cdc.gov/coronavirus/2019-ncov/hcp/nursing-homes-antigen-testing.html on 10 January 2021.
    1. McGarry BE , SteelFisher GK , Grabowski DC , et al. COVID-19 test result turnaround time for residents and staff in US nursing homes. JAMA Intern Med. 2020. [PMID: 33125044] doi:10.1001/jamainternmed.2020.7330 - DOI - PMC - PubMed

Substances