. 2021 Apr 26;15(4):e0008821.
doi: 10.1371/journal.pntd.0008821. eCollection 2021 Apr.

How geographic access to care shapes disease burden: The current impact of post-exposure prophylaxis and potential for expanded access to prevent human rabies deaths in Madagascar

Affiliations

How geographic access to care shapes disease burden: The current impact of post-exposure prophylaxis and potential for expanded access to prevent human rabies deaths in Madagascar

Malavika Rajeev et al. PLoS Negl Trop Dis. .

Abstract

Background: Post-exposure prophylaxis (PEP) is highly effective at preventing human rabies deaths, however access to PEP is limited in many rabies endemic countries. The 2018 decision by Gavi to add human rabies vaccine to its investment portfolio should expand PEP availability and reduce rabies deaths. We explore how geographic access to PEP impacts the rabies burden in Madagascar and the potential benefits of improved provisioning.

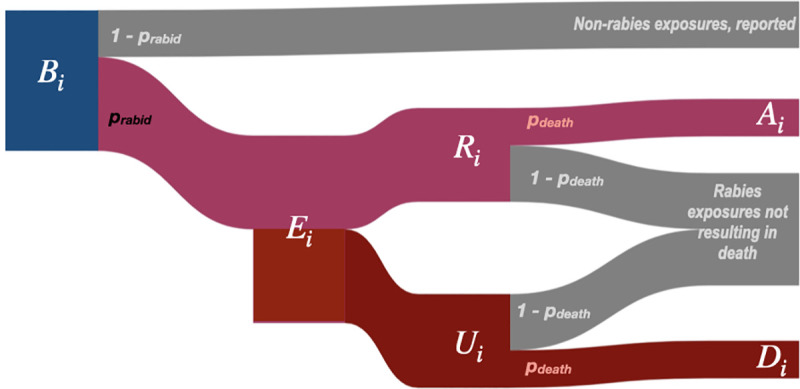
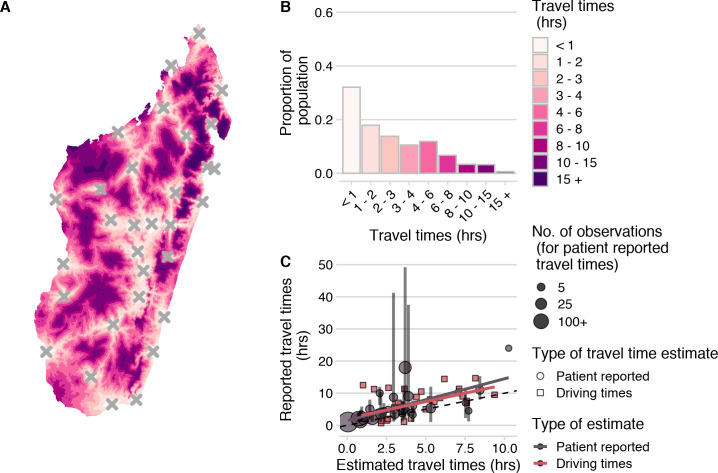
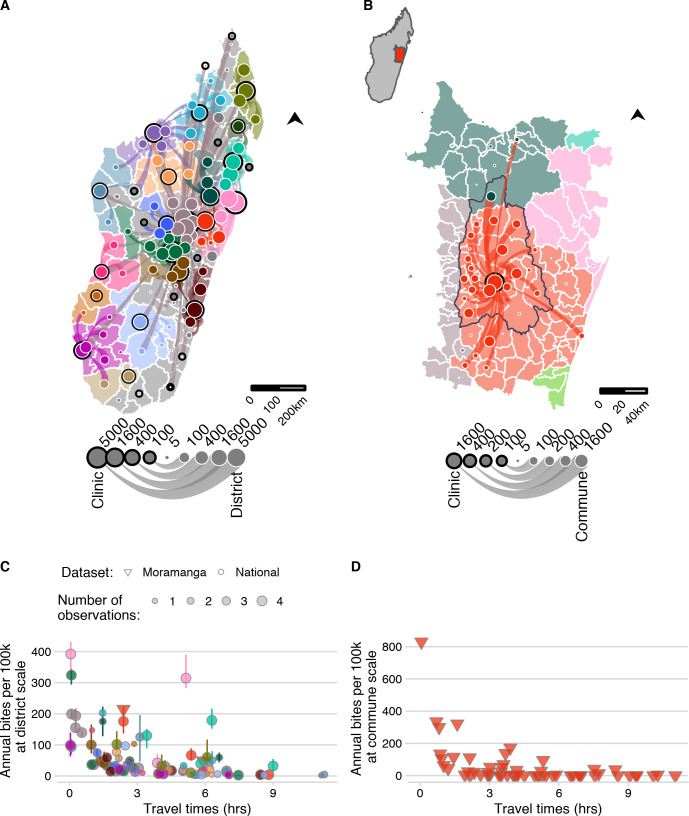
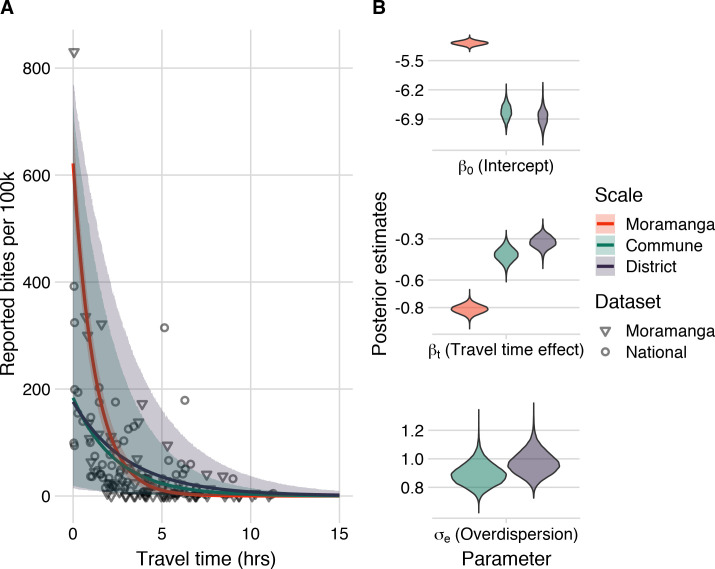
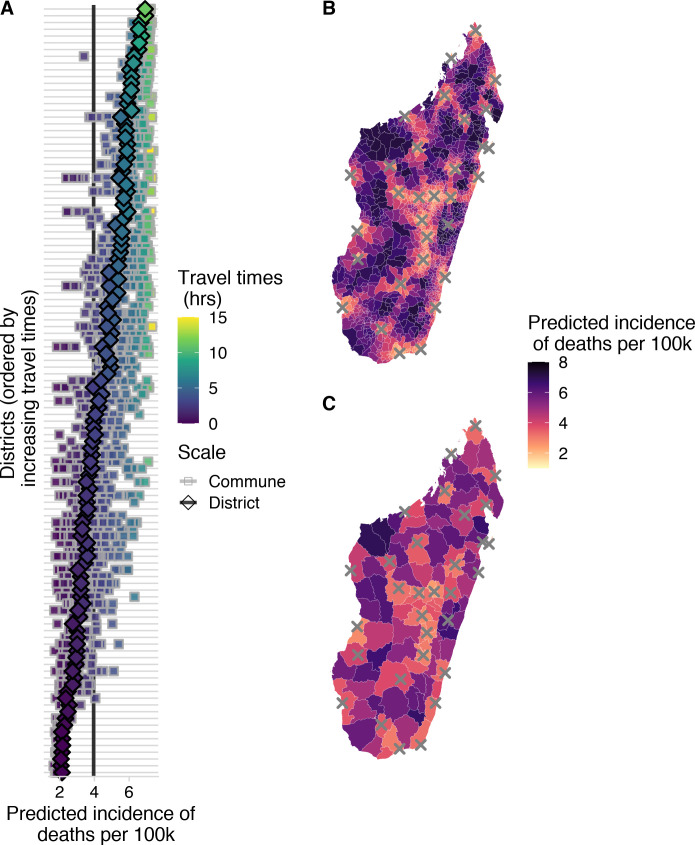
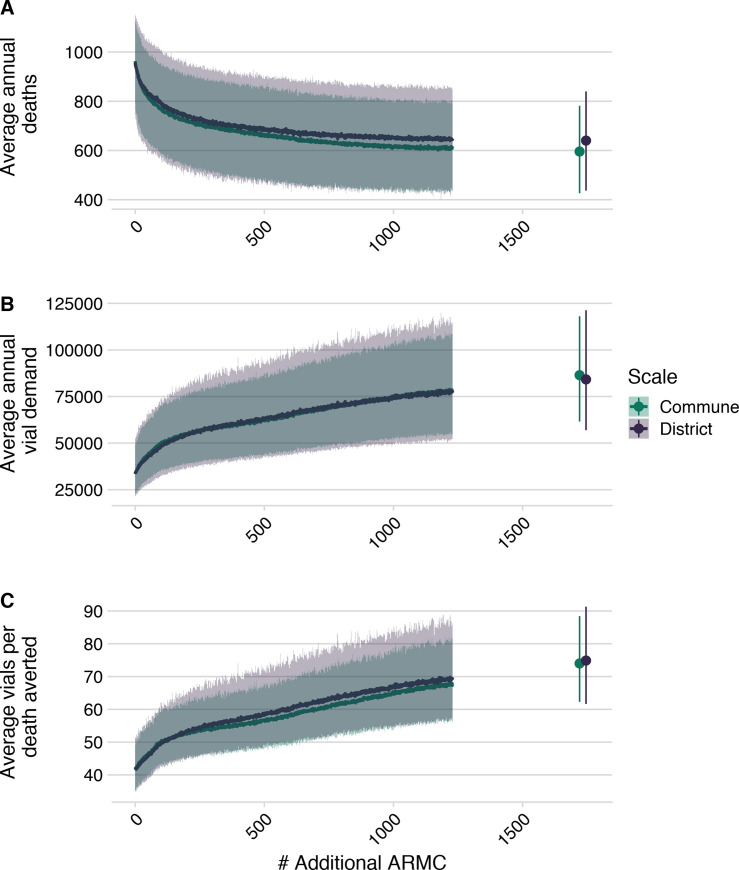
Methodology & principal findings: We use spatially resolved data on numbers of bite patients seeking PEP across Madagascar and estimates of travel times to the closest clinic providing PEP (N = 31) in a Bayesian regression framework to estimate how geographic access predicts reported bite incidence. We find that travel times strongly predict reported bite incidence across the country. Using resulting estimates in an adapted decision tree, we extrapolate rabies deaths and reporting and find that geographic access to PEP shapes burden sub-nationally. We estimate 960 human rabies deaths annually (95% Prediction Intervals (PI): 790-1120), with PEP averting an additional 800 deaths (95% PI: 640-970) each year. Under these assumptions, we find that expanding PEP to one clinic per district (83 additional clinics) could reduce deaths by 19%, but even with all major primary clinics provisioning PEP (1733 additional clinics), we still expect substantial rabies mortality. Our quantitative estimates are most sensitive to assumptions of underlying rabies exposure incidence, but qualitative patterns of the impacts of travel times and expanded PEP access are robust.

Conclusions & significance: PEP is effective at preventing rabies deaths, and in the absence of strong surveillance, targeting underserved populations may be the most equitable way to provision PEP. Given the potential for countries to use Gavi funding to expand access to PEP in the coming years, this framework could be used as a first step to guide expansion and improve targeting of interventions in similar endemic settings where PEP access is geographically restricted and baseline data on rabies risk is lacking. While better PEP access should save many lives, improved outreach, surveillance, and dog vaccination will be necessary, and if rolled out with Gavi investment, could catalyze progress towards achieving zero rabies deaths.


Conflict of interest statement

The authors have declared that no competing interests exist.

Figures

Fig 1
Fig 1. Decision tree for burden estimation.
For a given administrative unit i, human deaths due to rabies (Di) are calculated from model predicted reported bites (Bi). To get Ri, the number of reported bites that were rabies exposures, we multiply Bi by prabid, the proportion of reported bites that are rabies exposures. Ri is subtracted from Ei to get the number of unreported bites (Ui) and then multiplied by the probability of death given a rabies exposure (pdeath) to get deaths due to rabies (Di). Similarly, deaths averted by PEP, Ai, are estimated by multiplying Ri by pdeath, i.e. those who would have died given exposure, but instead received PEP. Both Ei and prabid are drawn from a triangular distribution. Parameter values and sources are listed in Table 1.
Fig 2
Fig 2. Travel times to clinics provisioning PEP across Madagascar.
(A)) Estimated at an ~ 1 km2 scale using the estimated from the Malaria Atlas Project friction surface (https://malariaatlas.org/research-project/accessibility-to-cities/, CC-BY 3.0) and on human population from WorldPop (https://www.worldpop.org/geodata/summary?id=70, CC-BY 4.0). (A)) Estimated at an ~ 1 km2 scale using the estimated from the Malaria Atlas Project friction surface (https://malariaatlas.org/research-project/accessibility-to-cities/, CC-BY 3.0) and on human population from WorldPop (https://www.worldpop.org/geodata/summary?id=70, CC-BY 4.0). (B) Distribution of the population across travel times. (C) Correlation between ground-truthed travel times (mean of patient reported travel times to the Moramanga PEP clinic at the commune level and reported driving times between GPS points) and friction surface travel time estimates. The vertical lines show the 95% quantiles for reported travel times and the point size shows the number of observations for each commune. The best fit lines (red and grey) from a linear model where observed travel times are predicted by estimated travel times for each data source are also shown. The dashed black line is the 1:1 line.
Fig 3
Fig 3. The network of patient presentations and estimates of annual bite incidence.
(A) at the district level for the national data and (B) commune level for the Moramanga data: circles with a black outline represent the total number of patients reporting to each clinic for which we have data. Color corresponds to the clinic catchment. Circles with a white outline are the total number of bites reported for that administrative unit (plotted as the centroid). Lines show which clinic those patients reported to, with the line width proportional to number of patients from that district reporting to the clinic; flows of less than 5 patients were excluded. Out-of-catchment reporting is indicated where points and line colors are mismatched. For panel (A) districts in catchments excluded due to lack of forms submitted by the clinic are colored in grey. For (B) the inset of Madagascar shows the location of the enlarged area plotted, which shows the district of Moramanga (outlined in black), all communes included in it’s catchment (red polygons), and other communes where bites were reported to colored by their catchment (C) The estimated average annual bite incidence from the national and Moramanga data plotted at the district scale (both datasets) and at the (D) commune scale (Moramanga dataset). Colors correspond to the clinic catchment, shape indicates the dataset, and the size of the point indicates the number of observations (i.e. the number of years for which data was available for the national data; note for Moramanga 33 months of data were used). The point lines indicate the range of estimated bite incidence for each district. Mapped administrative boundaries from OCHA via HDX (https://data.humdata.org/dataset/madagascar-administrative-level-0-4-boundaries, CC-BY-IGO).
Fig 4
Fig 4. Travel times as a predictor of reported bite incidence per 100,000 persons.
(A) The estimated relationship between travel time in hours (x-axis) and mean annual reported bite incidence (y-axis). The lines are the mean estimates and the envelopes are the 95% prediction intervals generated by drawing 1000 independent samples from the parameter posterior distributions for three candidate models: model with travel times at the 1) commune- and 2) district-level fitted to the national data with an overdispersion parameter (σe) and 3) travel times at the commune level fitted to the Moramanga data with a fixed intercept and unadjusted for overdispersion. The points show the data: National data (circles) at the district level used to fit the District and Commune models, and Moramanga data (triangles) at the commune level used to fit the Moramanga model. (B) The posterior distribution of parameters from the respective models for the model intercept, travel time effect, and for overdispersion (national data only).
Fig 5
Fig 5. Spatial variation in predicted incidence of human rabies deaths per 100,000 persons.
(A) for each district (y-axis) in Madagascar. Diamonds show the predicted incidence for the district model and squares show predicted incidence for the commune model fit to the National data for all communes in a given district. Points are colored and districts ordered by travel times. The vertical lines show the average national incidence of human rabies deaths for the commune (grey) and district (black) models. Incidence mapped to the (B) commune- and (C) district-level from the respective models; grey X’s show locations of current clinics provisioning PEP. Mapped administrative boundaries from OCHA via HDX (https://data.humdata.org/dataset/madagascar-administrative-level-0-4-boundaries, CC-BY-IGO).
Fig 6
Fig 6. Impact of expanded PEP access on deaths, deaths averted and vial demand.
(A) Decrease in deaths due to rabies, (B) increase in total number of vials as additional clinics provisioning PEP are added at the national level, and (C) increase in vials needed per death averted based on the two models of reported bite incidence. Lines are the mean of 1000 simulations with envelopes representing 95% prediction intervals. The points show the scenario in which all additional primary clinics and secondary clinics (N = 1733) clinics have been added).

References

    1. World Health Organization. World health statistics 2018: Monitoring health for the SDGs Sustainable Development Goals. World Health Organization; 2018.
    1. Peters DH, Garg A, Bloom G, Walker DG, Brieger WR, Hafizur Rahman M. Poverty and access to health care in developing countries. Annals of the New York Academy of Sciences. 2008;1136: 161–171. 10.1196/annals.1425.011 - DOI - PubMed
    1. Maina J, Ouma PO, Macharia PM, Alegana VA, Mitto B, Fall IS, et al.. A spatial database of health facilities managed by the public health sector in sub–Saharan Africa. Scientific Data. 2019;6: 134. 10.1038/s41597-019-0142-2 - DOI - PMC - PubMed
    1. WHO Rabies Modelling Consortium. The potential effect of improved provision of rabies post-exposure prophylaxis in Gavi-eligible countries: A modelling study. The Lancet Infectious Diseases. 2019;19: 102–111. 10.1016/S1473-3099(18)30512-7 - DOI - PMC - PubMed
    1. Organization WH, others. Rabies vaccines: WHO position paper, April 2018–recommendations. Vaccine. 2018;36: 5500–5503. 10.1016/j.vaccine.2018.06.061 - DOI - PubMed

Publication types